Weekly Newsletter   Challenge account   Weekly Newsletter   


Posted by Martin February 03, 2016
4 Comments


Shocking: The USA economy in a disastrous death spiral


FED
(Source: Hedgeye)
 

The FEDs and the government want you to believe that the US economy is in great shape and better than ever.

But you can ask yourself a simple question: Are you better off than 8 years ago?

If you answered yes, then why are we receiving horrible numbers from all corners of the US economic machine?

How come people are not spending? If they were inflation would skyrocket, but all we see is deflation.

Today, we just hit a record and it is not anything we should be proud of. This is a result of a Keynesian economy and teaching of getting ourselves into prosperity by spending a horrendous money via debt.

Yes, today, our national debt reached a staggering $19,005,034,217,418 dollars under Obama’s administration. That’s a bit over 19 trillion of debt. Our socialist government is the only one (and its followers) which believes that more debt solve the old debt.

I remember once when I was in Britain traveling in a public transportation I saw and advertisement providing a new loan to consolidate the old one. It even offered to borrow more, to pay the old debt and use the rest of the money for shopping. You could eliminate your old debt and even go and buy yourself some goodies!

WarningWell, never don’t try this at home! As goes the famous disclaimer. If you do try you will end up broke and maybe even in prison for fraud.

The national debt translates into $58,849.00 dollars per citizen and that includes babies, elderly, and welfare recipients. That’s more than real household annual income!

In 2007 the real median household income in the United States was $57,357.00 dollars. Today (or actually at the end of 2014 as we do not have 2015 data yet), it is $53,657. An average American household owes more that it can ever make!

 
FRED
 

The main reason for increased debt is growing federal spending mostly Social Security, Medicare, Medicaid, and Obamacare (Source: Daily Signal).

Unfortunately, it seems that we are not going to get any better soon. Let’s take a look at some other numbers:

US workforce (participation) in 2000: 154,575,324
US workforce (participation) today: 150,167,590

Manufacturing jobs in 2000: 19,629,554
Manufacturing jobs today: 12,349,931

The Congressional Budget Office (CBO) predicts that our debt will reach $26.3 trillion dollars by the end of 2020.

With raising interest rates it will be difficult for the FED and the US government to maintain such debt and it will lead to a financial meltdown never seen before.


We all want to hear your opinion on the article above:
4 Comments


Posted by Martin February 02, 2016
No Comments


Bull is dead, long live the bear!


FED
(Source: Hedgeye.com)
 
Last Friday trading and rally was impressive. I hoped it would last longer than this. Today, the market gave up almost all gains from Friday. It really didn’t take long.

First, the Friday’s rally was based on a Bank of Japan’s decision to lower the interest rates below zero (negative rates), which itself makes no sense. If the zero interest rates didn’t help the economy, why they think negative rates would do the job?

Second, if you look at the magnitude of the rally, you would think “This is it, that’s the reversal and bottom”. Well the lack of any follow through on Monday or today clearly indicates that this market is weak.

In my few previous posts I mentioned that now we should sell any strength, any rally. Today’s price action reiterates that idea. Even if we bounce tomorrow, which I do not expect at all, sell into it.
Unfortunately since my account is small I cannot take more trades on as I would violate cash management rules otherwise I would have been adding more bear call spreads.

Do not hesitate or be too shy to be aggressively bearish. We are in a bear market and unless FED comes up with negative rates or QE4 we are heading down. Of course, there will be bounces, some even violent and strong on the way down. It is typical for a bear market. These will offer great opportunity to short the market!

Economy is heading into recession. It may burst this year or next one. We may already be in a recession although there is still plenty of people who refuse to accept that fact. Until this changes or until we undergo the self-healing process of the economy without unhealthy interventions of the FED or the US government, we will go down. If FED comes up with any of their sick solution, the problem will only be extended into the distant future.

But one day, we will enter a point when none of the FED’s medicine will have any healing effect and we will crash hard.

My conclusion? Sell any strength of this market.


We all want to hear your opinion on the article above:
No Comments


Dividend Investor: How to track a dividend growth portfolio


ROTH IRA
 

Finally, I was able to finish my DGI (dividend growth investment) portfolio tracker in Google spreadsheet.

There are many other fellow investors out there who use Excel or Google Spreadsheet to track their portfolios and when I browsed the internet to find inspiration and knowledge on how to automate my portfolio tracker so I can analyze my portfolio without having it updating manually I came across many great web sites and blogs.

I consider myself a spreadsheet geek who loves to create a plenty of spreadsheet to gain all sorts of possible point of views to see the portfolio from different angles. Of course, in the past I overdone that and since many of my tracking spreadsheets required manual update soon it became tedious and boring work.

So I scratched it all and decided to start over.

I found a great inspiration out there in the blogosphere. A great source of all sorts of spreadsheets to track and analyze your dividend portfolio comes from Scott and his Two Investing blog. He says that he got an inspiration from my calendar page but for sure, he uplifted those spreadsheets into perfection. Definitely, you must check his spreadsheets out.

I also found a good inspiration at No More Waffles and his spreadsheets, I liked the currency tracker since the investor is from Belgium and thus invest in different currencies. I liked his sector charts as they ended up really better indicating what sector goes over the roof in your portfolio and which sectors are underinvested. If you use a pie, you end up with a nice colored circle, but that won’t help much in my opinion.

And of course a good resource to creating my spreadsheet was The Dividend Meter with a pretty cool way of visualizing your dividend progress.

But what inspired me the most was a discussion with a dividend investing blogger about his model portfolio and how the stocks in that portfolio would do in the future. The discussion went on about to see what the entire portfolio would do.

And because I am an old man and I forget everything I now do not remember who that blogger was and what actually we were talking about in details. But one thing inspired me, and it was an idea of creating metrics so you can evaluate the entire portfolio and based on that you can predict the future size of that portfolio and what dividends you would probably receive.

So I created my spreadsheet as shown above this post.

What’s exciting here is that all data which are in yellowish cells are automatically updated. Only the blue cells are those I have to insert manually and I am fine with that. It is only the number of line (also showing how many individual stocks I hold), stock symbol, quantity and trade price. These numbers need to be uploaded from my broker’s account manually and I am OK with that as of now. Everything else uses formulas from either Google finance or Yahoo.

 
You can see the entire document with live data here.
 

What I consider great with this spreadsheet is that now I can see what my entire portfolio does as far as dividend income and dividend growth!

As you can see, my entire portfolio yield on cost (YOC) is 7.23% and my entire portfolio dividend growth is 7.73%.

Of course, all this will change since for example my KMI dividend yield hasn’t been updated yet to the new cut dividend, same goes with LGCY distribution suspension, but that is OK as I have enough data to calculate my portfolio future.

I can now use the existing data and once the new data come in (once Yahoo updates them) I will be able to recalculate the new portfolio future.

And what is my portfolio future?

Here is my future YOC and Income if I reinvest dividends (with no further contributions):


Year Income Yield on Cost Holdings Value
1 $1,271.93 7.23% $18,864.31
2 $1,469.32 8.35% $20,333.63
3 $1,706.19 9.70% $22,039.81
4 $1,992.31 11.32% $24,032.12
5 $2,340.33 13.30% $26,372.45
6 $2,766.76 15.73% $29,139.21
7 $3,293.34 18.72% $32,432.55
8 $3,948.90 22.45% $36,381.45
9 $4,772.12 27.13% $41,153.57
10 $5,815.35 33.06% $46,968.92
11 $7,150.16 40.64% $54,119.08
12 $8,875.48 50.45% $62,994.56
13 $11,129.64 63.26% $74,124.20
14 $14,108.31 80.20% $88,232.51
15 $18,091.73 102.84% $106,324.24
16 $23,486.62 133.50% $129,810.86
17 $30,891.28 175.59% $160,702.13
18 $41,198.67 234.18% $201,900.80
19 $55,761.73 316.97% $257,662.53
20 $76,663.05 435.77% $334,325.58

As you can see, if you start investing as early as you can, even small money, your account will grow into a big money making machine and you will be literally able to retire in 20 years.

It is not the value of your portfolio but income it can generate. My portfolio, unless something disastrous happens, will be able to grow my yield to the original cost to a whopping 435.77% in 20 years!

Today, I started with $17,592.38 portfolio and I will end up with $334,325.58 for a total gain of a whopping 1,800.40%. Over 20 years of my portfolio life that will make my average annual gain 90.02%.

Of course, this doesn’t take into account any future contributions which will increase all numbers faster. Let’s see how this portfolio will do over time. At least, today I have created a baseline to my portfolio.


We all want to hear your opinion on the article above:
6 Comments


Posted by Martin January 24, 2016
2 Comments


Dividend Investor: DRIP or selective dividend reinvestment?


Dividend Meter

If you are new to dividend investing you are probably asking yourself a question: “Should I use DRIP (Dividend Reinvestment Program) to reinvest dividends or should I reinvest selectively into different stocks?”

This question is actually quite easy to answer, but first lets take a quick look at what each strategy means:


 · DRIP


DRIP is a program you can set with your broker up and automatically reinvest all your dividends back to the stock which generated that dividend. It is free (no commissions and fees), you can be buying fractional shares of the stock, easy to set up, and it is totally on autopilot. As soon as you receive a dividend, it is automatically reinvested without your intervention.

I didn’t use DRIP in the past, but at the end of the last year (2015), I decided to set it up. Later in this post I will explain why you should do it too; when and why.


 · Selective dividend reinvestment


You can choose reinvesting dividends selectively into different stock(s) or a stock which generated the dividend. They are not automatically reinvested. When you receive a dividend you keep it in your account as long as you accumulate enough to buy new shares of any stock you choose.

Unfortunately, with the selective dividend reinvestment you will pay a commission as it will be recognized by your broker as a regular trade. For this reason you need to accumulate enough cash to make it a meaningful trade so commission won’t “eat you up”. I, myself, have a limit $1,000 per trade. Buying with less money will cost you more on commissions.

For example, if you are trading with TD Ameritrade and they charge you $9.95 per trade, buying shares for $100 would cost you almost 10%. And to make 10% loss, your stock will have to go up almost 20% to break even.

With $1,000 amount your commission loss will be a bit less than 1% and that is acceptable.

I used to use this strategy, but no longer do it. But at some point in the future I will get back to this strategy. Find out below why and when you should do this too.


 · Selective dividend reinvestment or DRIP?


The answer to this question is easy.

You should use DRIP every time your portfolio generates less than your limit per month. Once you start making your limit amount per month, you can switch to the selective reinvestment strategy to boost your dividend income.

For example, if my limit is $1,000 per trade and my dividend portfolio generates less than that per month, I will use DRIP. Why?

If you just started and generate for example $100 per month in dividends, you will be waiting a whole year to be able to do your next purchase. It means, your cash will be sitting in your account doing nothing for the entire year! Not acceptable for me.

Of course, this is a simplified view as you can take into account your monthly contributions and adjust your limit and dividends accordingly. That means, if you can afford contributing for example $200 dollars per month, then you need $800 dollars per month in dividends to switch from DRIP to selective reinvestment strategy.

For example, I invest into dividend growth stocks (DGS) primarily in my ROTH IRA account. With annual contributions limit of $5,500 dollars I can contribute $458 dollars monthly not to exceed this limit. The remaining $542 dollars must come from dividends per month in order to switch into selective dividend reinvestment. Having such cash sitting in an account for a month or two before I can invest is not acceptable to me. Those monies could work for those two months instead.


We all want to hear your opinion on the article above:
2 Comments


Posted by Martin January 22, 2016
2 Comments


Rally! Hurrah, all is good again!


Hold your horses. We may have experienced a rally here but it may not mean we are done with selling. It is just a mere volatility entering the market. It is also typical for bear markets to have violent bullish spikes on its way down.

Before you jump on buying (or selling) long investments (or trades respectively) be careful. Even if this market goes up to 2000 or even 2200 it still can crash hard. And I believe, we will. I am not an economist, just a lame guy who tries to make money in this crazy market, but all economic data I can see coming in and analyze them look bearish to me.

And it seems that the market is seeing it too. But first let’s take a small reality check:

 
Bloomberg
(Source: Bloomberg)
 

Let’s take a look at today’s rally:

 
Bloomberg
 

At the first glance the rally looks impressive.

But what sparked this rally? Improved economic data? No, the market mover this time was Mario Draghi announcing that the European interest rates will stay unchanged (and negative).

This will most likely be a short lived rally then.

And what about intraday move? Check this out:

 
Bloomberg
 

Most of the rally actually happened in an overnight trading (futures). The intraday trading was more like a roller coaster.

The conclusion of this rally? Sell on strength…


We all want to hear your opinion on the article above:
2 Comments


Posted by Martin January 21, 2016
2 Comments


Dividend investor: buying stocks in falling market


Lately, when the market was tanking I had a few of my friends who invest into stocks asking me how to invest when markets are falling. When would be a good time to buy?

You probably experienced situations in the past when you bought a stock and then the stock went higher, and later higher, and higher again. It was probably a great feeling and happy investing.

But when the markets or stocks go down you buy a stock and the stock immediately falls down and you end up sitting on a loss. How many times this happened to you?

It happened to me a countless times.
 

Although, for dividend investor, the value of the stock or entire portfolio is not as important as income it generates, it is not much comforting seeing your holdings in red, right?

There is a way how you can avoid this effect when buying stocks in declining market or at least minimize the negative impact of falling stock prices. You can achieve it by timing your entry.

You might have heard a dozen times that it is impossible to time the market, however I will teach you a method how to bottom fishing and attempt to buy a stock of your interest at the lowest possible level. And works perfectly in a falling market!

The method can save you significant amount of dollars when buying stocks and help you to get the most bang for your money.

I have been using this method for about 5 years right now and it helped me to buy my stocks for a lot less than I originally anticipated.

So let’s dive in the rules I use when buying stocks in a falling market:


 · Rule #1: Don’t use all your cash at once


When you have more than $1,000 to invest, split it into smaller amounts. Never buy your desired stock using the entire amount at once. For example, if you have $3,000 available for your purchase, split it into three $1,000 purchases or two $1,500 purchases.

Do not go however, under $1,000 dollars amount to avoid high commissions and fees unless you can buy cheap or even for free.

Why you want to split the purchase amount? In falling market the stock may continue falling after your initial purchase so you want to buy next time at a lower price and average your cost.


 · Rule #2: Place your purchase above the previous market high


When buying stocks in a falling market I created a strategy where I calculate my entry based on the previous day trading. The new price is higher than the previous price (previous day high) and I buy the stock only if that price is reached. If it is not reach I trace the price down with the stock.

Here is the calculation I use to determine my entry:

 
(( 1/2 * ( Day Price High – Day Price Low )) + Last Price ) * 1.01
 

I calculate the day trading range of the stock between a day low price and a day high price. The divide this intraday range in half. Add the result to the closing price and multiply everything by 1%.

That will be your purchase price.

Let’s look at Caterpillar (CAT) example:

Let’s say, today, I decide to purchase shares of Caterpillar and I have $3,000 dollars available.

Previous rule tells me not to use the entire amount, so I split it into (3) $1,000 dollars purchases. My initial purchase amount will be $1,000 dollars and I keep remaining $2,000 dollars in reserve for the next purchase.

 
Today CAT closed at $59.69 a share.
The intraday high was $60.42
The intraday low was $58.25
 

Here is the equation again:

((1/2 * (60.42 – 58.25 )) + 59.69 ) * 1.01 = 61.38

My next purchase will be 61.38
 

I created a spreadsheet which calculates this price for me. I just enter a symbol and amount I wish to invest and it calculates the entry price and how many shares I can buy.

Stock calcs
(Click to enlarge)

You can download this spreadsheet here.


 · Rule #3: Use contingency order or “one triggers other” (OTO)


Here comes the fun part. Now that we know our entry price, we can place a contingency order or one triggers the other order (OTO). Most brokers have this type of the order available in their platform.

What this does it that you place your buy order above the previous intraday high price and then trace your purchase limit order down with the stock. When the stock is falling, the order is sitting there and doesn’t execute. You trace the stock lower and lower, and your buy order executes only when the stock reverses.

 
What the OTO does? It is made of two orders. One order is a trigger order and when the condition is met, the buy order is triggered. Our OTO order would look like this:

 
TRIGGER:  If CAT last price is equal or higher than 61.38 then
LIMIT BUY ORDER:  buy 16 CAT at 61.38 LIMIT.

 
If the stock continues falling the trigger order is not hit and thus your buy order is inactive. You trace the stock down until the stock stops falling and reverses. When the stock reverses and hits the target the trigger order activates your limit buy order.

But your buy order executes only if the price stays below the trigger price. This feature protects you against buying at big gaps up. When the stock gaps up, the buy limit order will be activated, but it will not execute.

Let’s take a look at this process graphically (if you are a visual person like me, this may be helpful):

 
Stock calcs
 
Stock calcs
 
Stock calcs
 
Stock calcs
 
Stock calcs
 
Stock calcs
 
Stock calcs
 
Stock calcs
 

You repeat this process every day until you buy all your shares you originally planned to buy. This method is not 100% foolproof but will help you to be buying as low as possible at stock’s reversal and not at high price.

If the stock is falling, you most likely do not buy immediately and then sit on a loss. Your buy price order will be going down with the stock and you buy at reversal. The calculation above will ensure that the reversal will most likely be a meaningful one and not just a small bounce.

 
After 5 years of using this method it helped me buying new stocks a lot cheaper then what I originally thought or expected or what I would have bought if I bought outright when I decided to buy.

Many times I could buy more shares then what the original calculation assessed. For example, I was going to buy 16 shares of a stock which started falling and when I finally bought after tracing the stock down, I could buy 19 shares.

With dividend paying stocks, you are able to get more dividends for your money when buying more shares and that’s what matters the most in dividend investing.


We all want to hear your opinion on the article above:
2 Comments


Posted by Martin January 20, 2016
No Comments


Betting on Deflation May Be a Huge Mistake. Here’s Why…


Precious metals investors heading into 2016 worry the dollar will continue marching ahead, right over the top of gold and silver prices. The Fed is telegraphing additional rate hikes throughout the year, and commodity prices – led by crude oil – are falling. There have been tremors in the biggest beneficiary markets of all when it comes to the Fed’s QE largesse – U.S. equities and real estate. And the possibility of a recession is growing, both in the U.S. and around the world.

Inflation

There are plenty of reasons we might see even lower official inflation numbers and a stronger dollar in 2016. But don’t think for a second that consumer prices or living costs will fall. They haven’t, they aren’t, and they never will in a sustained way – thanks to the Fed’s creation in 1913. This is where the deflationists have it wrong.

The impact of further disinflationary forces or even a deflationary episode on precious metals prices is a bit harder to predict.

The bear case for precious metals is rather simple. Should metals trade like commodities, they are likely to follow other raw materials lower. If we get a liquidity crunch akin to the 2008 financial crisis, just about everything will be sold as investors raise cash to meet margin calls or flee to the dollar as a perceived safe-haven.

There is also the possibility that metals prices will simply be managed lower. Growing numbers of investors realize that Wall Street is not a bulwark of free markets. Major banks have admitted to rigging markets against their own customers, and the Federal Reserve aggressively intervenes in markets in its quest to centrally plan the world economy. Why wouldn’t the Fed also be active in trading precious metals? Those dismissing the notion that metals prices are manipulated are naive.
 

 · Today’s Situation Is Different Than 2008

 
The bear case assumes history, in particular the experience surrounding 2008, will repeat. Or that there is still plenty of ability for anyone seeking to force metals prices lower in the futures market to actually do so. Or both.

Maybe. But relying on those assumptions could be a tragic mistake.

For starters, the U.S. dollar is already near record highs. Meanwhile, commodities and precious metals have been beaten down mercilessly. This set-up is the complete opposite of what faced investors leading up to the summer of 2008. And even though stocks and commodities got hammered in 2008, gold posted modest gains for the year as a safe haven from the threat of a collapsing economy.

Lower gold and silver prices have already produced an imbalance between bullion supply and demand. Supply deficits in 2016 are likely to make the developing problem with inventory at the COMEX and other exchanges even bigger. Registered stocks of gold all but vanished recently as bargain hunters, particularly in Asia, have been happy to buy and take delivery. Silver inventories aren’t in much better shape.

More deliverable bars must come from existing stocks, but holders won’t be anxious to sell. Those with “eligible” COMEX bars have certainly been slow to convert them to “registered” of late. By all indications, miners will be unable to provide the needed supply.

Inflation

With prices below the cost of production, mine output is set to drop significantly this year.

If the metals markets look forward, as markets are supposed to do, they will anticipate the Fed’s response to a strengthening dollar and economic malaise. In 2008, investors knew little about the lengths to which the Fed would be willing to go. Today they DO know. The Fed will overwhelm deflation by creating new inflation.

Markets are completely dependent on Fed stimulus, and people simply expect officials to roll out an even bigger initiative whenever the need arises. Anything to prevent the cleansing effect of corrective forces from restoring heath to the economy. In a recent interview, market expert Jim Rickards predicted the Fed will abandon rate increases and actually commence lowering before the year’s end.

Metals investors should take heart in the fact that gold and silver prices have shown some resilience in the face of disinflationary forces recently. Both metals outperformed oil and most other commodities last year. Yes, prices declined roughly 11% for both metals. But crude oil fell 36% and copper lost 22%. The precious metals gained purchasing power against many other things.

Bottom line: Don’t bet on a meaningful deflation. Fed officials will not allow it. And they can keystroke dollars into existence until the power goes out for good.
 

Inflation

Clint Siegner is a Director at Money Metals Exchange, the national precious metals company named 2015 “Dealer of the Year” in the United States by an independent global ratings group. A graduate of Linfield College in Oregon, Siegner puts his experience in business management along with his passion for personal liberty, limited government, and honest money into the development of Money Metals’ brand and reach. This includes writing extensively on the bullion markets and their intersection with policy and world affairs


We all want to hear your opinion on the article above:
No Comments


Posted by Martin January 20, 2016
No Comments


FED: We created a sense of wealth


Marine traffic
 

Yes, these were the words of a FED member (I believe it was Stanley Fisher, but not 100% sure) who said that when he expressed his views on the last 7 years of FED action and monetary policy.

FED wanted to create a sense of wealth so people would be comforted and spend money which would prop the economy.

And they failed.

They failed miserably. How can we verify it? A simple economic indicator will tell you if the sense of wealth helped or not – inflation.

If people spend money and buy goods, the price of the goods goes up. If they do not spend, the merchants are forced to lower prices to attract more buyers. That’s it.

With FED pumping so much money into economy via QE programs, one would assume, wealth-enlightened consumers would be shopping like crazy and inflation would skyrocket.

It didn’t happen.

In couple of last weeks I posted a few articles indicating that we are heading into recession (if we are not already in recession) and bear market (we are already in the bear market) and I was posting my evidence why I think so.

Besides declining trend lines of my indicators clearly pointing to more selling, yesterday I wrote about divergence between a transportation index, DJ index, and S&P 500 index. This divergence made me to believe that we might see another 10% drop of the market.

I also posted a Marine Traffic website results where you can clearly see all large cargo ships on the world map crossing oceans transporting goods between continents.

Some of my readers objected that most of the commerce is between Europe and China or the US and China and so transatlantic transportation may not be that busy.

So let’s take a look at the Pacific commerce:

 
Marine traffic
 

Nothing. Absolutely NOTHING is moving even in the Pacific. All ships are docked or at the coast. And the Baltic Dry Index dropped again today to new all-time low.

There is still no life out there.

If you still believe that the US economy is “just fine” and rosy and we are in no way in recession, let’s take a look at another evidence, that we actually are in trouble and recession, crisis and market crash is round the corner.


 · A sense of wealth effect


To create a sense of wealth in the economy and prop consumers to spend, FED started pouring trillions of cash into economy thru QE programs. I want you to take a look at the chart below. It shows the interest rates over time (blue line), monetary base or how much money is in economy (green line) and the stock market total market value index (red line):

 
Marine traffic
 

The chart indicates when FED started pumping money into economy. What’s interesting on this chart is how the money supply become correlated with the stock market. Almost a perfect correlation.

Let’s zoom in a bit:

 
Marine traffic
 

In the zoomed chart you can clearly see the correlation between money in the economy and the stock market value. I think you can even clearly identify time when the FED took away the QE program and when they started another one. I bet, I do not even need to point it out.

Let’s zoom even closer to the top of the market and the end of QE3:

 
Marine traffic
 

When FED ended QE3 the market still felt the effect of the “wealth sensation” and moved higher upon its momentum. But as the money base started being choppy, slowing down, and basically dropping, the stock market violently corrected down to the base to become once again correlated with the money base.

When FED decided not to increase rates in September, the market again popped up on expectation of drug support continuation, but when FED raised rates in December and monetary supply started dropping, the market immediately corrected and is still in that correction.

Currently the market is at approx. 3930 level (adjusted), the money supply is at 3650 level (adjusted). If we assume that this market would go lower to become again correlated with money supply, you can expect another 7% drop.


We all want to hear your opinion on the article above:
No Comments


Posted by Martin January 18, 2016
No Comments


This market is poised for another 10% drop


The S&P 500 is now 12% off of the all-time high price. Many investors and traders say that we are way oversold and we should go up from now here or bounce.

Yes, we may bounce, but overall, market price action data indicate that selling is far from over and that we may see more selling to come. The data shows that we may drop yet another 10% before we can claim an exhaustion and trend reversal.


The video worth watching with Peter Schiff predicting how FED and Congress will most likely try to fix the coming crisis, which will at the end create an even bigger crisis. The result may be that the new medicine FED is going to prescribe may not work at all.
 

But I admit, we are at the critical support which may hold. But will it really hold? What’s ahead of us then?

We may see a relief rally, bounce, or a plain rally failure and resumed selling.


 · Relief rally


The S&P500 is at the critical support level. Last week we dropped all the way down to the August lows. Some traders were predicting this outcome way before in October and November last year. I refused to believe it as I didn’t see any catalyst for a renewed selling. Yet it happened.

 
SPX trend
 

This creates a significant support which may attract “big dippers” (dip buyers) who will be buying at these levels. The buying spree may be strong enough to move the market relatively high.

We can see the market push back up to 1980 level.

 
SPX trend
 

The dipper’s buying may even push the market all the way back to back 2060- 2070 level. However, I do not expect this outcome at all.


 · Bounce


It is possible that bulls will be able to push the market only a little, more like in August 2015 when we saw only a moderate recovery and a second dip afterwards signaling a problem. We may see a bounce to 1930 – 1940 level only. We may even see a bounce to 1900 level which is now yet another significant resistance level which bulls may not be able to overcome.

 
SPX trend
 

When reviewing other data and market behavior as I will show below, I believe this is a more probably outcome, that we only see a small bounce and then selling will resume.

But I see an even bigger chance of the market opening with a bounce up tomorrow morning, then selling resumes in the afternoon and we will see another 10% selloff in the coming days or weeks.


 · Another 10% selloff


Why I think there will be more selling coming?

There are a few reasons for it. Of course the first reason is slowing US and world (global) economy. Do you remember my post about transatlanting transportation? I wrote the post 8 days ago and I was checking the cargo ship movements time to time on the Marine Traffic website to see if the halted commerce was an anomaly or something more serious.

There are still no ships transporting goods over the Atlantic Ocean. No single oil tanker or cargo ship. They are still halted docked at the port or near cost.

If you open the web site, you will still see the same picture as the one below I posted eight day ago:

 
SPX trend
 

Is this an anomaly? Or is the website working? How else we can verify whether the traffic is moving? Let’s take a look at Bloomberg Baltic Dry Shipping index:

 
SPX trend
 

The Baltic Dry Index (BDI) measures the rates for chartering the giant ships that transport iron ore, coal and grain, and it has attracted the attention of traders and market commentators hoping to take the pulse of world trade. This index has been falling the entire second half of 2015 and is at all-time low.

It corresponds with the calm seas and no ships being deployed to transport goods overseas. It seems like no one is buying any goods and no one is selling. If this trend continues, this will impact the economy further. And not only the US economy but the entire world one.

We can see this same evolution in the transportation index (DJT). For most of the time we could see the transportation index in line with other indexes such as Dow Jones or S&P 500. but recently the transportation index has been also falling hard and dragging other indexes with it. It too fell hard in the second half of 2015.

 
SPX trend
 

But the divergence of the transportation index and other indexes is so big, that I believe the markets will tend to get into alignment with the transportation index to find equilibrium. The transportation index may rise a bit to go to meet the indexes, but mostly the indexes will fall lower to meet the transportation index. But given the fact that there is no commercial activity out there, it is more likely that it will be the indexes to go to meet the transportation index.

To do so, the indexes will have to fall another 10%.


 · How to protect yourself?


It is quite hard to provide an advice and I cannot provide any financial or investment advice. But this is what I will be doing if my expectations are correct and the markets fall another 10%.

Dividend investor

There is not much to do as a dividend investor. Even if there will be a tornado in Wall Street and markets crash I will still continue reinvesting dividends using DRIP program.

I will continue buying shares on the way down (dollar cost averaging) but I will apply a strategy I call a contingency buying order. It means that I split my cash into smaller buying lots (not the market lots). For example, if I have $3,000 to buy my next stock, I will split it into (3) $1,000 lots.

Then I will place an OTO (one triggers other) buying order, which will basically do: If the price gets at or above a certain level, trigger a buy order at or below that level at market. Then I will place my limit price approx. 10% above the previous day high price.

What this does is that if the price of the stock is falling, the buy order is not triggered and I trace it down with the stock price. Once the stock reverses and reaches my limit, it triggers the buy order and buys the stock.

I used this method successfully in the past and thanks to that I could buy stocks at a lot cheaper price than originally expected. Don’t be greedy, wait for the price to come to you.

Options trader

As an option trader I will be very careful selling puts as of now. The market doesn’t show any strength which can be used and ridden. The bounces are weak and shallow and they can be quickly sold off by bears. We are in a bear market and when in a bear market, you want to go with the trend and not against it.

I will most likely wait for a bounce and then sell that bounce by selling call spreads.


What about you? Do you have any trading plan for the bear market protecting your investments? Are you going to sell everything and stay in cash until this storm calms down or continue diligently investing?


We all want to hear your opinion on the article above:
No Comments


Posted by Martin January 16, 2016
No Comments


Why the heck are the markets tanking?


Bear market

That was a question Yahoo! has recently asked. Sometimes it really stuns me out when liberals start slowly waking up and asking such questions, which all others with common sense already knew what was happening.

Yet there is still many with the rose colored glasses on unquestionably believing everything FED and Obama’s administration is feeding them with.

At first, I wanted to answer that question why the markets are tanking. But one of the reader in the discussion responded for me. I found his answer interesting and I decided to repost it here:

It is the economy, stupid!

Jobs: There have been no private sector jobs created, but 952,000 jobs have been added to Obama’s Federal Government. Source: White House Budget.

Unemployment: The percentage of our labor force that is employed is 62.4%., meaning that 37.6% are unemployed. Source: Department of Labor

Economic Growth: Virtually non-existent. Gross Domestic Product up 0.78% (after deducting revenue from bonds purchased by the Federal Reserve Quantitative Easing Program).

Credit Rating: The first time in Americans history our credit rating was downgraded. Standard and Poor’s dropped our rating from AAA to AA+, and Moody’s followed suit. Much was based on our debt at $14.7 trillion; now at $18,923,558,492,663.

Fraser Institute of Economic Freedom, a world-recognized organization reports that in 2010 the United States ranked #2 in the world, but 5 years of Obama’s economic Socialism has caused the U.S. to fall to #16.

The Heritage Foundation, which also calculates economic freedom reports that the United States has fallen to 12th place in the world.

Debt: up $8,262,260,795, Up 77.76%, Source: US Treasury

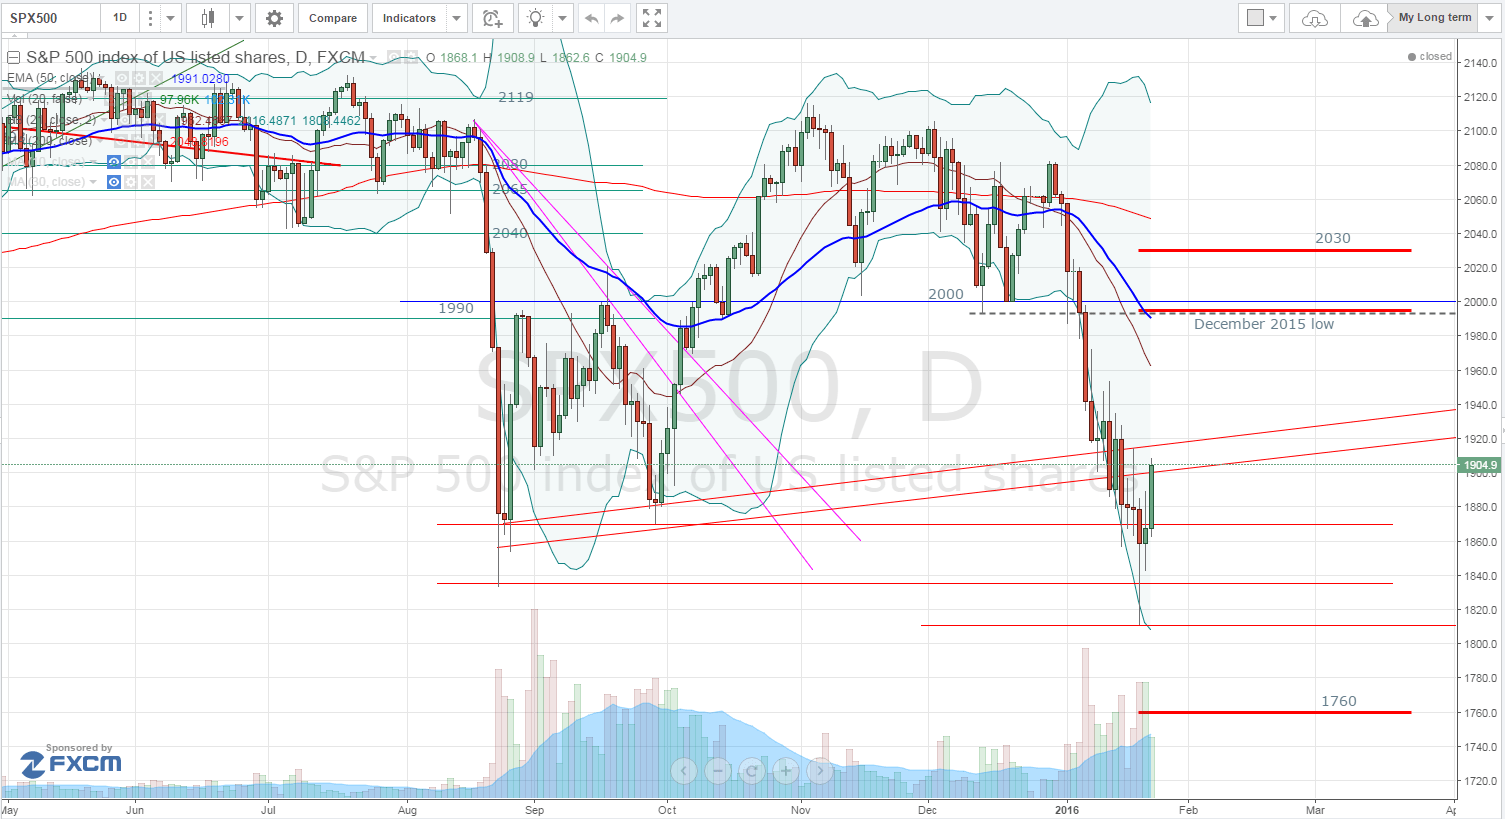
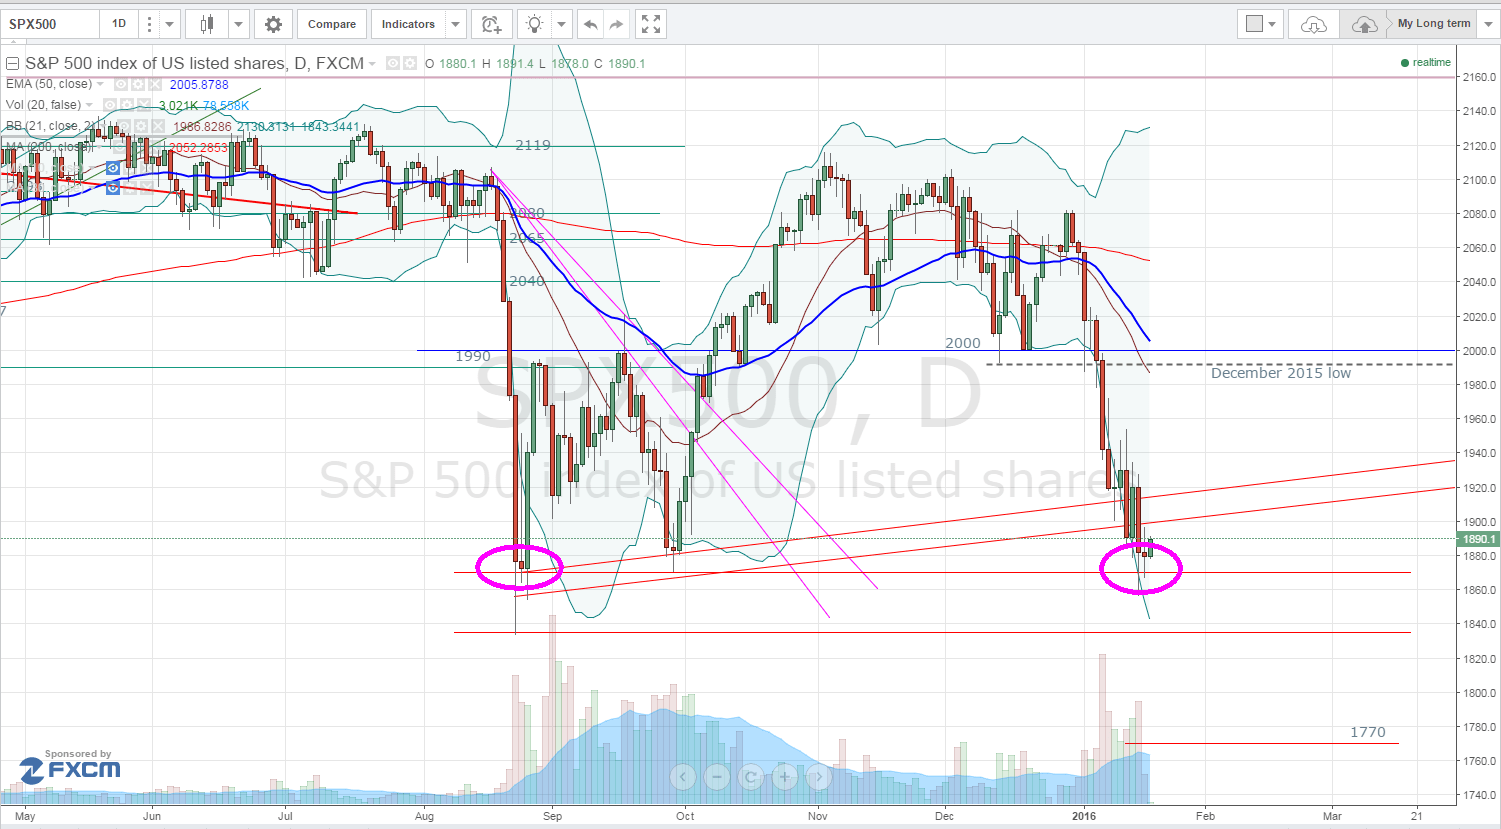
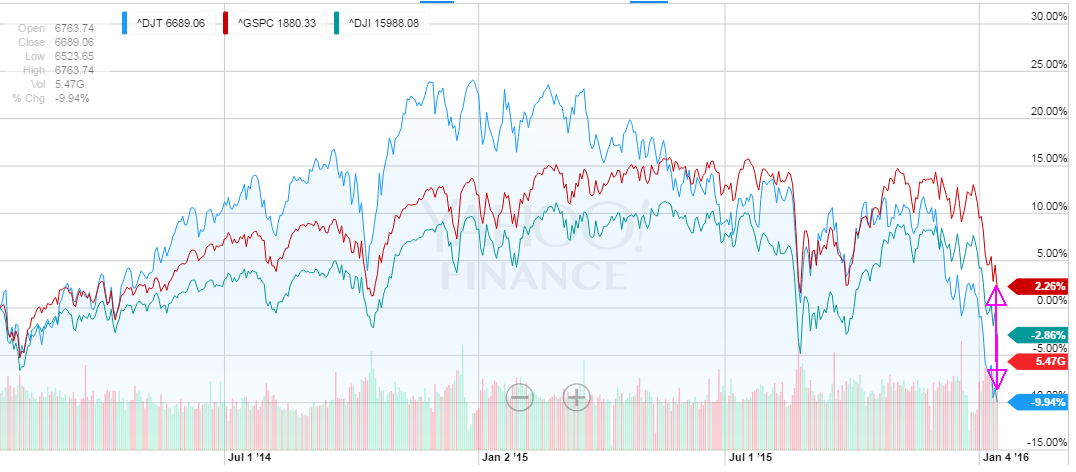
DOW Jones: Lost 96.61% of its 2015 gains since December 24, 2015.

Household Income:

Income per Capita (in 2013 dollars):

All Races -1.18%
White -0.37%
White (non-Hispanic) 0.66%
Black -1.57%
Asian -3.90%
Hispanic -1.66%

Median Household Income:

All Races -4.56%
White -1.72%
White (non-Hispanic) -3.01%
Black -6.41%
Asian -5.07%
Hispanic -0.13%

Source: U.S. Census Bureau

Poverty: 8,644,875 citizens added to our poverty rolls, Source: US Census Bureau
18,313,000 citizens added to our food stamp rolls, Source: US Dept. of Ag.
7,668,224 citizens filed personal bankruptcy, Source: US Bankruptcy Court

Health Care: Obamacare is Socialized Medicine. It is not about health care. It is about controlling the people and forcing them to become dependent of the Federal Government. It was sold to the citizens on lies, as most have experienced increases in premium and deductible costs. There is, indeed, a “death panel.” We have seen how it has worked with the Veteran’s Administration in Phoenix, AZ in 2014, where 40 wounded veterans died because they were denied basic health care needs.

National Security: There is none. Our borders are wide open, and Homeland Security has bussed in millions. Obama has released 106,000 criminal illegal aliens from our prisons, and the number of ISIS attacks continue to increase. We also have 1.7 million citizens of the radical Middle East countries here on student visa’s whose backgrounds have never been checked, and no means of determining where they are, if they have over staid their visas or if they have connection to ISIS. We need to secure our borders immediately.

Law Enforcement: Non-existent. Obama, and his neo-Marxist Democrats make victims of the villains and villains of the victims. Obama, Holder, Sharpton, and Lynch have incited our race riots in violation of Federal Law.


Judicial System: As corrupt as the rest of the Federal Government. According to the Federal Election Commission campaign finance reports, the Judges and Attorney’s PAC has contributed $2.2 Billion dollars to Democrat politicians, a full 84% of their contributions. Democrats are willing to pass millions of laws to control the citizens, and each law makes another attorney a millionaire. The Supreme Court has been stacked with Democrats, including John Roberts, who twists the law like a thing of wax. Additionally, on two occasions in 2015 he ruled on cases that resulted in money going to his family members. In one case the amount was $250,000. His administrative staff called it “human error.” Actually it is a conflict of interest, a violation of the law, and sufficient to impeach him in accordance with Article 3, Section 1 of the Constitution. We the people must demand term limits for Judges as well as members of Congress.

Guns: Obama’s teary eyed pitch for firearm control falls short of an Academy Award. It is not about controlling guns, it is about controlling law abiding citizens, making them defenseless and unable to defend themselves against murderous illegal aliens, ISIS cell members, and, possibly, from our Federal Government.

The 2009 annual report from the Center for Disease Control shows 13,200 homicides involving firearms. It further shows 2,453,000 deaths due to alcohol and alcohol related disease, and 37,423 deaths due to alcohol related auto accidents.

Marxist despots throughout history have, upon achieving power, disarmed their citizens, and then slaughtered all that refused to accept Marxist doctrine. Lenin, Stalin, Mao, Pol Pot, and Tito combined slaughtered 88,086,000 of their citizens for that very reason.

Bill Ayers, a close, personal friend of Obama’s who introduced him into politics in Chicago, was a co-founder of the Stalinist Weather Underground, an anarchist, and a convicted cop killer. In the Preface of their revolutionary Manifesto, “Prairie Fire,” they laud Sirhan for killing Bobby Kennedy.

Ayers informed Undercover FBI Agent Larry Grathwohl the Underground was prepared to slaughter 25,000,000 Americans if they refused to bow to Communism.

Thomas Jefferson said, “No free man shall ever be debarred the use of arms. The strongest reason for the people to retain the right to keep and bear arms is, as a last resort, to protect themselves against tyranny in government.”

Global Warming: Our own NASA scientists, on December 13, 2015 stated that the France boondoggle on taxpayer dollars was the grandest fraud ever perpetrated on the citizens of the world.

Consensus is not science. But there is no consensus. Only 36% of supposed scientists believe global warming is man-made, while 64% believe it is not. That includes John Coleman of Chicago, who founded the National Weather Service.

The corrupt politicians, despots, and pseudo-scientists at the U.N. created climate science out of whole cloth. And corrupt world leaders continue to bilk the citizens of their countries. Obama and his Democrats have spent $138.2 BILLION middle class taxpayer dollars funding their friends and supporters like at Solyndra. In return millions of our tax dollars are returned to Obama and Congressional Democrats in the form of campaign contribution.

Green companies launder taxpayer dollars and turn them into cash for Democrat politicians.

It is a violation of federal racketeering law, but Democrats have never found a law they believe applies to them.

We need a Congressional investigation and demand the pseudo-scientists turn over all of their scientific data.

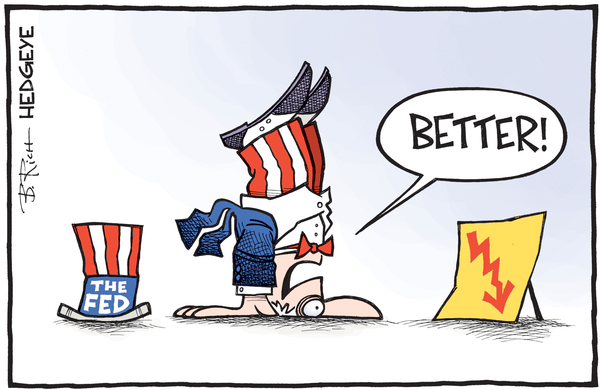
What do you think? Do we have a rosy economy and the current two weeks of selling is just transitory?


We all want to hear your opinion on the article above:
No Comments


This site has been fine-tuned by 14 WordPress Tweaks