Weekly Newsletter   Challenge account   Weekly Newsletter   


Posted by Martin March 08, 2015
No Comments


SPX (un)expected move for March 9, 2015


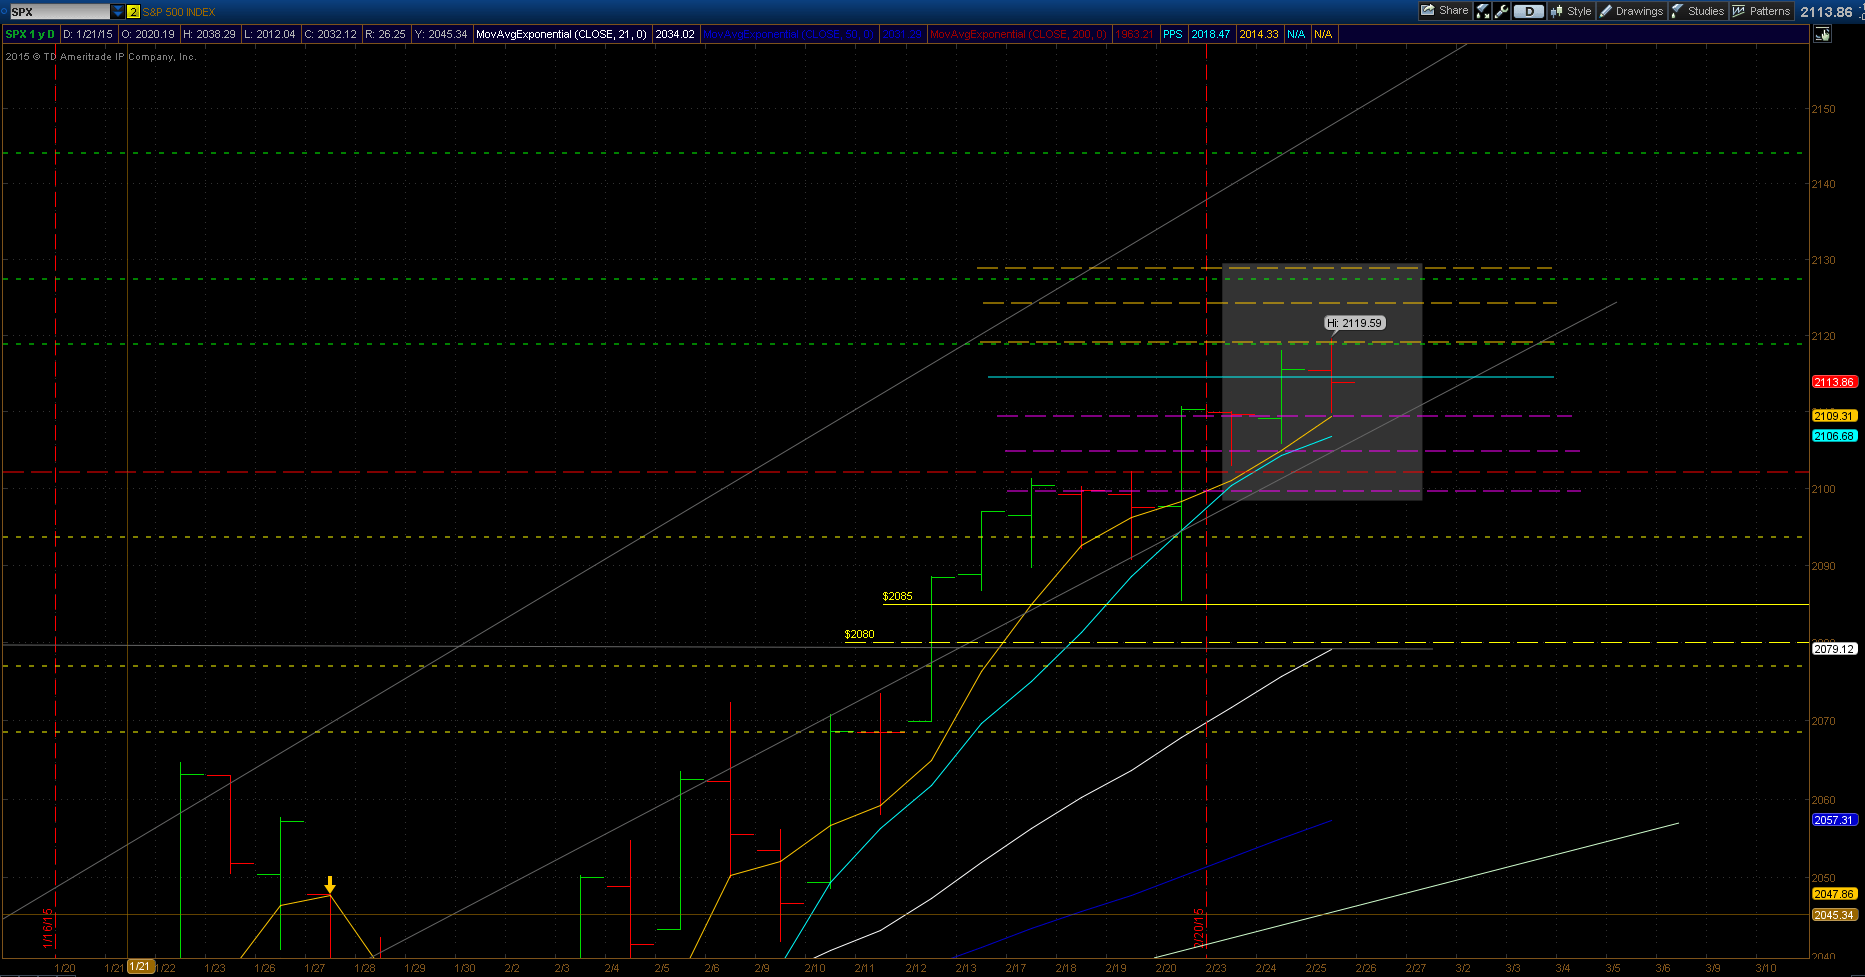
What a trading last week. I must admit, $SPX tricked me into a trap. If you go back to look at my market expectation from last Sunday I expected the market to fall down and correct the uptrend.

This is a picture I originally posted:

 
SPX expectations
 

From the chart above you can see what my expectation for the last week was. A no brainer bearish trade. Yet I decided to open a bullish put spread against SPX last week. What changed my mind was last Monday trading which showed a very strong bullish move. So I got to believe the bearish trend will not happen.

Obviously, I was wrong. The Monday’s session was a trap.

But, are we supposed to predict where the market or stock will go or will be in a week, two weeks or in 4 days?

No. We are not. Nobody can predict where the market will be. But we can get some clues from the market.

It works in patterns and cycles. Humans act that way. We like to use and behave in cycles or patterns. We have a weather patterns, seasonal patterns. We do same mistakes over and over. We react to certain situation in predictable ways with predictable actions. We learned that throughout thousands of years of human history. If there is a danger, we panic and run for shelters, if there is a sign of prosperity we are pushed into participation.

There has been hundreds of books written about human behavior in their lives and in Wall Street. And I do not write this to make yet another study and academic paper on human psychology. This is to acknowledge, that although I try to assess where the market could go or be next day, in a week, or in a month, it is not a prediction.

I try to use statistical data and chart reading to create my expectation of where the market will be heading. On Friday last week, take a look at what a statistical expectation was and what the market did:

SPX finished

As you can see the market blasted thru all supports and levels. Investors freaked out about too good job reports that they would move FED into increasing interest rates earlier than expected. Did this fear have legs and be justified?

I am not convinced. First, look at the structure of the jobs. In February employment rose by 295,000 jobs. Per the Bureau of Labor Statistics, “Job gains occurred in food services and drinking places, professional and business services, construction, health care, and in transportation and warehousing“:


  • Food services and drinking places added 59,000 jobs (20%) – low wage, mostly seasonal jobs
  • Construction added 29,000 jobs (10%)
  • Healthcare added 24,000 jobs (8%) This was decline from average 29,000 job additions in previous months
  • Transportation and warehousing added 19,000 jobs (6%)
  • Retail trade added 32,000 jobs (11%)
  • Manufacturing added 8,000 jobs (3%)
  • Business services added 51,000 jobs (17%)


So, who was the biggest contributor? Food services business services and retail trade. Food services and retail trade are mostly seasonal low paying jobs in fast food and hospitality.

I live in an area with economy based on hospitality. We have seen companies hiring. Grocery stores, fast food, hotels, all those were hiring. But they were hiring knowing that when the season ends in April or May, when the resort closes, these people will be laid off again. They even openly admit this.

What else the Bureau of Labor Statistics says?

Employment in other major industries, including wholesale trade, information, financial activities, and government, showed little change over the month.

What else do we know about the newly added jobs? The average workweek hours haven’t changed for the fifth month in a row and stays at 34 hours a week. Doesn’t this sounds like a part time job to you? It does to me. Also wages didn’t grow in February. They added 3 cents to salaries and the overall hourly rate was almost the same – $24.78 per hour.

Can we be excited about this data? In January a great growth of 257,000 new jobs was revised to 239,000 – revised down by 7%.

If investors were fearful that these numbers can make FED increase rates sooner than later, then I am not impressed at all and I think they are crazy. And what media say while investors are freaking out?

Reuters:

“U.S. factory orders fall again in January”
“U.S. jobless claims rise; fourth-quarter productivity revised down – The number of Americans filing new claims for unemployment benefits unexpectedly rose last week and nonfarm productivity contracted more sharply than previously thought in the fourth quarter.”

What Washington Post says although they praise the employment data?

But the recovery is still a fragile one, particularly because wages have been flat for years and consumer spending could pull back if energy prices again climb.

I hope I made a point, saying that the jobs weren’t that impressive as they may look at the surface and that the economy is still not in a such good shape to justify too early interest rates hike. But I may be wrong. FED may impose rates hike, make it harder for Americans (and Treasury) to pay their debt, people and business borrow more expensive money, mortgages going up higher and refinancing becomes more expensive.

I do not try to predict when and whether this event of rising rates happen. It is not my job whatsoever. And I am not even qualified for that.

In trading stocks or options, the key is not predicting the market or events. The key is to have a plan and solid money management to be able to properly react to those events. If the trade goes with you, great, make your money. If the trade turns against you, know your steps how to avoid a disaster. When trading options, you need to know how they work, where the risk is and how to manage them and eliminate that risk. Not premonitions, predictions, or witchcraft.

So what did I do with my trade? It obviously got in-the-money. Nothing enlightening and to be happy about.

But I decided to move the trade away in time and moved it. I kept the strikes.

Originally we had:

long SPX 2080 puts and
short SPX 2085

This trade was expiring last Friday. I just moved it three weeks away. I collected a credit for this roll. I increased a potential gain if this trade finishes worthless. I still have the same in-the-money trade as before. Only the expiration is now at the end of March.

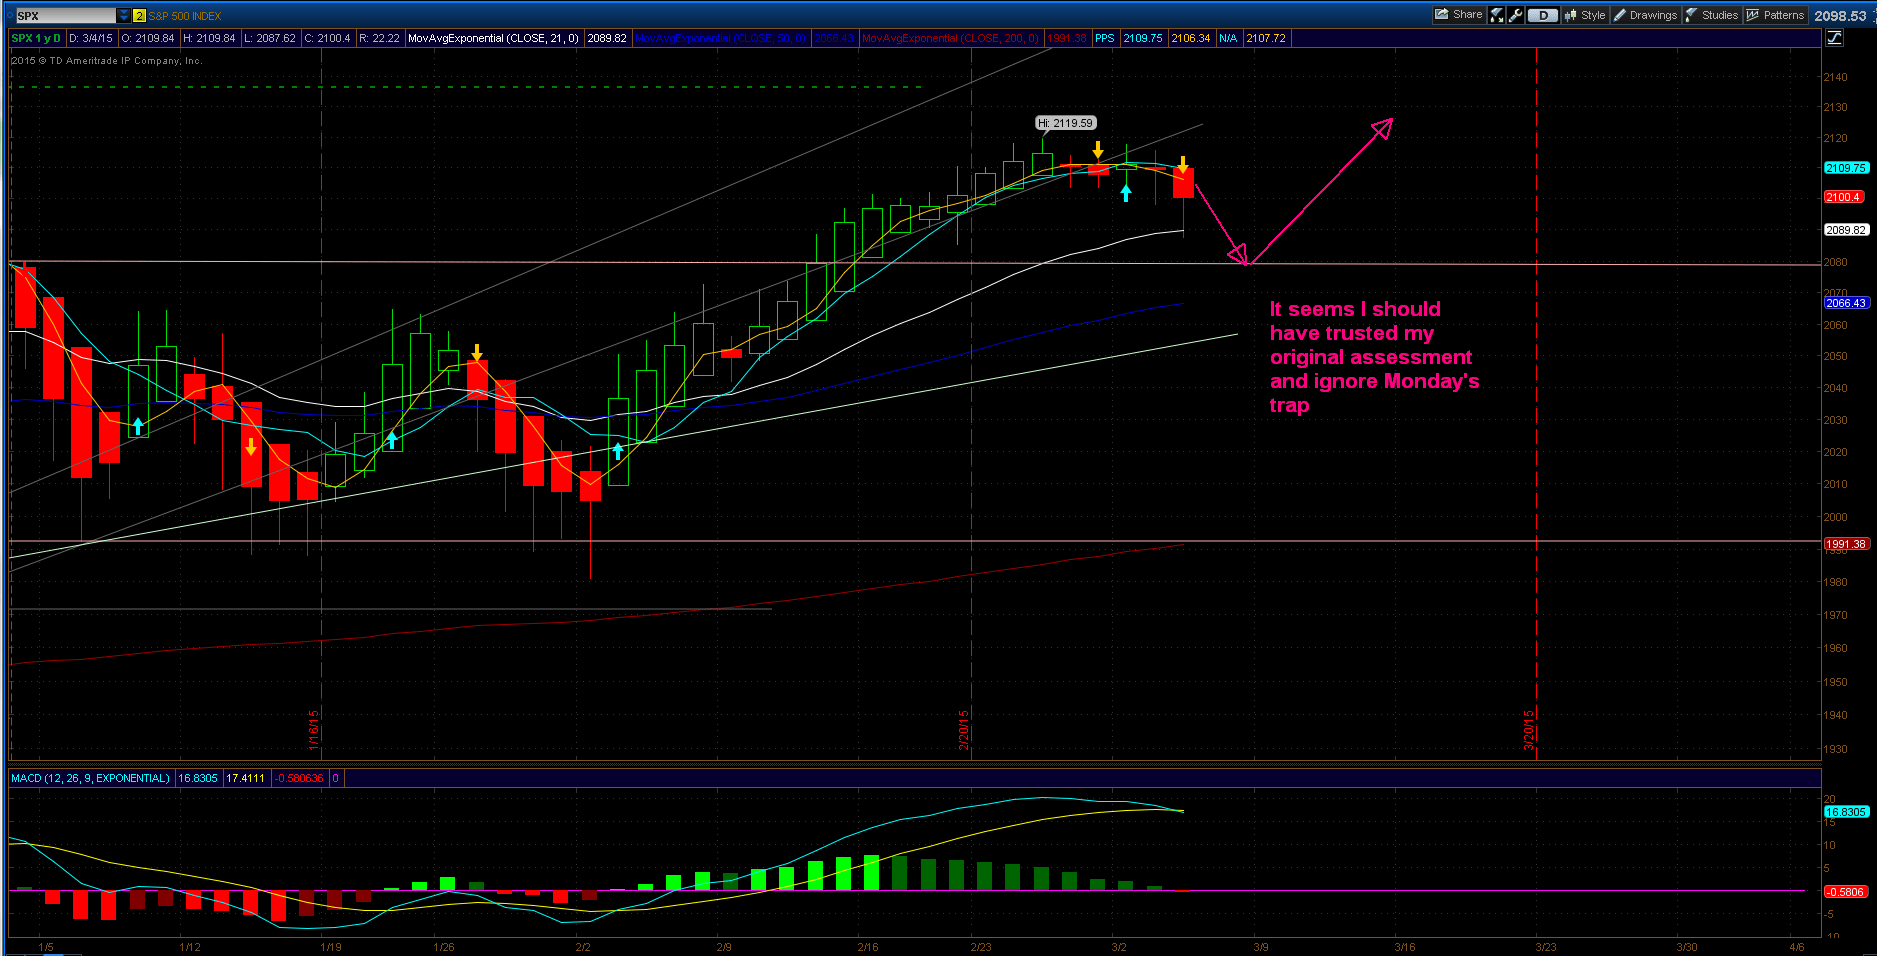
From my employment data hysteria review above I believe the selling was too violent and it created a buy opportunity although people are now scared again and expect more selling. I am bullish on this trend more than before. I expect this market to reverse and move higher.

If I am correct and the market starts rising again or even goes sideways, I can roll the trade again and lower the strikes this time to increase chances that it expires worthless.

If I am wrong (remember, I do not try to predict the market, only assess all possible options) I will reverse the trade into either a bear call spread or debit bear put spread.

SPX expected move

The market stopped at 50 day moving average and a previous sideways channel resistance, now support. If this level holds, we will see the market going higher, potentially to new highs. If it doesn’t, we will see more selling.

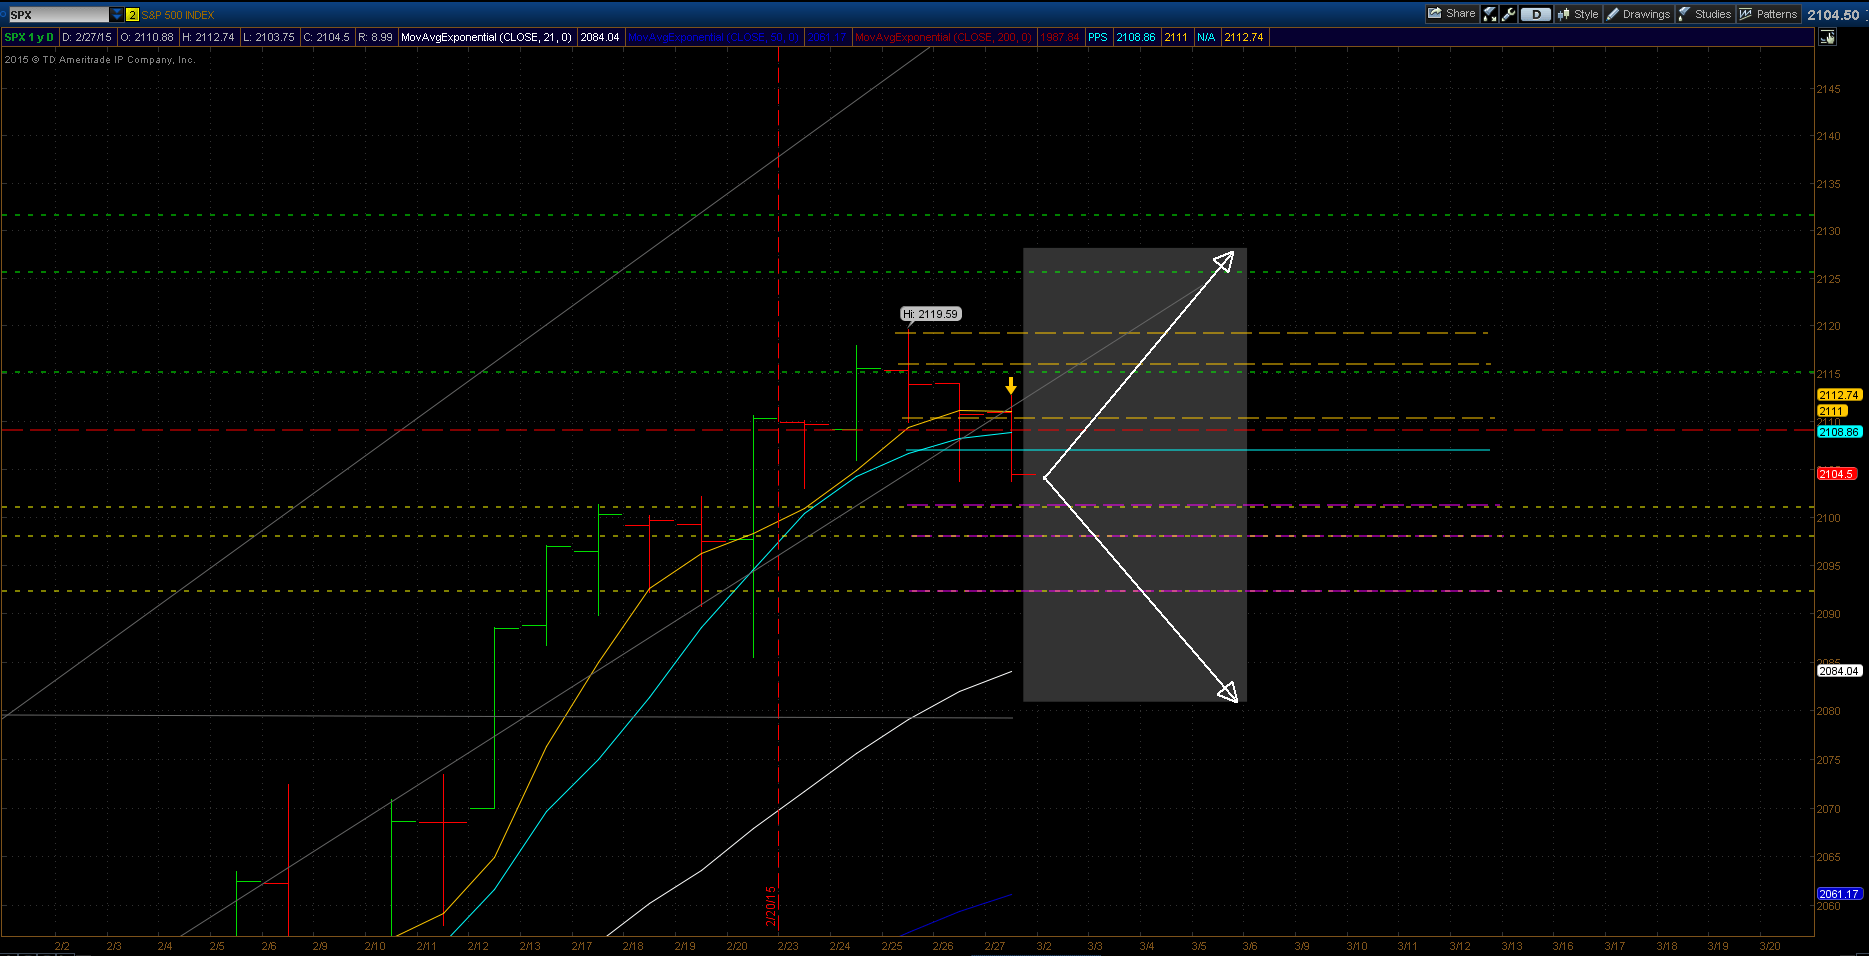
Since Friday was extremely extreme trading, I expect a bounce next week. I expect the market to bounce up to previous resistance at 2092 or even back up to 2119 level from which the market may reverse down again. The 2092 level is more likely resistance from which we may bounce down again.

SPX expected move

Above is a picture of what the market may do next week. Monday and Tuesday may set the tone for the week. If we see a bounce on Monday it may spark more selling as traders will sell the move up. Even Tuesday may see more upward pressure and yet I expect it to fail and the market may continue lower. Remember, once selling is undergo, it feeds more selling. Nevertheless, any bounce up would help our trade to roll it again or convert into a bearish trade easier.

Let’s see next week rolling.


We all want to hear your opinion on the article above:
No Comments


Posted by Martin March 05, 2015
2 Comments


SPX expected move for March 6, 2015


Tomorrow is expiration day for our SPX bull put spread. Today’s trading bought us a little padding for tomorrow, making our trade safer than what it was yesterday for example. Hopefully this relief will help us tomorrow.

The market is weak and it stayed around $2100 level the whole day today as investor are expecting employment data tomorrow. This weakness along with a few indicators pointing down I expect the market to go down again tomorrow.

There are two things which may help this market to stay where it is or move it higher – employment data and a fact that we are at the mean market value (21 day MA and middle level of the Bollinger band. This is typically an important support (or resistance) and markets tend to bounce from this level to move back up higher. However, the employment data may change everything tomorrow.

With the weakness and a few positive technical indicators my expectation for tomorrow is mixed with downward pressure. The worst case scenario I see here is that the market may go all the way down to 2086 – 2088 level where it should stop (unless the employment report is so bad that it would shoot down though those levels without any stop or brake.

Let’s see if sellers take the control tomorrow or we will see yet another bumpy day with a bunch of ups and downs but without jeopardizing our trade.

And here is a visual look at my expectations:

SPX expected move

The light grey box indicates my expected range of move where I expect SPX to stay. The dashed magenta lines indicate three downside levels. The first two higher levels are statistically more common levels, the third lower one is an extreme for the day, so I do not expect that level to be breached. And even if so, it is still above our trade and we should be safe though.

The market is also hovering around 2092 – 2093 level which is a strong support from previous high (reached on December 29, 2014) which may stop the market from further falling.

We will be watching this market carefully tomorrow to see if we need to roll the trade or let it expire worthless for a full profit.


We all want to hear your opinion on the article above:
2 Comments


Posted by Martin March 04, 2015
No Comments


SPX expected move for March 5, 2015


The market outlook doesn’t look good for our bull put spread against SPX. If the selling continues tomorrow with the same magnitude, our strikes will be breached and we will have to roll the trade away in time to give this market more time to consolidate.

On Tuesday, there was no reason for selling at all; today, the economic news were also silent giving no catalyst for selling. Were investors taking gains after a nice and long move up? Looks like.

The fight between bulls and bears continued today as well. In the morning a huge sell off took place when market dropped 17 points. That is a significant drop already. But then bears lost control and bulls pushed the market back up. At some point it looked like we would recover all losses and end the session in green.

It didn’t happen.

SPX daily

Later afternoon even bulls lost steam and trading went almost sideways.

Today’s trading changed the bullish outlook back to bearish for the week and it looks like I should have stayed with my original assessment of what the market would do this week and as I posted this in my post “Will S&P 500 go up or down next week?”.

With the retrospective it is now obvious that Monday’s trading was a trap.

SPX yearly move

There is now only two things which may save this trade: tomorrow’s jobless claim report and employment data on Friday. It can also destroy our trade if the report is too good or too bad (you never know what those guys in Wall Street deem as good news and what’s bad news. So let’s hope that data will be good and send market up high again. Let’s hope that data will be that good that investors will see it as a good sign that our economy is improving amid “bad automakers data” we saw as a reason for selling yesterday.

So, what is my expectation? On the low side it doesn’t look well and the outlook is bad. If we see renewed selling tomorrow with the same strength our trade will be breached and we may want to roll it away:

SPX expected move

It will a tough decision to make if we see selling again. If more selling takes place in the morning and in the afternoon the markets recover, there will be no need to roll the trade. If it however falls down and stays there, it may be difficult to roll the trade whatsoever (our trade is marked with a yellow price line at 2080/2085 and the market must stay above 2085 in order to profit from our trade).

Tomorrow is somewhat important for our trade as we may build more cushion for Friday and stay profitable. So let’s see.

Happy trading!


We all want to hear your opinion on the article above:
No Comments


Posted by Martin March 03, 2015
No Comments


SPX expected move for March 4, 2015


Today, we saw SPX retreating from its all-time high level. Surprisingly, it wasn’t economic data which sparked the selling but not so good sales reported by automakers. That’s at least what media are trying to tell us.

On Monday the trading was strong and bullish enough to reverse bearish outlook and my technical indicators shot a bull signal again. But today’s trading makes it a weak bullish trend again. Will the bullish outlook stay or not? We will see tomorrow.

Below is the chart of my expected moves of SPX for tomorrow. The light colored box indicates the low and high level where the market can go. If selling continues the worst case scenario would be that we fall down to 2088 – 2090 level and then we may bounce back up again.

 
SPX expected move
 

I do not expect the market to fall lower below 2088 level tomorrow. Unless selling is reversed in coming days, it may happen that the stock market falls below our bull put spread strike and we will have to roll the trade. But that is still too early to say at this point.

Let’s see what is going to happen tomorrow.


We all want to hear your opinion on the article above:
No Comments


Posted by Martin March 01, 2015
No Comments


Will S&P 500 go up or down next week?


My quick answer to that question is “I do not know.”

But I may at least to try to set boundaries for its move next week, so my potential trade would sit outside of those boundaries and safe. So I cannot say where the market would go next week.

Let’s take a look at what may happen however.

Last week, Thursday and Friday set a new tone to the short trend of the market. Long term – we are still heading up and we will once again see a great bull trend this year. But next week story seems to show a different picture. We are most likely heading down.

 
SPX expectations
 

The chart above shows a nice move up and break through the channel resistance. Yet last two days are showing slowing down of this trend and turning down. I pictured three possible scenarios of the trend continuation. I expect the market to move down and retest 2080 support before it turns back down.

It can turn into something more dramatic and we may move even lower and retest 2055 lower channel support or 2000 support. But I do not see any catalyst for such dramatic move. This move is very unlikely.

We have a few market moving reports coming out next week. One is a personal income and expenditure report issued on Monday. If the report shows that consumers have more disposable income, this may be seen positive and move the market up.

Second, it is the ISM manufacturing index also reported on Monday. A rising ISM index would be bullish for the market and may push it higher. Last few months ISM index was declining however.

 
ISM index
(Source: Nasdaq)
 

If we still see the index declining this may help the market going down.

Lastly, on Friday a traditional employment data will be posted. These may have mixed effect on the market. Too good data may spark a fear that FED may rise interest rates, or spark an optimism about economy improving.

And what about the next week? See my expected boundaries for the week:

 
SPX expected move
 

Hopefully, the trend would stay within those boundaries. But to say for sure, we will wait for Monday trading to see which direction the market wants to go.

Good luck for the next week trading.


We all want to hear your opinion on the article above:
No Comments


Stocks to buy in March 2015


February finished fast and it is time to choose new stocks to buy for the next month. If you purchased my stocks at the beginning of February, your portfolio would be 4.58% up today.

It could have been better but the stocks, mainly the energy stocks, fell down during the second half of the month. You can review my February selection in this post.

In the middle of February I created a portfolio out of my stocks selection in Motif Investing and called it “Undervalued Stocks”. Unfortunately I created the motif when stocks were high, so the motif is now losing.

Today, I rebalanced the Undervalued Stocks motif removing stocks which no longer meet the criteria, added new stocks, and rebalanced portfolio allocation to equal weight.

The removed stocks should bring in 3.15% gain if they sell on Monday for today’s prices or better.

And here is a new selection for March which will be also used in the motif:


As oil rebounds this year (and it will) many of these stocks will have a great time.

You can buy this motif if you want if you open an account with Motif Investing. Then you can buy the entire portfolio the same way as a mutual fund – you buy all positions at once with minimum $250 investment. You will be buying fractional shares if you do not have large amount of money.


Thus this is a great investment for small investors

I purchased this motif myself to show confidents in my stock selection. You can open your account too and if you start investing, you will receive a $150 bonus from Motif Investing.

I will be rebalancing this motif every month. Let’s see, how well this portfolio will do at the end of the year.

Good luck to all of you!
 

Previous selection:

Stocks to buy in January 2015
Stocks to buy in February 2015
Stocks to buy in April 2015
Stocks to buy in May 2015
Stocks to buy in June 2015


We all want to hear your opinion on the article above:
2 Comments


Posted by Martin February 27, 2015
No Comments


Bull Put Spread against SPX expired for 6.38% profit


Although yesterday the trading looked dramatic, no actual drama has happened today and our SPX bull put spread we put out on Wednesday with strikes at 2080/2085 expired worthless for a full profit of a received credit (our subscribers and I realized 6.38% profit this week). If we will be able to maintain such profit every week, our trading might end at more than 300% profit for the year.

Let’s see if that happens.

Below is the summary chart of my SPX weekly expectations – at the beginning of the week up to yesterday’s and today’s trading. I was wrong on volatility but was right on the max high level of the market calling it $2118 while we hit $2119 mark.

SPX predictions

Volatility dried last week making this an easy trade. Let’s see what we can expect next week. There is one thing for sure – the trend weakened significantly and from the short term perspective we are looking at possible reversal and retest of $2100 price level next week.

We will see on Monday and Tuesday next week. We may open a new trade either on Tuesday or Wednesday next week.


We all want to hear your opinion on the article above:
No Comments


Posted by Martin February 26, 2015
No Comments


SPX expected move for February 27, 2015


Once again investors in Wall Street freaked out about oil and continued selling energy stocks. That would affect our put spread positions in OXY, LGCY, and EVS, which sold hard today. But these trades are a long term trades and thus today’s sell off is not a concern to me. They can freak out as much as they want in Wall Street about oil. I know, oil will not stay this low forever and well established companies such as those mentioned above will go up again.

And it can happen even next month.

What I do care about is my weekly position in SPX. We have a bull put spread open and that trade is set to expire tomorrow. In order to profit from this trade, the market must stay above 2085 by the end of tomorrow’s trading session.

From current levels, the market would have to drop by 25 points. Is this realistic? I believe it is not given the current volatility level.

The only catalyst which may move the market significantly down is tomorrow GDP reporting.

There can be two scenarios with the GDP:
 

  • the results will be good and markets will cheer it up
  • the results will be good, but the market sells off due to a fear that good results may prompt FED to raise rates earlier (although Yellen assured everybody on Wednesday that this wouldn’t happen)
  • the results will be bad and the market sells off due to renewed economic worries
  • the results will be bad and the market goes up because that will hold FED from raising interest rates

So, as you can see, no one knows what would be the outcome, only crazy investors and traders at Wall Street will know and tell us via a price action of the SPX.
 

So here is my view where the market may end up tomorrow (of course, this is not a 100% guarantee that it really happens, but statistically more probable).

SPX expected move

How to read this chart:
 
– The grey box indicates the boundaries where I expect the market to stay next day
– The horizontal magenta long-dashed lines are bearish levels, the second lower line would be a normal max low level, the third lower level is considered as extreme move
– The horizontal yellow long-dashed lines are bullish levels, the second higher line indicates a normal move, the third upper line an extreme move.
– The cyan line is the mean level, where the market would tend to return from extremes
– The long-dashed red line is the same mean level as the cyan one, but for the entire week, while cyan line is for the next day only
– The short-dashed yellow and green lines are the same levels as the long-dashed, but for the entire week, while long-dashed are for the next day
– The lines with a price tag indicates an open trade, the solid line is the critical position. The trade must stay above or below this line (depending on the trade)
– The dashed line with a price tag is a protective option


We all want to hear your opinion on the article above:
No Comments


Posted by Martin February 25, 2015
No Comments


SPX expected move for February 26, 2015


I would like to start posting this series of my market expectations, but at this point, I am not sure how consistent I will be able to be in publishing this series.

My intent to publish the charts below is to show where the market may go during the day in relation to my weekly options I trade against SPX. It sets the boundaries for the day and not the direction. It may go up or it may go down. The goal is to determine how safe my trade would be until expiration.

For example, now we have a trade out there – a bull put spread 2080/2085 against SPX. With my expected move for tomorrow, this trade should be safe. Of course it may change, we may see some ultra bad news, or investors freaking out for no particular reasons and all bets will be off. The market may move lower than my expectations. But that would be a statistical extreme if that happens. So there would have to be a real strong catalyst to move the market beyond those boundaries. See the chart below:

SPX expected move


How to read this chart:
 
– the grey box indicates the boundaries where I expect the market to stay next day
– the horizontal magenta long-dashed lines are bearish levels, the second lower line would be a normal max. low level, the thrid lower level is considered as extreme move
– the horizontal yellow long-dashed lines are bullish levels, the second higher line indicates a normal move, the third upper line an extreme move.
– the cyan line is the mean level, where the market would tend to return from extremes
– the long-dashed red line is the same mean level as the cyan one, but for the entire week, while cyan line is for the next day only
– the short-dashed yellow and green lines are the same levels as the long-dashed, but for the entire week, while long-dashed are for the next day
– the lines with a price tag indicates an open trade, the solid line is the critical position. The trade must stay above or below this line (depending on the trade)
– the dashed line with a price tag is a protective option


I will try to be publishing this trade on a daily basis from Wednesday to Friday during the week when we will have a weekly options trade open against SPX. If there will be no trade open during a particular week, I will not be publishing this chart.


We all want to hear your opinion on the article above:
No Comments


Posted by Martin February 23, 2015
6 Comments


Bloggers and my blogroll


Over time I made a few friends recruited from dividend and options trading bloggers. Some had great blogs and I could learn a lot from them.

I could learn not only about investing, but also about blogging. It was a great community. But recently I noticed many of those great blogs were dormant. Some said good bye, some just stopped without a single word.

I understand that blogging may be time consuming work. Nevertheless I am sorry to see these bloggers go.

This has an impact to my blog too.

I decided to stop linking to the inactive blogs and remove them from my blogroll. That means I will remove any blog from my blogroll, which is silent for more than 6 months.

inactive bloggers

Super 8 Film to DVD
Advertising


We all want to hear your opinion on the article above:
6 Comments


This site has been fine-tuned by 14 WordPress Tweaks