The new year 2022 hasn’t started very well as the FED released its meeting minutes that spooked the markets rushing away from tech stocks. As I will present in this investing and trading report our account lost 5% in the first week of the new year while the market lost only about 1.8%. But I am optimistic and once the market calms down, the account will be going up again. Why? Because although the account lost net-liq value, we still made over $3k in options trading and great dividend income! The value is depressed because of the violent panic in the market.
Here is our investing and trading report:
| Account Value: |
$98,730.94 |
-$5,913.70 |
-5.65% |
| Options trading results |
| Options Premiums Received: |
$3,856.00 |
|
|
| 01 January 2022 Options: |
$3,856.00 |
+3.91% |
|
| Options Premiums YTD: |
$3,856.00 |
+3.91% |
|
| Dividend income results |
| Dividends Received: |
$136.25 |
|
|
| 01 January 2022 Dividends: |
$136.25 |
|
|
| Dividends YTD: |
$136.25 |
|
|
| Portfolio metrics |
| Portfolio Yield: |
4.63% |
|
|
| Portfolio Dividend Growth: |
8.80% |
|
|
| Ann. Div Income & YOC in 10 yrs: |
$24,305.74 |
20.09% |
|
| Ann. Div Income & YOC in 20 yrs: |
$252,342.20 |
208.58% |
|
| Ann. Div Income & YOC in 25 yrs: |
$1,417,526.31 |
1171.71% |
|
| Ann. Div Income & YOC in 30 yrs: |
$14,049,264.41 |
11,612.94% |
|
| Portfolio Alpha: |
-2.59% |
|
|
| Portfolio Weighted Beta: |
0.61 |
|
|
| CAGR: |
548.29% |
|
|
| AROC: |
3.91% |
|
|
| TROC: |
14.70% |
|
|
| Our 2022 Goal |
| 2022 Dividend Goal: |
$4,800.00 |
2.84% |
In Progress |
| 2022 Portfolio Value Goal: |
$151,638.03 |
65.11% |
In Progress |
| 6-year Portfolio Value Goal: |
$175,000.00 |
56.42% |
In Progress |
| 10-year Portfolio Value Goal: |
$1,000,000.00 |
9.87% |
In Progress |
Dividend Investing and Trading Report
Last week we have received $136.25 in dividends bringing January’s dividend income to $136.25.
We bought 20 shares of RYLD.
Here you can see our dividend income per stock holding:

Growth stocks Investing and Trading Report
Last week we didn’t buy any new positions in growth stocks.
Options Investing and Trading Report
Last week we rolled many strangle trades to keep our account safe. Each time the stock moved up or down towards one or the other strike price, it consumed our buying power. Rolling the trade to the center of our strangle, we brought in credit and released buying power.
These adjustments delivered our January income by $3,856.00 bringing January total to $3,856.00.
We were actively trading our SPX strategy that delivered $455.00 weekly income.
You can watch all our trades in this spreadsheet. You can watch the spreadsheet and look for a “NEW” indication next to the trading date. When the indicator shows up, it is typically good for up to 3 days to follow that trade.
Expected Future Dividend Income
We have received $136.25 in dividends last week. Our portfolio currently yields 4.63% at $98,730.94 market value.
Our projected annual dividend income in 10 years is $24,305.74 but that projection is if we do absolutely nothing and let our positions grow on their own without adding new positions or reinvesting the dividends.
We are also set to receive a $4,838.36 annual dividend income. We are 19.91% of our 10 year goal of $24,305.74 dividend income.

The chart above shows how our future dividend income is based on the future yield on cost and what dividend income we may expect in the future. The expected dividend growth depends on what stocks we are adding to our portfolio and the stocks’ 3 years average dividend growth rate. It is interesting to see what passive income we may enjoy 10, 20, 25, or 30 years from now.
Market value of our holdings
Our non-adjusted stock holdings market value decreased from $133,469.78 to $131,541.85 last week.
In 2022 we plan on accumulating dividend stocks, monetizing these positions, HFEA strategy, and SPX trading. We plan on raising more of our holdings to 100 shares so we can start selling covered calls. However, in the first week of January 2022, we couldn’t buy any new shares as the buying power was very volatile and we are raising cash (by letting old trades expire and not reopening them, or closing trades that are almost at a full profit but a long time to expiration – for example, trade has only five cents left but 30 or 40 days to expiration. It makes no sense to wait for $5 for another 30 to 40 days. So, we closed such trades).

Our goal is to accumulate 100 shares of dividend growth stocks we liked and then start selling covered calls or strangles around those positions. We also planed on reinvesting all dividends back to those holdings.
Investing and trading ROI
Our options trading delivered a 3.91% monthly ROI in January 2022, totaling a 3.91% ROI YTD. We hope that in 2022 we exceed our 45% annual revenue selling options against dividend stocks target!
Our entire account is down -5.65% underperforming our projections and the market.
Our options trading averaged $3,856.00 per month this year. If this trend continues, we are on track to make $46,272.00 trading options in 2022. As of today, we have made $3,856.00 trading options.
Old SPX trades repair
This week, we didn’t adjust our old SPX trades. Our goal is to reach a level where we will be eligible for portfolio margin (PM). Once that happens, we plan on converting the existing SPX Iron Condors to strangles and trade these positions as strangles.
With RegT margin, the capital requirements would be approx. $66,586.06 and that is beyond our means. With PM the requirement for margin would drop to around $10k. That is doable in our account. Once we reach this level, we will start adjusting our SPX trades accordingly. Until then, we will just roll these trades around.
We however traded our SPX put credit spread strategy which you will be able to review in my next report.
Market Outlook
The stock market struggled to break through the $4,800 resistance. It broke above it for a little while but then FED sparked a selloff and the entire market dropped below $4,720 support. However, it seems the selloff is exhausted and we may see some recovery. It is, however, too early to say. Next week can be a good indicator the where the market will go. In the short term, the market is negative and poised for a downturn. In a long term, we are still bullish. I still expect the market to reach $5,000 mark in the next month or two.
If you want to learn more about the stock market, events that moved the market last week and will likely impact it in the near future, I recommend you to subscribe to our weekly newsletter. Knowing where the market is heading and knowing when you should expect its reversal can benefit your trading and investing. Subscribe and you get one month free.
Investing and trading report in charts
Account Net-Liq

Account Stocks holding

Last week, S&P 500 grew 61.68% since we opened our portfolio while our portfolio grew 28.24%. On YTD basis, the S&P 500 fell -3.08% and our portfolio -1.53%.
The numbers above apply to our stock holdings only. Our overall account net-liq dropped by -5.65% this year.
Stock holdings Growth YTD

I expect our stock holdings to start outperforming the market hopefully soon.
Our 10-year goal is to grow this account to $1,000,000.00 value in ten years. We are in year two and we accomplished 9.87% of that goal.
Our 6-year goal is to reach $175,000 account value to be eligible for portfolio margin (PM) and today we accomplished 56.42% of that goal.
Our 2022 year goal is to grow this account to a $151,638.03. and today we accomplished 65.11% of this goal.
Investing and Trading Report – Options Monthly Income

Investing and Trading Report – Options Annual Income

Our dividend goal and future dividends

We planned to make $4,800.00 in dividend income in 2022. As of today, we received $136.25. We accumulated enough shares to start making $4,838.36 a year.

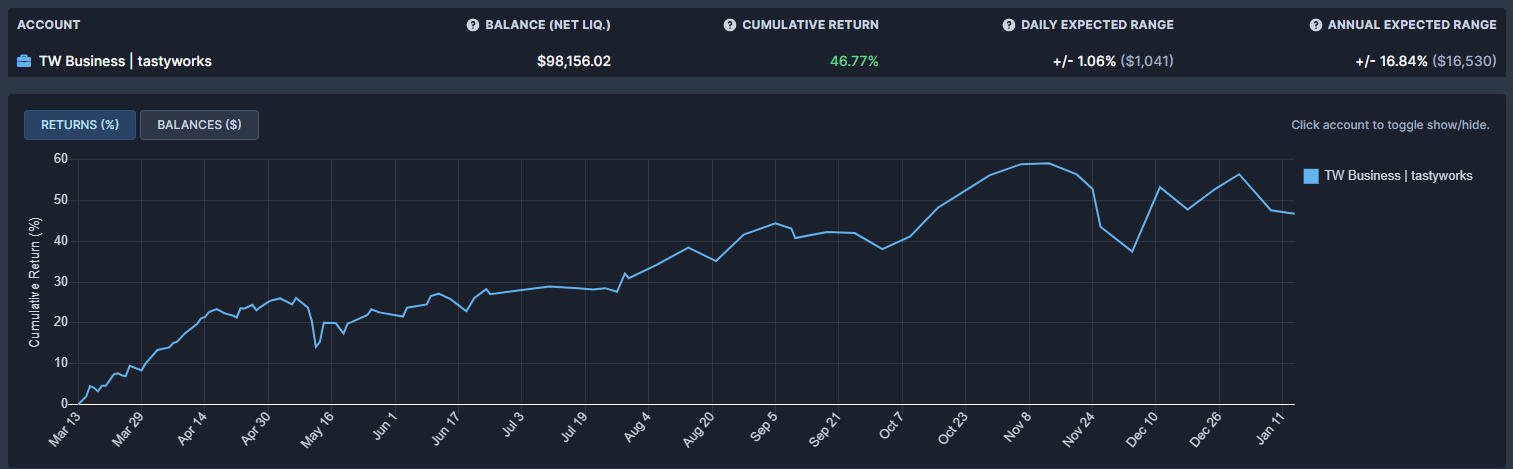
Our account cumulative return
The chart below indicates our cumulative adjusted return.
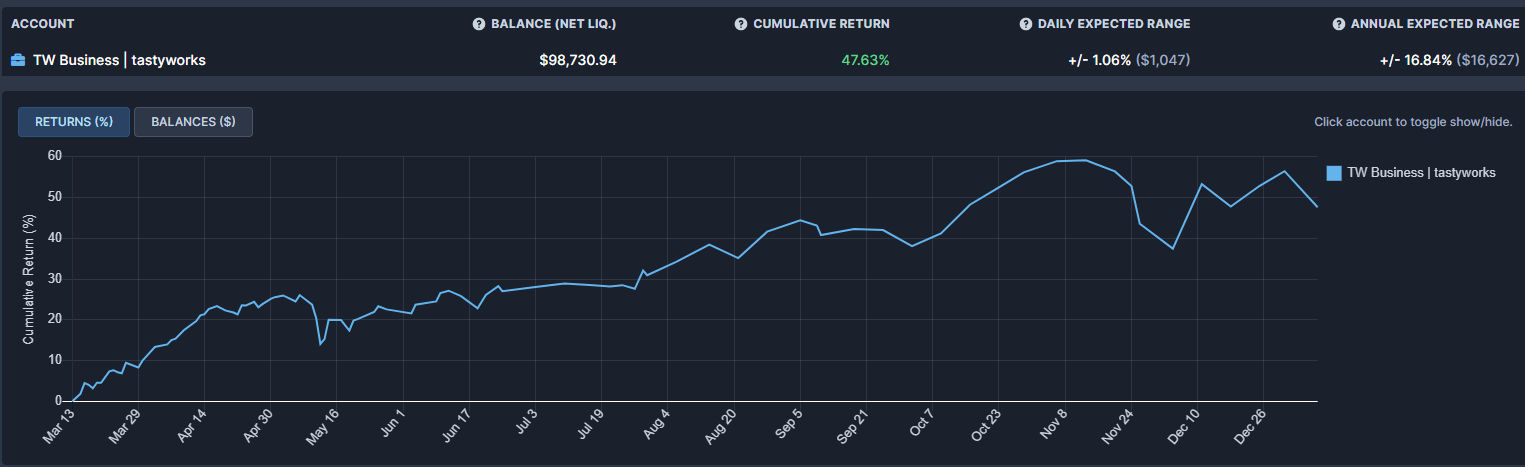

As of today, our account cumulative return is 47.63% (note, data in this section are since March 13, 2021, only as that is the date we started tracking these metrics. Thus the results are skewed a bit and will show full picture next year.).
I have a favor to ask. If you like this report, please, hit the like  button so I know that there is enough audience that like this content. Also if there is something you want to know or you want me to change this report to a different format, let me know in the comments section.
We all want to hear your opinion on the article above:
No Comments |


Recent Comments