|
|
Last week, the markets were turbulent. Investors are still freaking out about interest rates. To me, that is an old issue. It is a non-issue. Why worry about something that has no impact on the US economy?
|
|
The current interest rates are around 5%, and the US economy is still strong. The labor market and housing are strong, and companies are posting increasing earnings. This means the FED has no reason to cut the rates, although Powell said otherwise. But if the economy is doing well under the current conditions, why cut out the rates, and why freaking about it? It is evident that corporate America is used to the zero interest rates policy (ZERP) and is unwilling to give up. Or suffers from delirium tremens.
|
|
Market sentiment
There seem to be two big sources of angst and tension in the market right now. #1, as usual, revolves around the FED. Not a day goes by when we don’t hear the market pundits debating about when the rate cuts will begin. Will it be June, August, or November, or will there be any rate cuts in 2024? It can drive you mad if you don’t learn to tune it out.
|
This past week, we saw what happens when a member of the FED mentions the possibility of no rate cuts at all. Neil Kashkari likes to be controversial and make statements that are usually outside of the consensus of the rest. He did it once again on Thursday. The market was moving along fine that day until just after 2 pm EST. Then, all of a sudden, it was as if an earthquake hit the market. The DJIA went from being up 100 to down over 500 points!
|
What caused such a sudden reversal? The main reason was Kashkari’s statement that there may not be any rate cuts at all this year. His speech started at 2 p.m. EST. I would think by now that the market would learn not to take Kashkari too seriously, but he did it again, and the market participants freaking out about him are simply idiots.
|
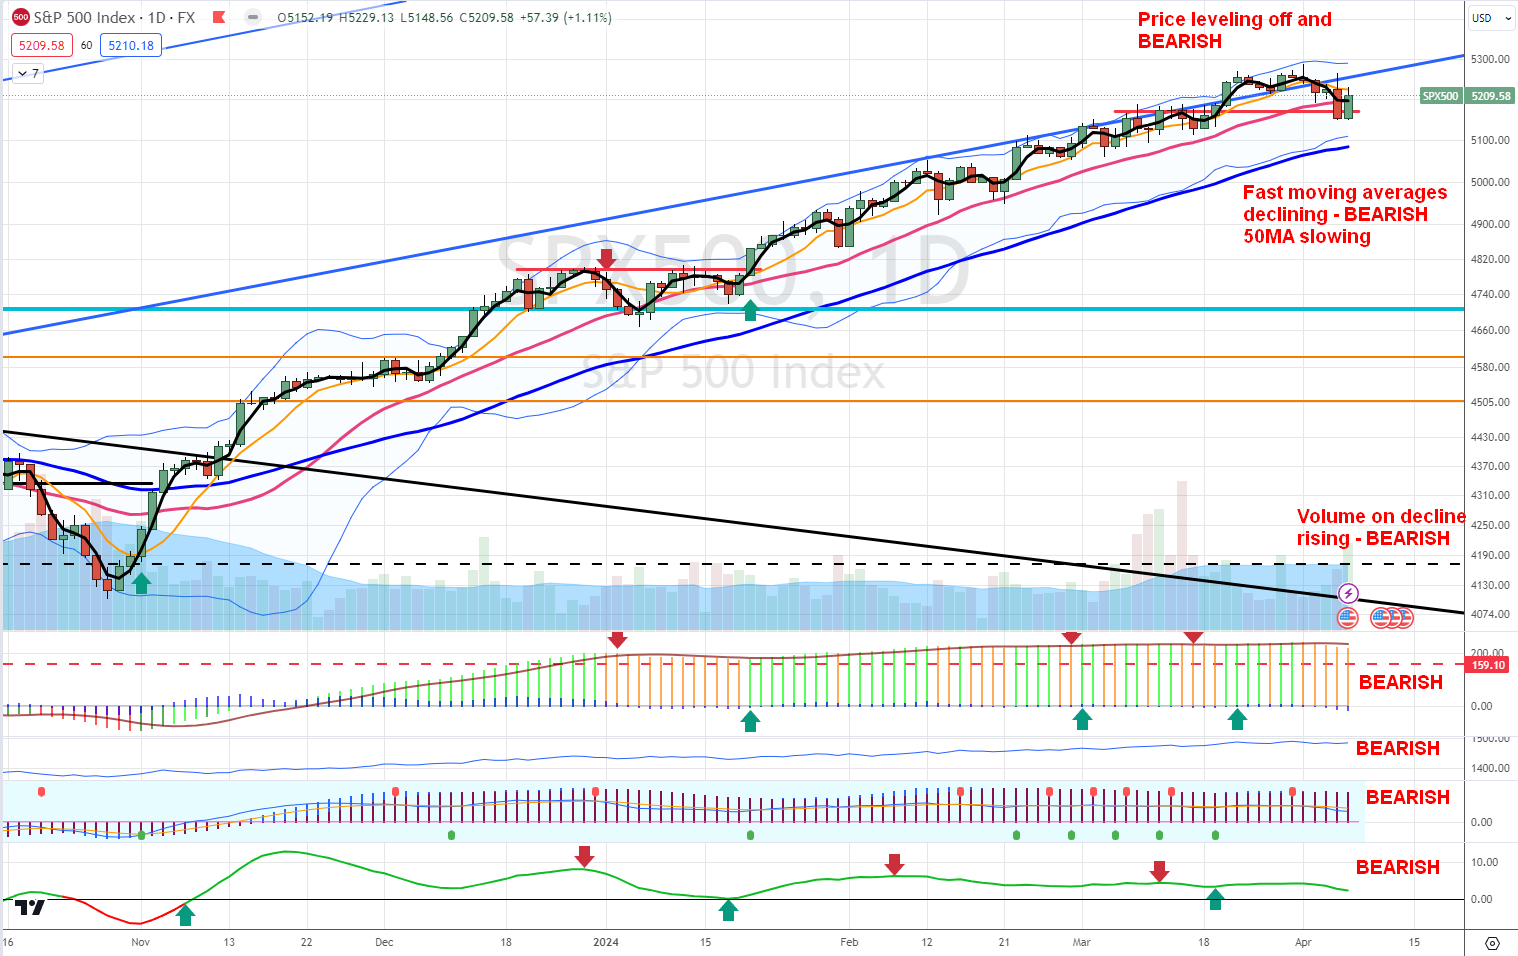
The S&P 500 is still in an uptrend, but it could be leveling off. We saw a large drop in volatility followed by an even larger spike, and the market is still extremely overbought. So, it is due for a correction.
|
|
It looked like it was stalling out three weeks ago, and then Jerome Powell juiced it again with his outlook for three rate cuts this year. The market has a support level of 5,083. The forward PE ratio of this index is now at 20.73x. Its five-year average is 19.0x, and its ten-year average is 17.7x. It got as high as 23x in early 2021 when rates were near zero. The S&P 500 would have to pull back to 4,560 to bring the forward PE ratio back to 19.0x. That would be a 12.4% drop from its current level. The golden cross in February of last year is still in place.
|
|
|
The chart turned bearish last week. The trend is still intact, but all indicators are flashing a bearish mood. Will it prevail, and will we see more selling? It is hard to say, but given the rising volatility, it is quite possible. So, watch the next week and be ready for more messy trading.
|
Two factors may reverse it: a dip in buyers and earnings. Dip buyers are usually buying dips and are wrong about spotting trend reversals. So they may be buying, but the market may be stronger than them and keep selling. So, the question will be, who is stronger this time?
|
Earnings reports are starting next week, and it is difficult to say how the market will react to them. We may still be in the "good news is bad news" mood, and if earnings come back great, the market may perceive it as bad news because the FED may not be so fast cutting the rates.
|
Market Score
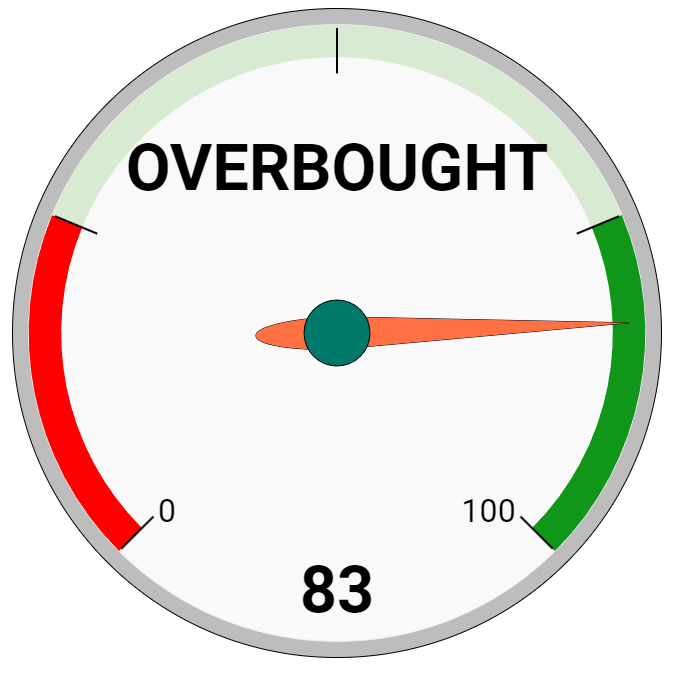
The market has a score of 83.
|
What does this mean? I am (trying to be) a contrarian. When everyone is in FOMO YOLOing all their money in high-flying stocks like crazy, I am staying cautious and on the sidelines. I trade options but I am cautious and prepared to exit as soon as the conditions change. This score means that the market is OVERBOUGHT, and the odds of a correction are high. However, the indicator I created should not be used alone. I use it in conjunction with my volatility score to determine whether it is still safe to trade or get out.
|
Since the market is extremely overbought, I am not buying stocks (unless I find a stock that is extremely undervalued), but I am saving cash.
|
I save all proceeds (options premiums and dividends) to cash vehicles in this manner:
|
- Dividends > save to SGOV fund.
- Options premiums > save to ICSH fund.
|
|
Volatility Metrics
|
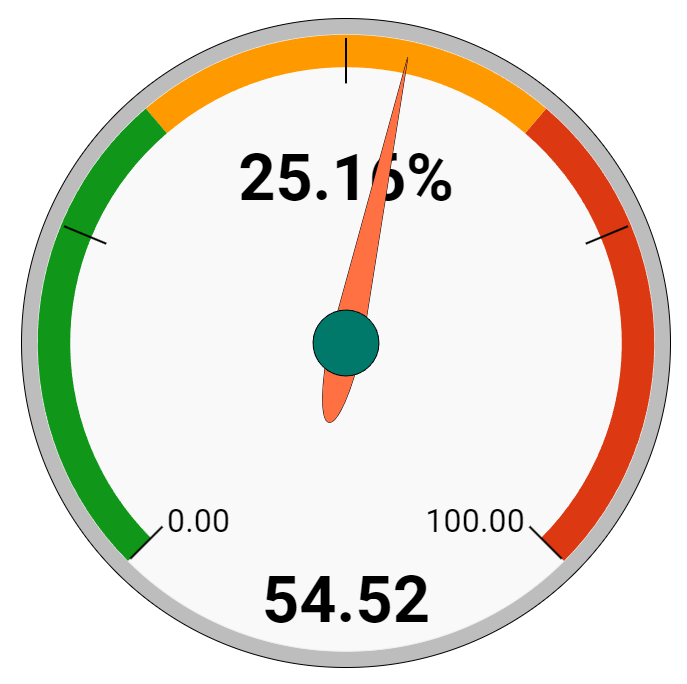
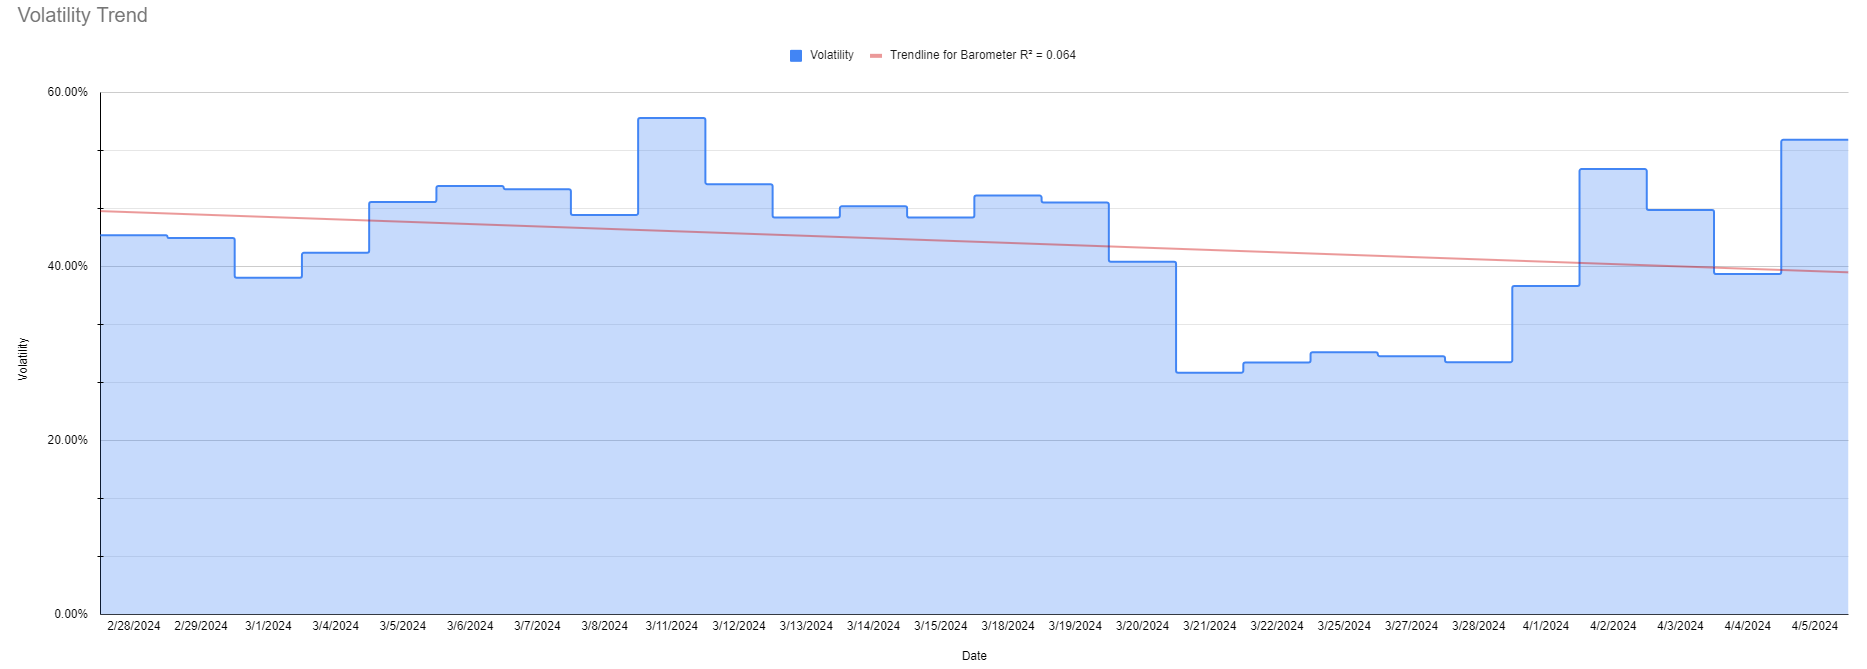
The volatility spiked hard last week. We saw a 39.4% spike in a day last week. The new score is 54.52%. If this trend continues next week, we will be reversing some of our positions to more bearish/defensive ones. Given the market being overbought, we are also suspending options trading. Not completely yet, but we will not be replacing expired trades and stay in cash until this condition is resolved. It may happen as early as Monday next week, or it may take the whole week to go nowhere.
|
|
|
|
This indicates that volatility is still declining overall, but the trend is leveling and possibly reversing. The market participants are no longer complacent but worried. More of them may be buying protective puts or selling out of their bullish positions. The market trend could start stalling and reversing.
|
There are the following potential scenarios:
|
|
1) Volatility starts rising, the score rises, and the market rallies.
|
This will be the most dangerous scenario. It will indicate that the correction is imminent. In this market, we will save cash (parking it into ICSH and SGOV), not buy new stock positions, and keep trading options, but we will not be scaling up our trading.
|
|
2) Volatility increases above 55%, the score still rises, and the market still rallies
|
This indicates that it is time to go bearish and defensive. Let others keep propping the market, but we will reverse our trades into neutral to bearish trades. We will add protective positions. Our options trades will be placed as far away from the market as possible, and we will trade Iron Condors.
|
|
3) Volatility keeps increasing above 55%; the score starts dropping, and the markets stall, reverse, or drop.
|
This will be the time to go full defensive and bearish. We will likely release cash (selling ICSH and SGOV funds to increase cash) to prevent margin calls. Our options trading will be fully bearish (selling calls or call spreads), and we will buy 2x or 3x leveraged bearish ETFs (sell SSO, SPXL, and buy VIXM, XLU, or stay in cash. We will buy protective puts, trade collars, or deep ITM-covered calls to protect our dividend stocks.
|
|
4) Volatility crashes, score crashes, and the market crashes.
|
This will be the time to go aggressively bullish again. We will liquidate all bearish trades and rotate them into bullish ones, such as buying SPXL and SSO and adding stocks to our portfolio again. Our options trades will be bullish again (selling puts, selling put spreads, or trading Iron Condors).
|
Today, we are in scenario #2 - 3 (close to scenario #3). We keep holding SPXL, SSO, and QLD funds in our portfolio but not adding new shares. If the market keeps deteriorating next week, we may start selling bullish positions and add neutral to bearish ones such as IYR, XLU, or cash equivalents such as SGOV. Our option trades are now neutral. We are not scaling options trading and replacing old trades; we are just managing the old ones. We are also not buying new stock positions. Instead, we are saving cash in ICSH and SGOV.
|
Market Outlook
The next earnings season begins next week. For Q1 2024, the estimated (year-over-year) earnings growth rate for the S&P 500 is 3.2%. If this is the actual growth rate for the quarter, it will mark the third straight quarter of year-over-year earnings growth for the index.
|
The S&P 500's estimate for Q1 is now $54.85 per share, down from $55.25 five weeks ago, but up from $53.33 per share one year ago. The current revenue growth estimate is 3.5%.
|
The S&P 500 forward PE ratio went down to 20.73x last week. This is still well ABOVE the upper band of forward PE ratios. We got as low as 15.5x back in October of 2022 and we started the year 2023 at 17.0x. This forward PE ratio has dropped from 23.5x since the beginning of 2022. The five-year average is 19.0x. The ten-year average is 17.7x. The net profit margin for the quarter is expected to be 11.5%.
|
|
The trailing 12-month P/E ratio is 22.93x, which is above the 5-year average of 22.4x and above the 10-year average of 20.9x.
|
For Q1 2024, analysts are projecting earnings growth of 3.2% and revenue growth of 3.5%.
|
|
For Q2 2024, analysts are projecting earnings growth of 9.4% and revenue growth of 4.7%.
|
|
For Q3 2024, analysts are projecting earnings growth of 8.5% and revenue growth of 5.2%.
|
For Q4 2024, analysts are projecting earnings growth of 17.6% and revenue growth of 5.8%.
|
For all of 2024, analysts are projecting earnings growth of 10.9% and revenue growth of 5.1%.
|
For all of 2025, analysts are projecting earnings growth of 11.6% and revenue growth of 5.9%.
|
The market is now homing in on the 2024 and 2025 estimates. The consensus analyst’s 12-month target price for the S&P 500 is 5,572. Everything slides ahead one quarter now that we are beginning a new quarter. The consensus analyst earnings estimate for the next four quarters is now $252. I am keeping my multiple at 19.0x for now.
|
(2024) $252 X 19.0 = 4,788 S&P 500 Target Price
My current 3-6 month target price for the S&P 500 is 4,788. This gives the S&P 500 an upside potential of -7.99%, which shows how overvalued the overall market is now. We need to see a pullback of ~8%, more multiple expansion, or material earnings expectations increases (unlikely) for a higher upside potential. However, I am still finding individual stocks that have 80-100% upside potential over the next 3-5 years.
|
(2025) $288 X 19.0 = 5,572 S&P 500 Target Price
The consensus estimate for the next four quarters is $288.00. I am keeping my multiple at 19x this week. My current 6-12 month target Price for the S&P 500 is 5,572. This represents a +7.07% upside potential, which is below average.
|
|
|
|
|
Disclaimer: All information, analysis, and articles in this email are provided for educational purposes only. Nothing herein should be interpreted as personalized investment advice, as I do not recommend buying, selling, or holding any securities or positions. This email is available "as is" without warranty or guarantees of its accuracy, completeness, or currentness. You do so at your own risk if you rely on this email or any information. I do not hold myself out as a financial advisor, and nothing herein is a solicitation for any fund or securities mentioned. Although I may answer general questions about the information, I'm not licensed and registered under security laws to address your personal investment situation. Past performance is not indicative of future returns. Any financial decisions are the sole responsibility of you, the individual.
|
|
|
|
|
|
|
|
|

