|
|
|
Three weeks have passed, and we are seeing an enormous market volatility jump. No matter what excuse we find about the markets, a correction is due. The markets rallied relentlessly, and many investors, mainly the retail ones, felt invincible again. As much as I hate it, it is time to protect your portfolio and rotate to safety.
|
|
Market sentiment
Economic factors, earnings, and interest rates traditionally drive market trends, but the influence of domestic and international politics cannot be overlooked, especially given current events.
|
On October 7th last year, news broke of a significant escalation in Gaza, with Hamas launching an incursion into Southern Israel. This tragic event, witnessing a rising death toll, promised to shape global affairs for the foreseeable future. Now, seven months later, the situation remains dire and appears to be worsening. Israel will likely intensify its military response against Hamas and potentially Hezbollah in Southern Lebanon. Behind these groups, Iran acts as a significant proxy, supported indirectly by Russia and China in their broader geopolitical contest with the United States.
|
Market reactions have been telling, with gold hitting record highs and oil prices surging—up over 28% since last December, which has also pushed up gas prices, contributing to persistent inflation. Recently reported at an unexpectedly high annual rate of 3.5%, this inflation is affecting market dynamics, evidenced by a 422-point drop in the DJIA on the day the CPI was announced. Despite a temporary market rally following lighter-than-expected PPI figures, geopolitical tensions continue to escalate, leading to further market volatility.
|
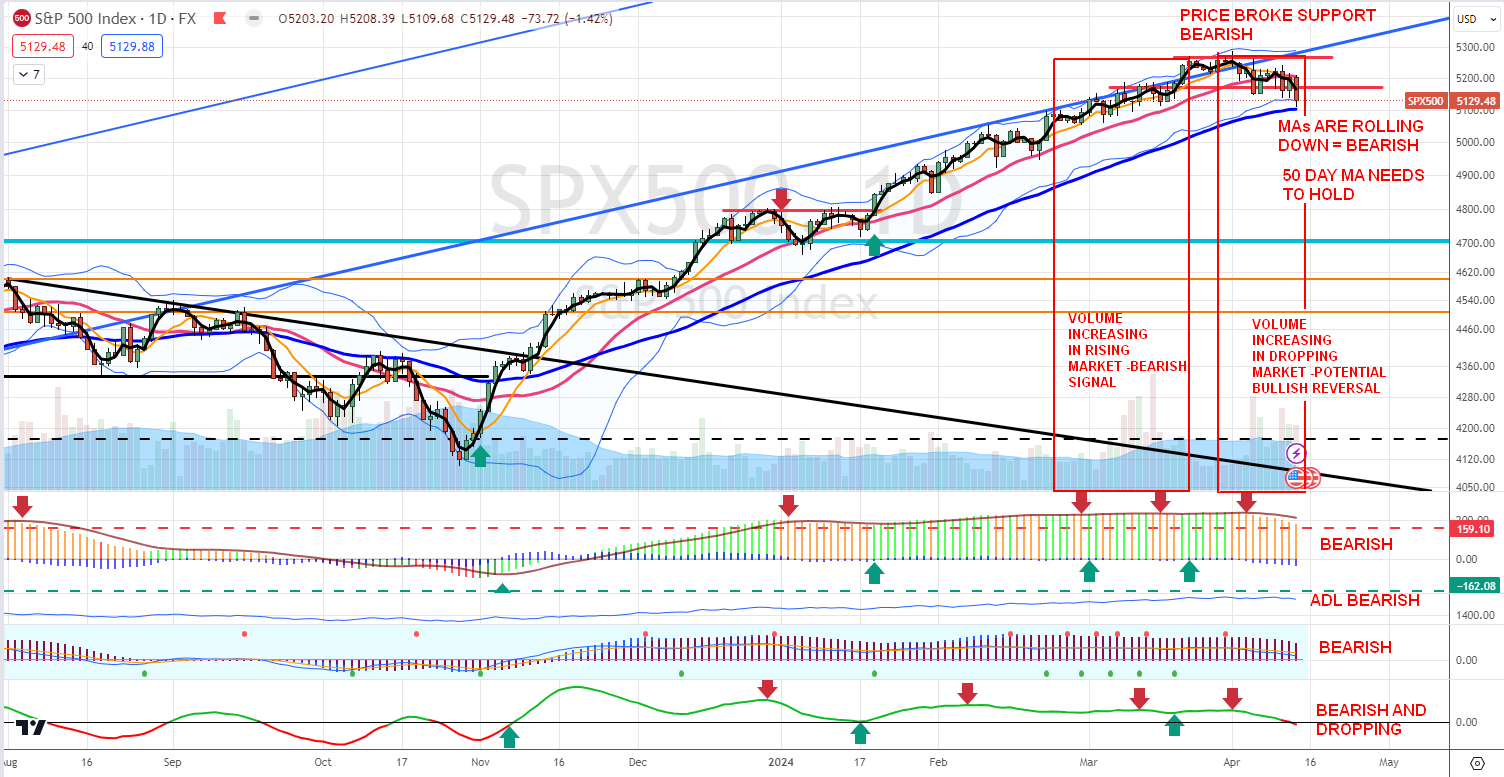
The S&P 500 trend is now leveling off into a sideways trend. Its support level is now 5,123.
Resistance is now at 5,265. The forward PE ratio of the index has now dropped to 20.35x. Its
five-year average is 19.0x, and its ten-year average is 17.7x. It got as high as 23x in early
2021, when rates were near zero. The S&P 500 would have to pull back to 4,560 to return the
|
|
forward PE ratio to 19.0x. The golden cross in February of last year is still in place.
|
|
|
The chart turned bearish a week ago, and it is still bearish. The trend rolled over and it is now dropping. All indicators are flashing a bearish. Volatility spiked well above the 55% threshold, and the chance is this will continue next week.
|
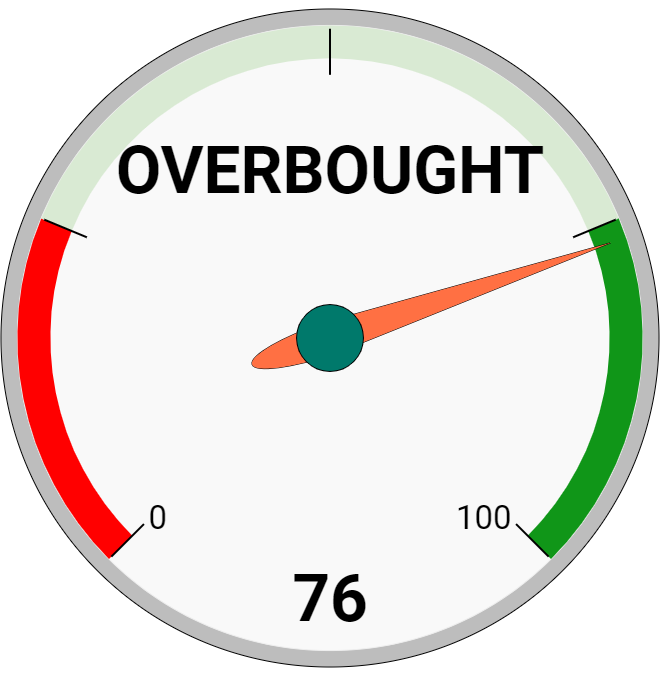
Market Score
The market score is now 76. It is a large drop from 83 just a week ago! This indicates significant damage to the trend. The primary (secular) trend is still bullish, and this can be just a correction, but be prepared for a potential 10% drop.
|
What does the new score mean? I am (trying to be) a contrarian. When everyone is in FOMO YOLOing all their money in high-flying stocks like crazy, I stay cautious and on the sidelines. I trade options, but I am cautious and prepared to exit as soon as the conditions change. As of today, these conditions have arrived, and it is time to become defensive. This score means that the market is still OVERBOUGHT but dropping. However, the indicator I created should not be used alone. I use it with my volatility score to determine whether it is still safe to trade or get out.
|
Since the market is extremely overbought, I am not buying stocks (unless I find an extremely undervalued stock), but I am saving cash.
|
I save all proceeds (options premiums and dividends) to cash vehicles in this manner:
|
- Dividends > save to SGOV fund.
- Options premiums > save to ICSH fund.
|
|
Volatility Metrics
|
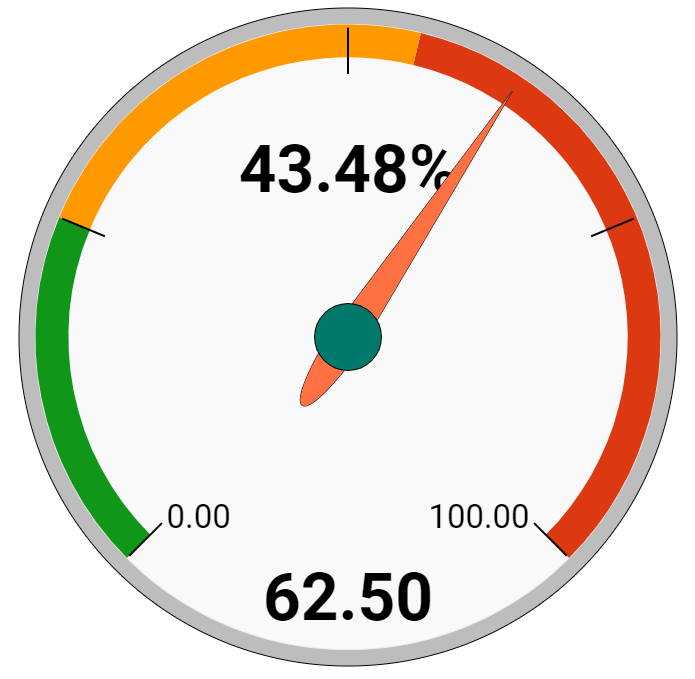
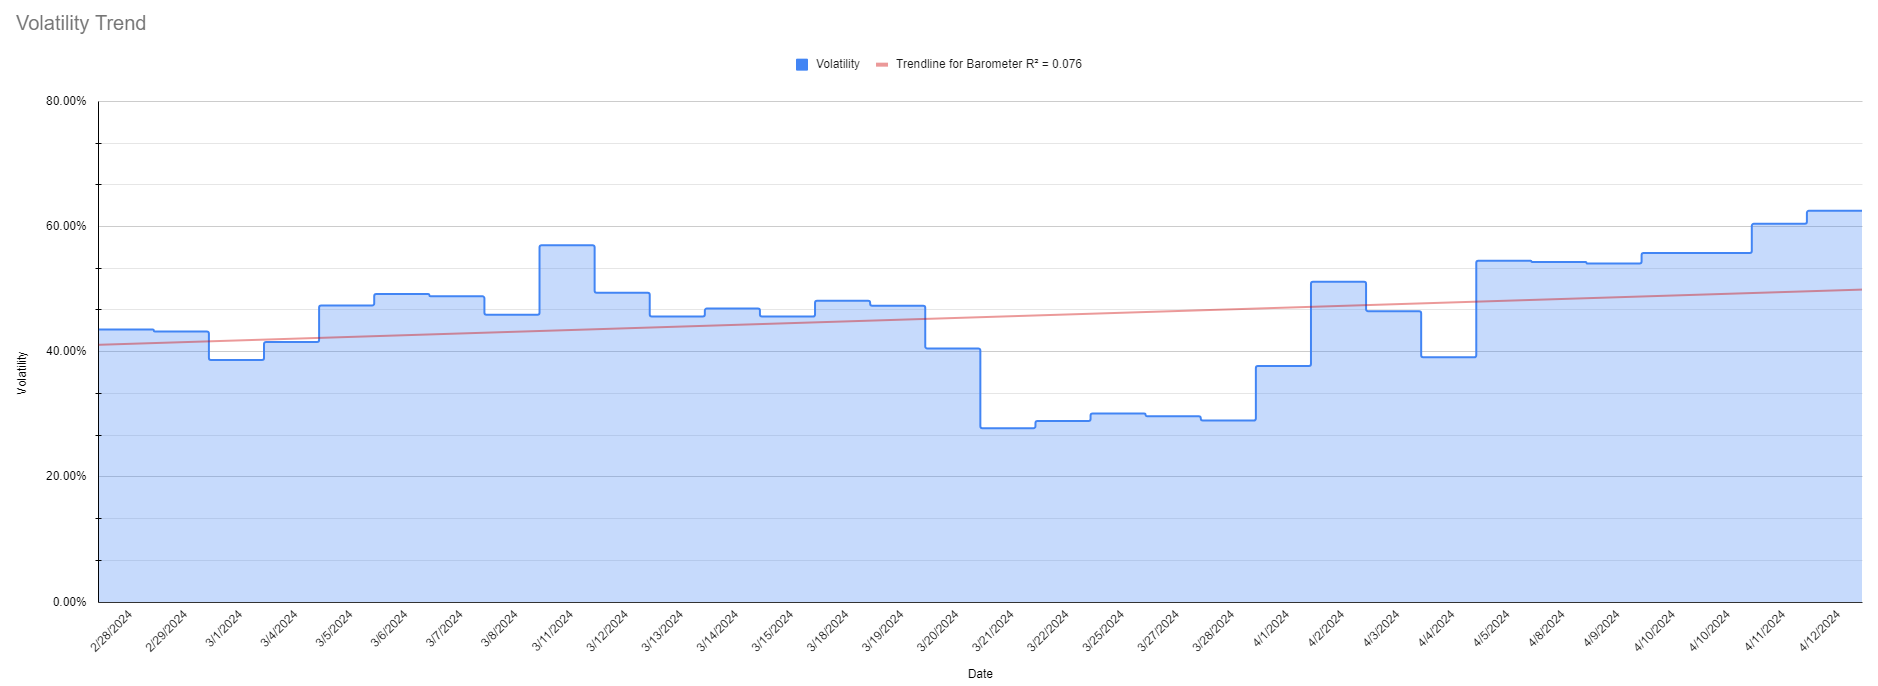
The volatility spiked hard again last week by a staggering 43%. The new score is 62.50%. This means that we are rotating into defensive positions. We will limit our options trading to a very minimum, avoid buying stocks, and buy ETFs performing well in a bear market.
|
|
|
|
The chart and trend indicate that volatility spiked hard and is trending up. The market participants are worried and panicking. Some are in denial, which may fuel further selloff in the near future. More of them may be buying protective puts or selling out of their bullish positions. The market trend is reversing.
|
There are the following potential scenarios:
|
|
1) Volatility starts rising, the score rises, and the market rallies.
|
This will be the most dangerous scenario. It will indicate that the correction is imminent. In this market, we will save cash (parking it into ICSH and SGOV), not buy new stock positions, and keep trading options, but we will not be scaling up our trading.
|
|
2) Volatility increases above 55%, the score still rises, and the market still rallies
|
This indicates that it is time to go bearish and defensive. Let others keep propping the market, but we will reverse our trades into neutral to bearish trades. We will add protective positions. Our options trades will be placed as far away from the market as possible, and we will trade Iron Condors.
|
|
3) Volatility keeps increasing above 55%; the score starts dropping, and the markets stall, reverse, or drop.
|
This will be the time to go full defensive and bearish. We will likely release cash (selling ICSH and SGOV funds to increase cash) to prevent margin calls. Our options trading will be fully bearish (selling calls or call spreads), and we will buy 2x or 3x leveraged bearish ETFs (sell SSO, SPXL, and buy VIXM, XLU, or stay in cash. We will buy protective puts, trade collars, or deep ITM-covered calls to protect our dividend stocks.
|
|
4) Volatility crashes, score crashes, and the market crashes.
|
This will be the time to go aggressively bullish again. We will liquidate all bearish trades and rotate them into bullish ones, such as buying SPXL and SSO and adding stocks to our portfolio again. Our options trades will be bullish again (selling puts, selling put spreads, or trading Iron Condors).
|
Today, we are in scenario #3 (highlighted in red above). We sold our holdings SSO and bought IYR defensive ETF. We are still holding QLD funds, but if the volatility and market score keep deteriorating, we may be out of QLD, too. We are also saving cash in SGOV and ICSH funds or in cash position (depending on margin requirements). Our option trades are now neutral. We are not scaling options trading and replacing old trades; we are just managing the old ones. We are also not buying new stock positions.
|
Market Outlook
EARNINGS SEASON IS NOW UNDERWAY! For Q1 2024, with 6% of S&P 500 companies reporting actual results, 83% have beaten their earnings estimates, and 53% have beaten their sales estimates. The estimated (year-over-year) earnings growth rate for the S&P 500 is now 0.9%, this is a big drop from recent weeks. We were at 3.2% last week, but we still have a small sample. If 0.9% is the actual growth rate for the quarter, it will mark the third quarter of year-over-year earnings growth for the index.
|
|
The S&P 500's estimate for Q1 is now $54.71 per share, down from $55.25 six weeks ago. The current revenue growth estimate is 3.4%.
|
44 S&P 500 companies will report this coming week.
|
The S&P 500 forward PE ratio goes down to 20.35x this week. Recently, this has still been well ABOVE the upper band of forward PE ratios. We got as low as 15.5x back in October of 2022, and we started the year 2023 at 17.0x. This forward PE ratio has dropped from 23.5x since the beginning of 2022. The five-year average is 19.0x. The ten-year average is 17.7x. The net profit margin for the quarter is expected to be 11.3%.
|
|
The trailing 12-month P/E ratio is 22.93, which is above the 5-year average of 22.4 and the 10-year average of 20.9.
|
For Q1 2024, analysts are projecting earnings growth of 0.6% and revenue growth of 3.4%
For Q2 2024, analysts are projecting earnings growth of 9.4% and revenue growth of 4.6%
For Q3 2024, analysts are projecting earnings growth of 8.6% and revenue growth of 5.1%
For Q4 2024, analysts are projecting earnings growth of 14.0% and revenue growth of 5.9%.
|
For all of 2024, analysts are projecting earnings growth of 10.3% and revenue growth of 4.8%
|
For all of 2025, analysts are projecting earnings growth of 14.0% and revenue growth of 5.9%.
|
The market is now homing in on the 2024 and 2025 estimates. The consensus analyst’s 12-month target price for the S&P 500 is 5,572. Everything slides ahead one quarter now that we are beginning a new quarter. The consensus analyst earnings estimate for the next four quarters is now $252. I am keeping my multiple at 19.0x for now.
|
(2024) $252 X 19.0 = 4,788 S&P 500 Target Price
My current 3-6 month target price for the S&P 500 is 4,788. This gives the S&P 500 an upside potential of -6.54%, which shows how overvalued the overall market is now. For a higher upside potential, we need to see a pullback of ~8%, more multiple expansion or material earnings expectations increases (unlikely). However, I am still finding individual stocks that have 80-100% upside potential over the next 3-5 years.
|
(2025) $288 X 19.0 = 5,572 S&P 500 Target Price
The consensus estimate for the next four quarters is $288.00. I am keeping my multiple at 19x this week. My current 6-12 month target Price for the S&P 500 is 5,572. This represents a +8.76% upside potential, which is below average.
|
|
|
|
|
Disclaimer: All information, analysis, and articles in this email are provided for educational purposes only. Nothing herein should be interpreted as personalized investment advice, as I do not recommend buying, selling, or holding any securities or positions. This email is available "as is" without warranty or guarantees of its accuracy, completeness, or currentness. You do so at your own risk if you rely on this email or any information. I do not hold myself out as a financial advisor, and nothing herein is a solicitation for any fund or securities mentioned. Although I may answer general questions about the information, I'm not licensed and registered under security laws to address your personal investment situation. Past performance is not indicative of future returns. Any financial decisions are the sole responsibility of you, the individual.
|
|
|
|
|
|
|
|
|

