|
|
|
The markets continued their downward spiral last week. A few attempts to recover failed. Are bears back in control? Is this a new bear market or just a correction?
|
|
Market sentiment
The week started in the wake of an unprecedented attack on Israel by Iran. Over 300 drones, cruise missiles, and ballistic missiles were sent almost simultaneously into Israel early Sunday morning. It was a surreal sight to watch. What would the damage and the death toll have been had Israel not had superior technology to Iran?
|
But is this enough to justify the selling, or is it just an excuse? Look at it this way: Wall Street is selling off but ignoring what the consumer-driven US economy would do. Will this impact consumers' shopping? Will you go to Costco to buy stuff, but before you do, will you check what is happening on the other side of the globe, and when realizing there is a war, you cancel your shopping list? Of course not. People will go and do what they do every day.
|
Do we thank the arm of man, the God of Israel, a little bit of both, or none of the above? Or is this a bitter rivalry dating back several thousand years to Jacob and Esau? These are very scary times in which we live. It would not take much for several ongoing wars to escalate into even bigger wars. We live in a day and age of “wars and rumors of wars.”
|
The S&P 500 shed 6.04% from its peak a few weeks ago. That is a nice correction so far. But it can go lower. The average corrections are between 5% and 10%. Even a 15% correction would be perfectly normal. The question is, are you prepared for it? During the last couple of corrections and bear markets, I struggled. Today, thanks to my market gauge metrics, I was able to close some bullish trades early enough to preserve my portfolio and buying power to navigate through this volatile market. My subscribers will now receive signals when the markets reverse so you can do the same.
|
|
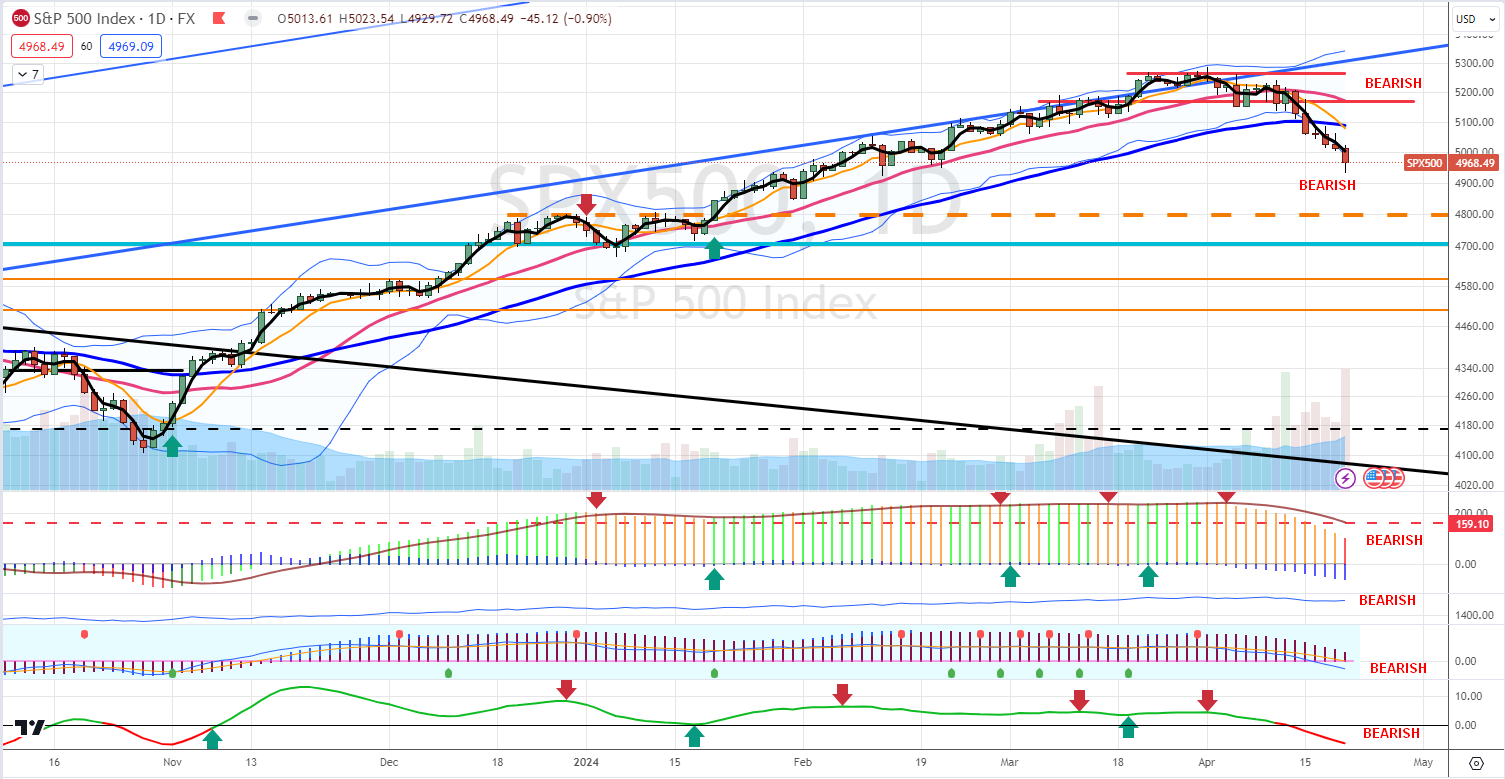
The S&P 500 is done leveling off the sideways trend. It has now turned south into a downtrend. Its support level is now 4,674. Resistance is now at 5,123. The forward PE ratio of this index has now dropped to 19.9x. Its five-year average is 19.0x, and its ten-year average is 17.7x. It peaked at 23x in early 2021 when rates were near zero. The S&P 500 would have to pull back to 4,750 to return the forward PE ratio to 19.0x. The Golden Cross of February of last year is still in place.
|
|
|
|
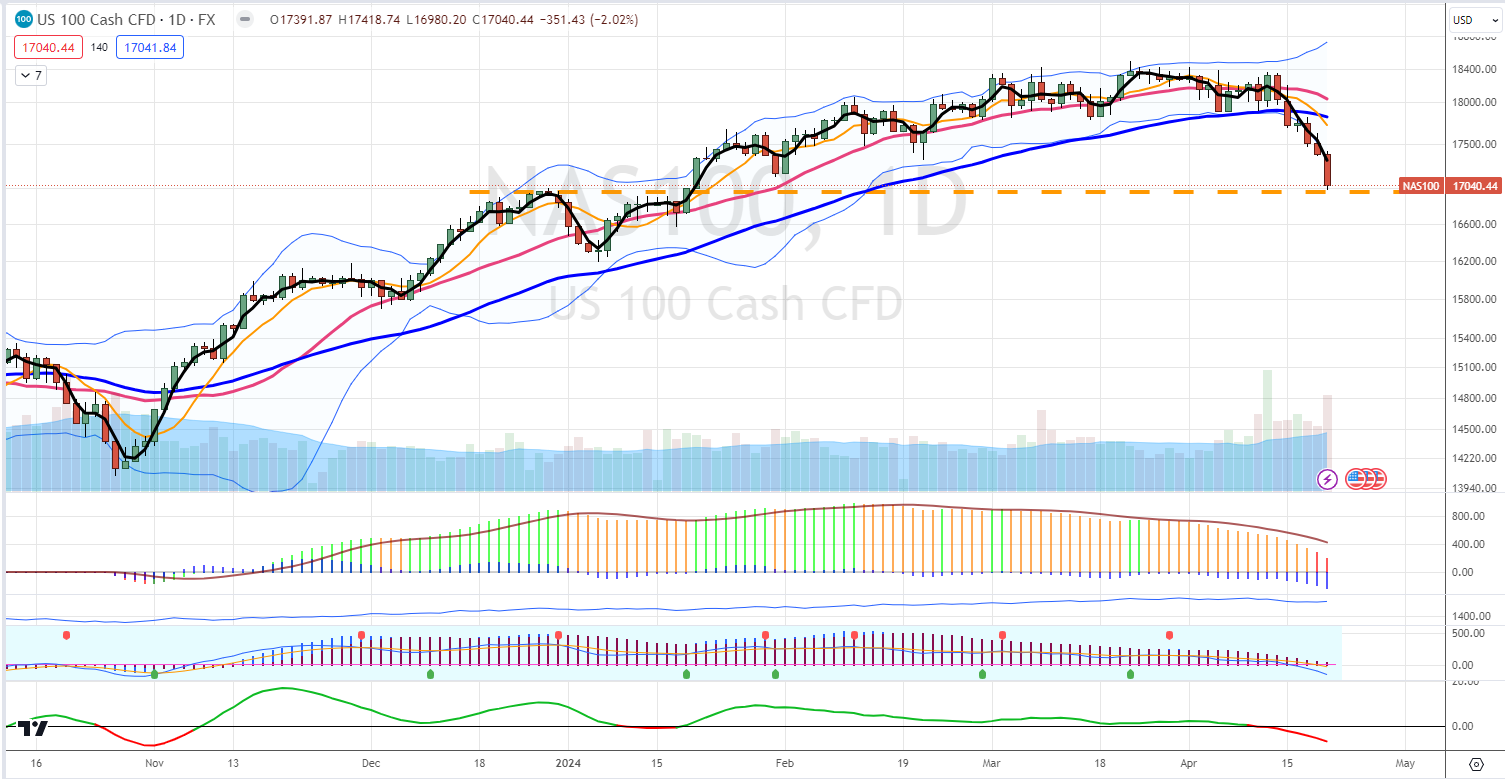
The chart turned bearish a few weeks ago and we had no relief rally yet whatsoever. The thick orange dashed line shows the beginning of the year 2024. As you can see, the S&P 500 almost erased all gains. Nasdaq is worse, it already erased these gains in a week or two:
|
|

|
That's how crazy this market is. All hurray action and now pessimism over nothing. But that is typical. The market participants are mostly idiots, so we have to learn not to be like them, and we will prosper.
|
Market Score
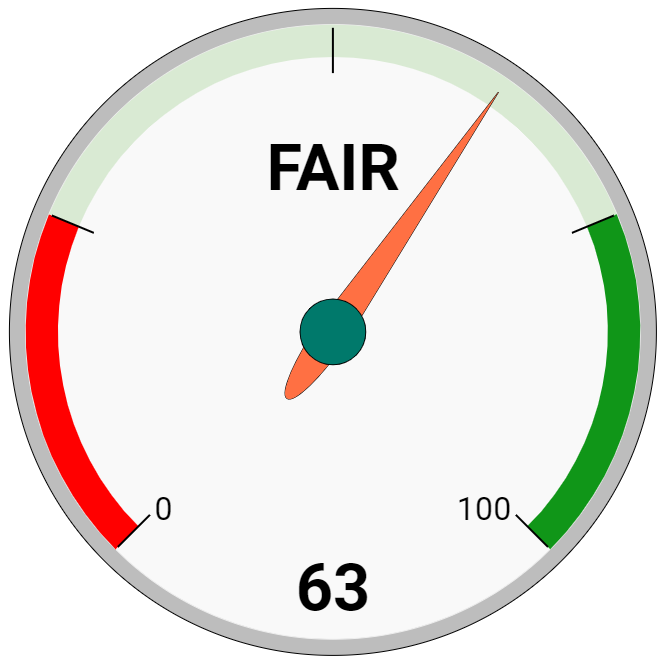
The market score dropped significantly to 63. It is a large drop from 83 just two weeks ago! This indicates significant damage to the trend. The primary (secular) trend is still bullish, and this can be just a correction, but be prepared for a potential 10% to 15% drop.
|
When the market drops like this, we will be getting ready for the moment when we start buying stocks again. In the previous weeks, we held cash, and we are now ready to deploy it. But not yet! The volatility is still very high and we need that to turn around too. But we can see it coming soon.
|
I still save all proceeds (options premiums and dividends) to cash vehicles in this manner:
|
- Dividends > save to SGOV fund.
- Options premiums > save to ICSH fund.
|
|
Volatility Metrics
|
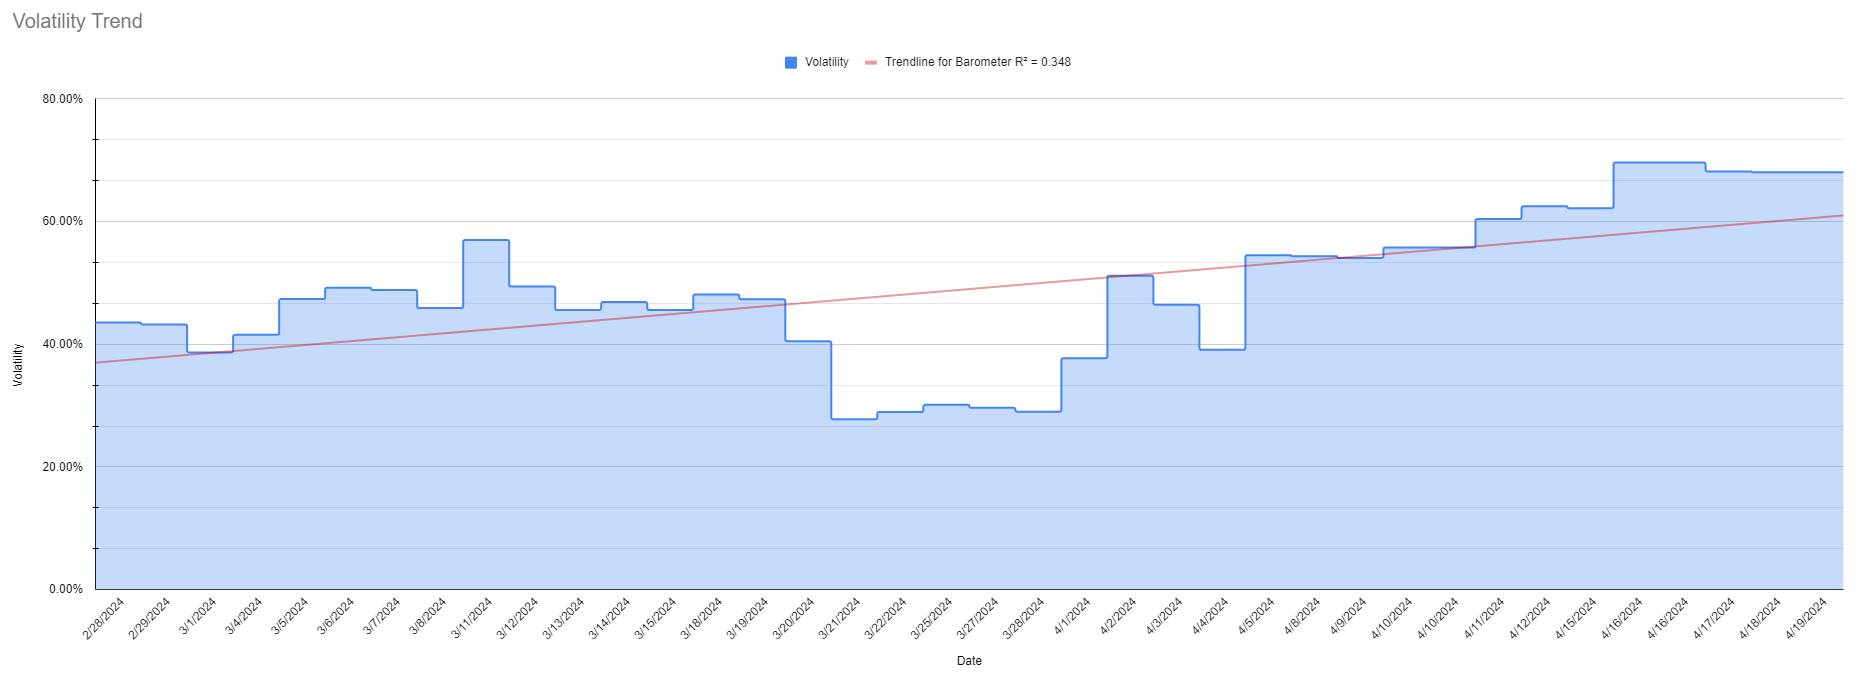
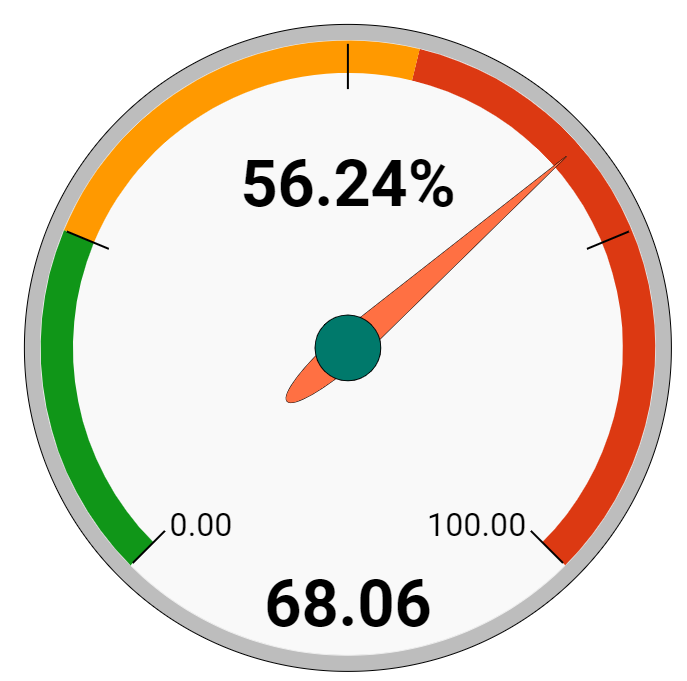
Volatility spiked again last week by a staggering 56%. The new score is 68.06. We rotated into defensive positions a week ago and now we are waiting for this correction to end to rotate back into bullish positions. We will limit our options trading to a minimum (mostly trading call spreads and managing old put spreads only), avoid buying stocks, and buy ETFs performing well in a bear market.
|
|
|

|
The chart and trend indicate that volatility spiked hard and is trending up. The market participants are worried and panicking. Some are in denial, which may fuel further selloff in the near future. More of them may be buying protective puts or selling out of their bullish positions. The market trend is reversing.
|
There are the following potential scenarios:
|
|
1) Volatility starts rising, the score rises, and the market rallies.
|
This will be the most dangerous scenario. It will indicate that the correction is imminent. In this market, we will save cash (parking it into ICSH and SGOV), not buy new stock positions, and keep trading options, but we will not be scaling up our trading.
|
|
2) Volatility increases above 55%, the score still rises, and the market still rallies
|
This indicates that it is time to go bearish and defensive. Let others keep propping the market, but we will reverse our trades into neutral to bearish trades. We will add protective positions. Our options trades will be placed as far away from the market as possible, and we will trade Iron Condors.
|
|
3) Volatility keeps increasing above 55%; the score starts dropping, and the markets stall, reverse, or drop.
|
This will be the time to go full defensive and bearish. We will likely release cash (selling ICSH and SGOV funds to increase cash) to prevent margin calls. Our options trading will be fully bearish (selling calls or call spreads), and we will buy 2x or 3x leveraged bearish ETFs (sell SSO, SPXL, and buy VIXM, XLU, or stay in cash. We will buy protective puts, trade collars, or deep ITM-covered calls to protect our dividend stocks.
|
|
4) Volatility crashes, score crashes, and the market crashes.
|
This will be the time to go aggressively bullish again. We will liquidate all bearish trades and rotate them into bullish ones, such as buying SPXL and SSO and adding stocks to our portfolio again. Our options trades will be bullish again (selling puts, selling put spreads, or trading Iron Condors).
|
Today, we are in scenario #3 (highlighted in red above). We sold our holdings SSO and bought IYR defensive ETF. We are still holding QLD funds, but if the volatility and market score keep deteriorating, we may be out of QLD, too. We are also saving cash in SGOV and ICSH funds or in cash position (depending on margin requirements). Our option trades are now neutral. We are not scaling options trading and replacing old trades; we are just managing the old ones. We are also not buying new stock positions.
|
Market Outlook
EARNINGS SEASON IS NOW UNDERWAY! For Q1 2024, with 14% of S&P 500 companies
reporting actual results, 74% have beaten their earnings estimates, and 58% have beaten
their sales estimates. The estimated (year-over-year) earnings growth rate for the S&P 500 is
now 0.5%, this is a big drop from recent weeks. We were at 3.2% two weeks ago but still
have a small sample. If 0.5% is the actual growth rate for the quarter, it will mark the third quarter of year-over-year earnings growth for the index.
|
The estimate for Q1 is now at $53.65 per share for the S&P 500. Seven weeks ago, it was
$55.25. This number shall be compared with $53.33 per share for the S&P 500 aggregate one year ago. The current revenue growth estimate is 3.5%.
|
158 S&P 500 companies will report this coming week!
|
|
The S&P 500 forward PE ratio dropped to 19.9x this week. This has been well above the upper band of forward PE ratios recently but is now coming down from its bloated 22x level. We got as low as 15.5x in October 2022 and started 2023 at 17.0x. This forward PE ratio has dropped from 23.5x since the beginning of 2022. The five-year average is 19.1x. The ten-year average is 17.8x. The net profit margin for the quarter is expected to be 11.2%.
|
The trailing 12-month P/E ratio is 22.3x, now just below the 5-year average of 22.4 and above the 10-year average of 20.9.
|
For Q1 2024, analysts are projecting earnings growth of 0.5% and revenue growth of 3.5%
For Q2 2024, analysts are projecting earnings growth of 9.6% and revenue growth of 4.4%
For Q3 2024, analysts are projecting earnings growth of 8.7% and revenue growth of 5.0%
For Q4 2024, analysts are projecting earnings growth of 17.7% and revenue growth of 5.6%.
|
For all of 2024, analysts are projecting earnings growth of 10.7% and revenue growth of 5.0%
|
For all of 2025, analysts are projecting earnings growth of 13.8% and revenue growth of 5.9%.
|
The market is now homing in on the 2024 and 2025 estimates. The consensus analyst’s 12-month target price for the S&P 500 is 5,572. Everything slides ahead one quarter now that we are beginning a new quarter. The consensus analyst earnings estimate for the next four quarters is now $253. I am keeping my multiple at 19.0x for now.
|
(2024) $253 X 19.0 = 4,807 S&P 500 Target Price
My current 3-6 month target price for the S&P 500 is 4,807. This gives the S&P 500 an upside potential of -3.22%, which shows the overall market is overvalued. We need a pullback of ~8% for a higher upside potential, more multiple expansion or material earnings expectations increases (unlikely). However, I am still finding individual stocks that have 80-100% upside potential over the next 3-5 years.
|
(2025) $288 X 19.0 = 5,572 S&P 500 Target Price
The consensus estimate for the next four quarters is $288.00. I am keeping my multiple at 19x this week. My current 6-12 month target Price for the S&P 500 is 5,572. This represents a +12.2% upside potential, which is below average.
|
|
|
|
|
Disclaimer: All information, analysis, and articles in this email are provided for educational purposes only. Nothing herein should be interpreted as personalized investment advice, as I do not recommend buying, selling, or holding any securities or positions. This email is available "as is" without warranty or guarantees of its accuracy, completeness, or currentness. You do so at your own risk if you rely on this email or any information. I do not hold myself out as a financial advisor, and nothing herein is a solicitation for any fund or securities mentioned. Although I may answer general questions about the information, I'm not licensed and registered under security laws to address your personal investment situation. Past performance is not indicative of future returns. Any financial decisions are the sole responsibility of you, the individual.
|
|
|
|
|
|
|
|
|