Weekly Newsletter   Challenge account   Weekly Newsletter   


Posted by Martin January 18, 2016
No Comments


This market is poised for another 10% drop


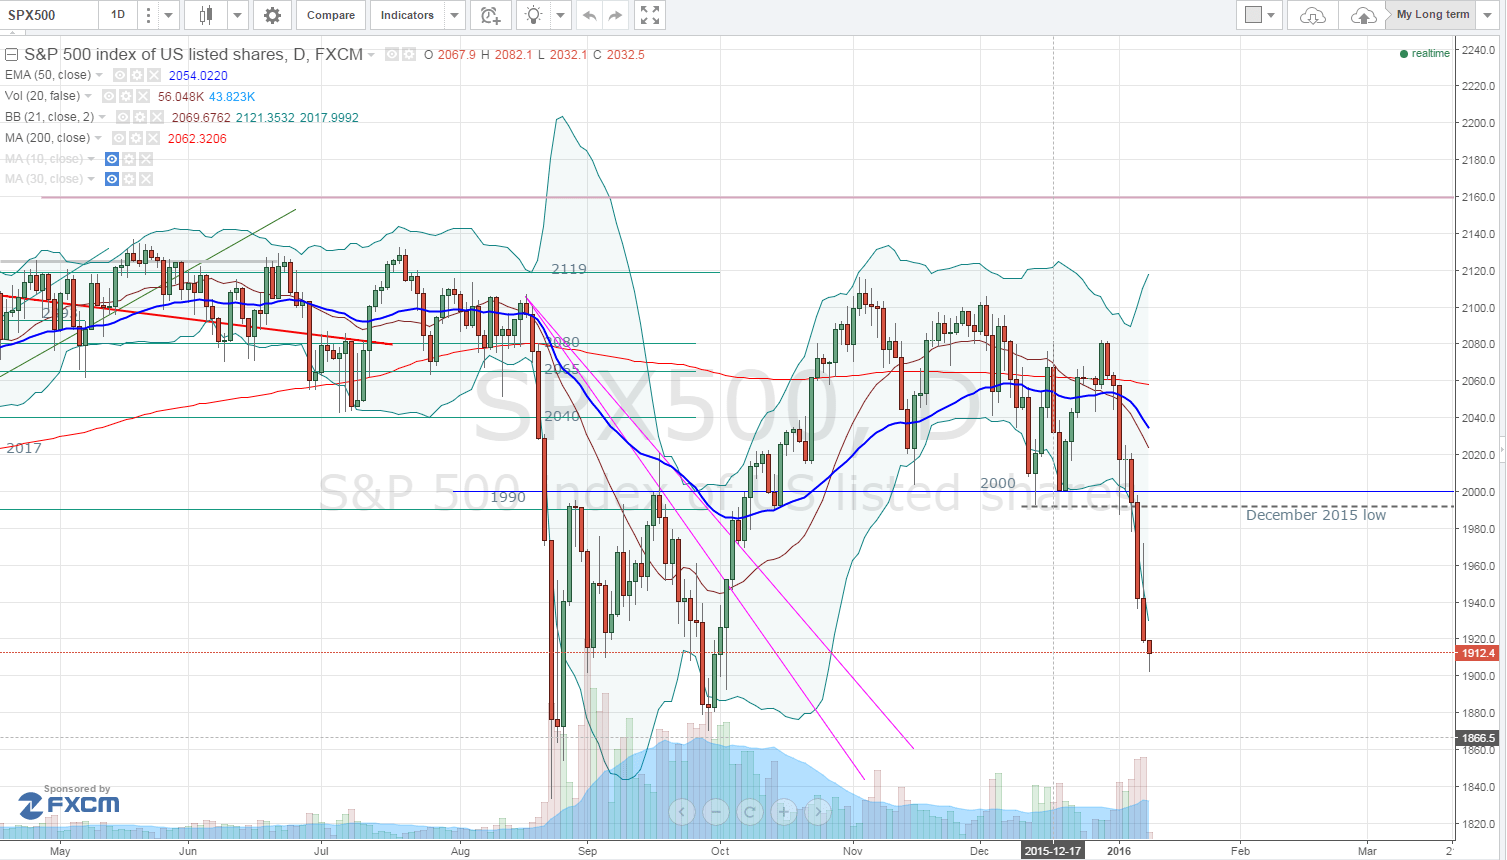
The S&P 500 is now 12% off of the all-time high price. Many investors and traders say that we are way oversold and we should go up from now here or bounce.

Yes, we may bounce, but overall, market price action data indicate that selling is far from over and that we may see more selling to come. The data shows that we may drop yet another 10% before we can claim an exhaustion and trend reversal.


The video worth watching with Peter Schiff predicting how FED and Congress will most likely try to fix the coming crisis, which will at the end create an even bigger crisis. The result may be that the new medicine FED is going to prescribe may not work at all.
 

But I admit, we are at the critical support which may hold. But will it really hold? What’s ahead of us then?

We may see a relief rally, bounce, or a plain rally failure and resumed selling.


 · Relief rally


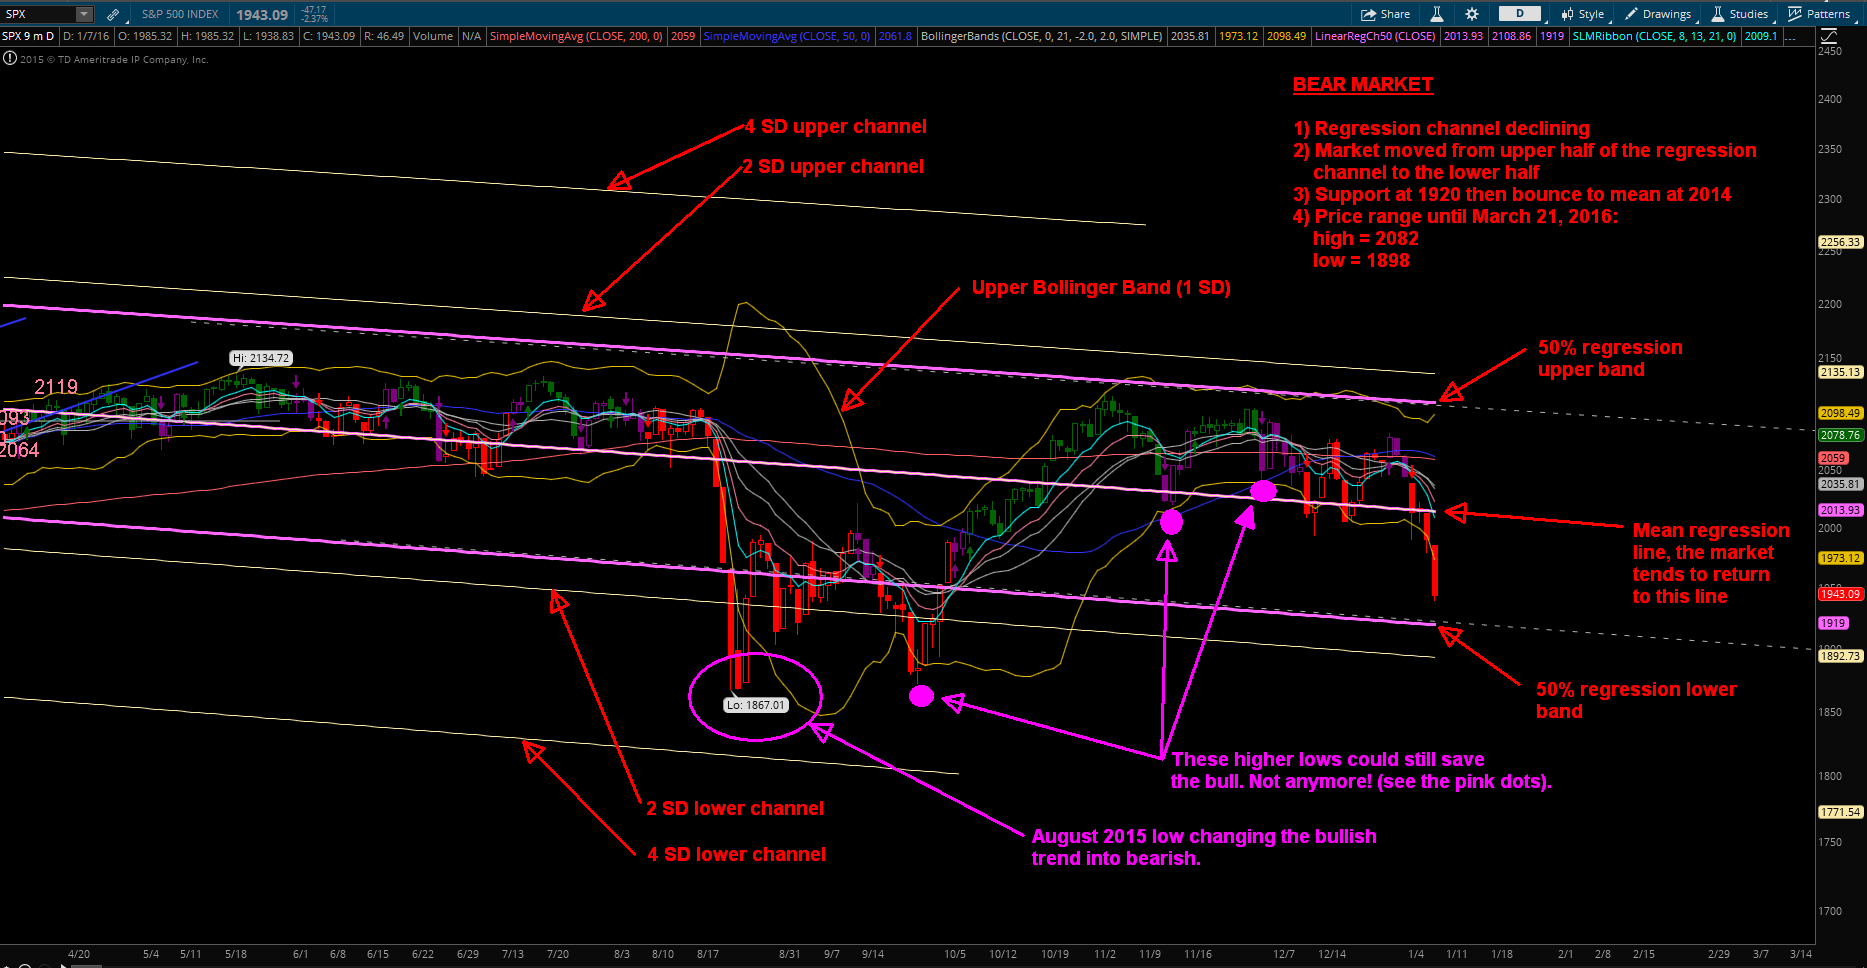
The S&P500 is at the critical support level. Last week we dropped all the way down to the August lows. Some traders were predicting this outcome way before in October and November last year. I refused to believe it as I didn’t see any catalyst for a renewed selling. Yet it happened.

 
SPX trend
 

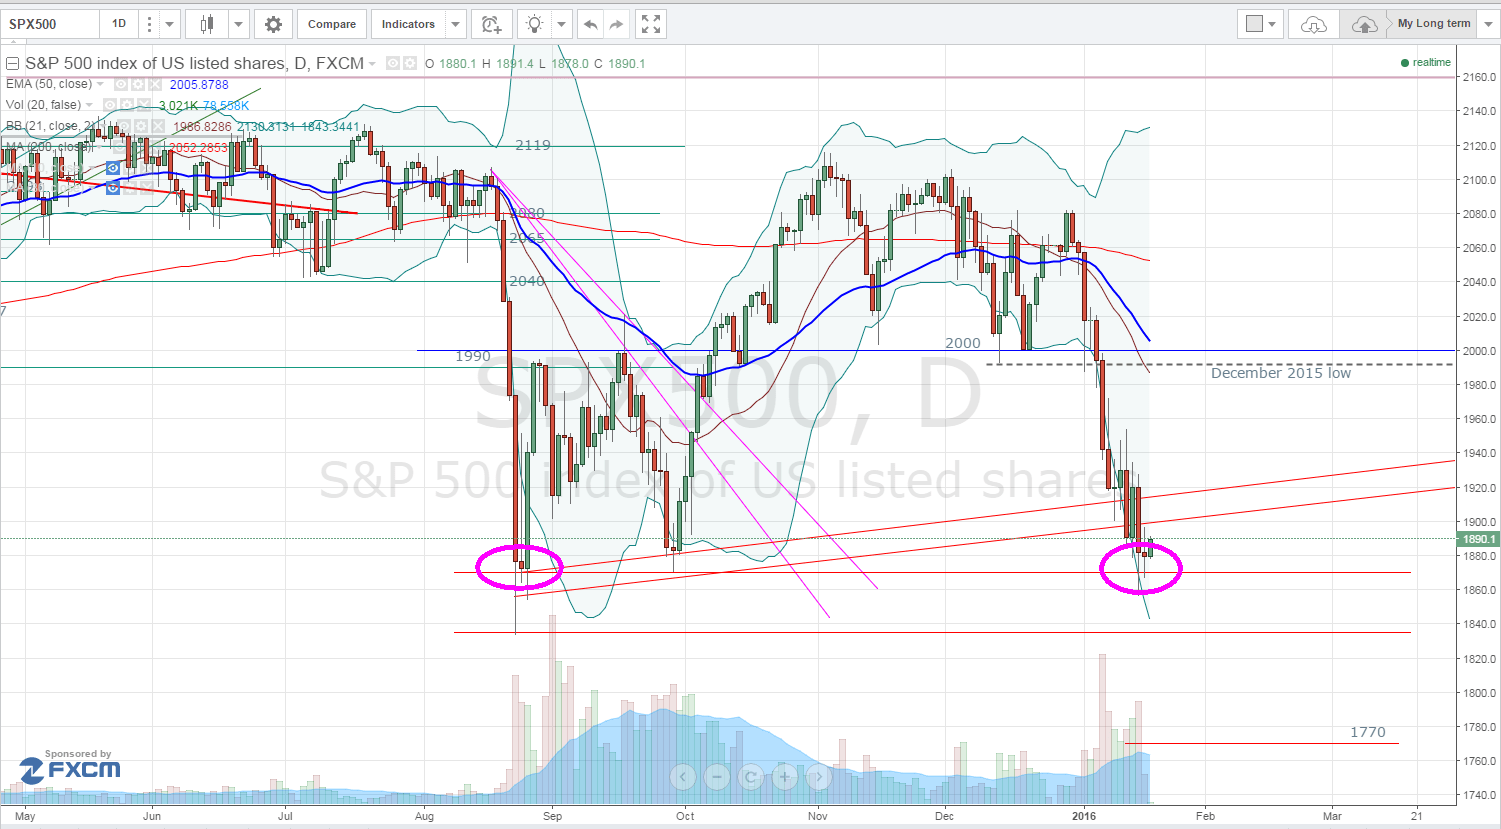
This creates a significant support which may attract “big dippers” (dip buyers) who will be buying at these levels. The buying spree may be strong enough to move the market relatively high.

We can see the market push back up to 1980 level.

 
SPX trend
 

The dipper’s buying may even push the market all the way back to back 2060- 2070 level. However, I do not expect this outcome at all.


 · Bounce


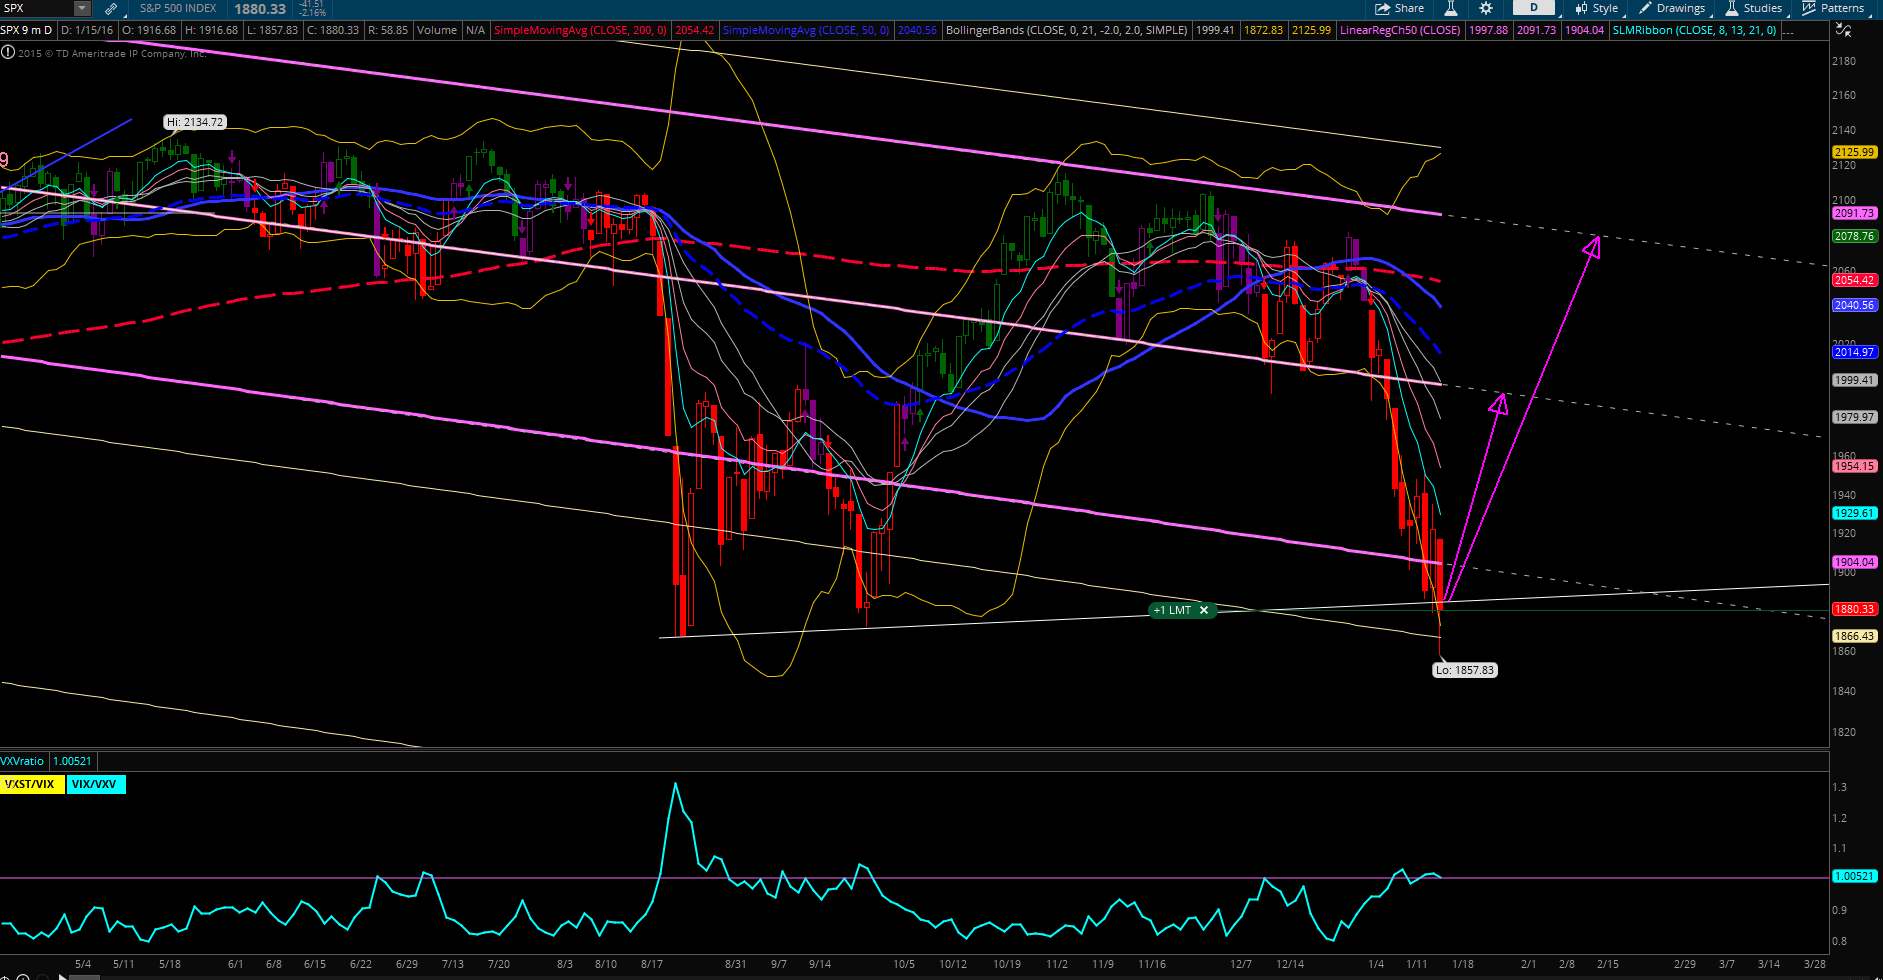
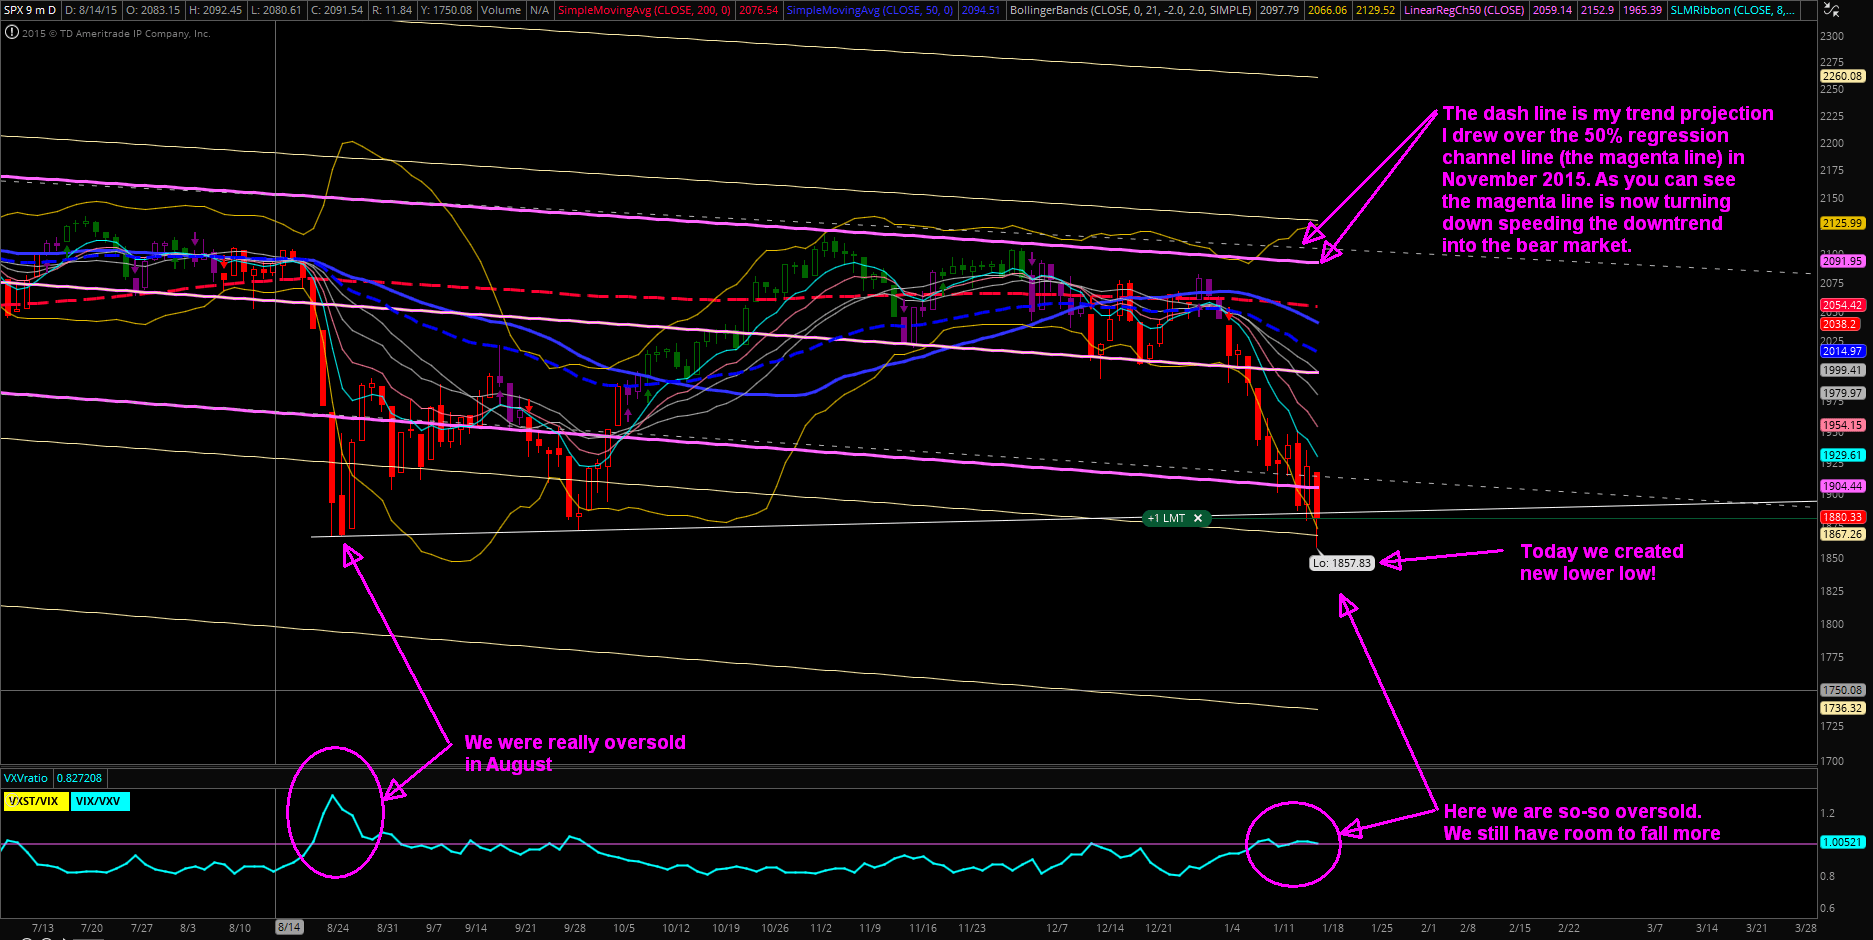
It is possible that bulls will be able to push the market only a little, more like in August 2015 when we saw only a moderate recovery and a second dip afterwards signaling a problem. We may see a bounce to 1930 – 1940 level only. We may even see a bounce to 1900 level which is now yet another significant resistance level which bulls may not be able to overcome.

 
SPX trend
 

When reviewing other data and market behavior as I will show below, I believe this is a more probably outcome, that we only see a small bounce and then selling will resume.

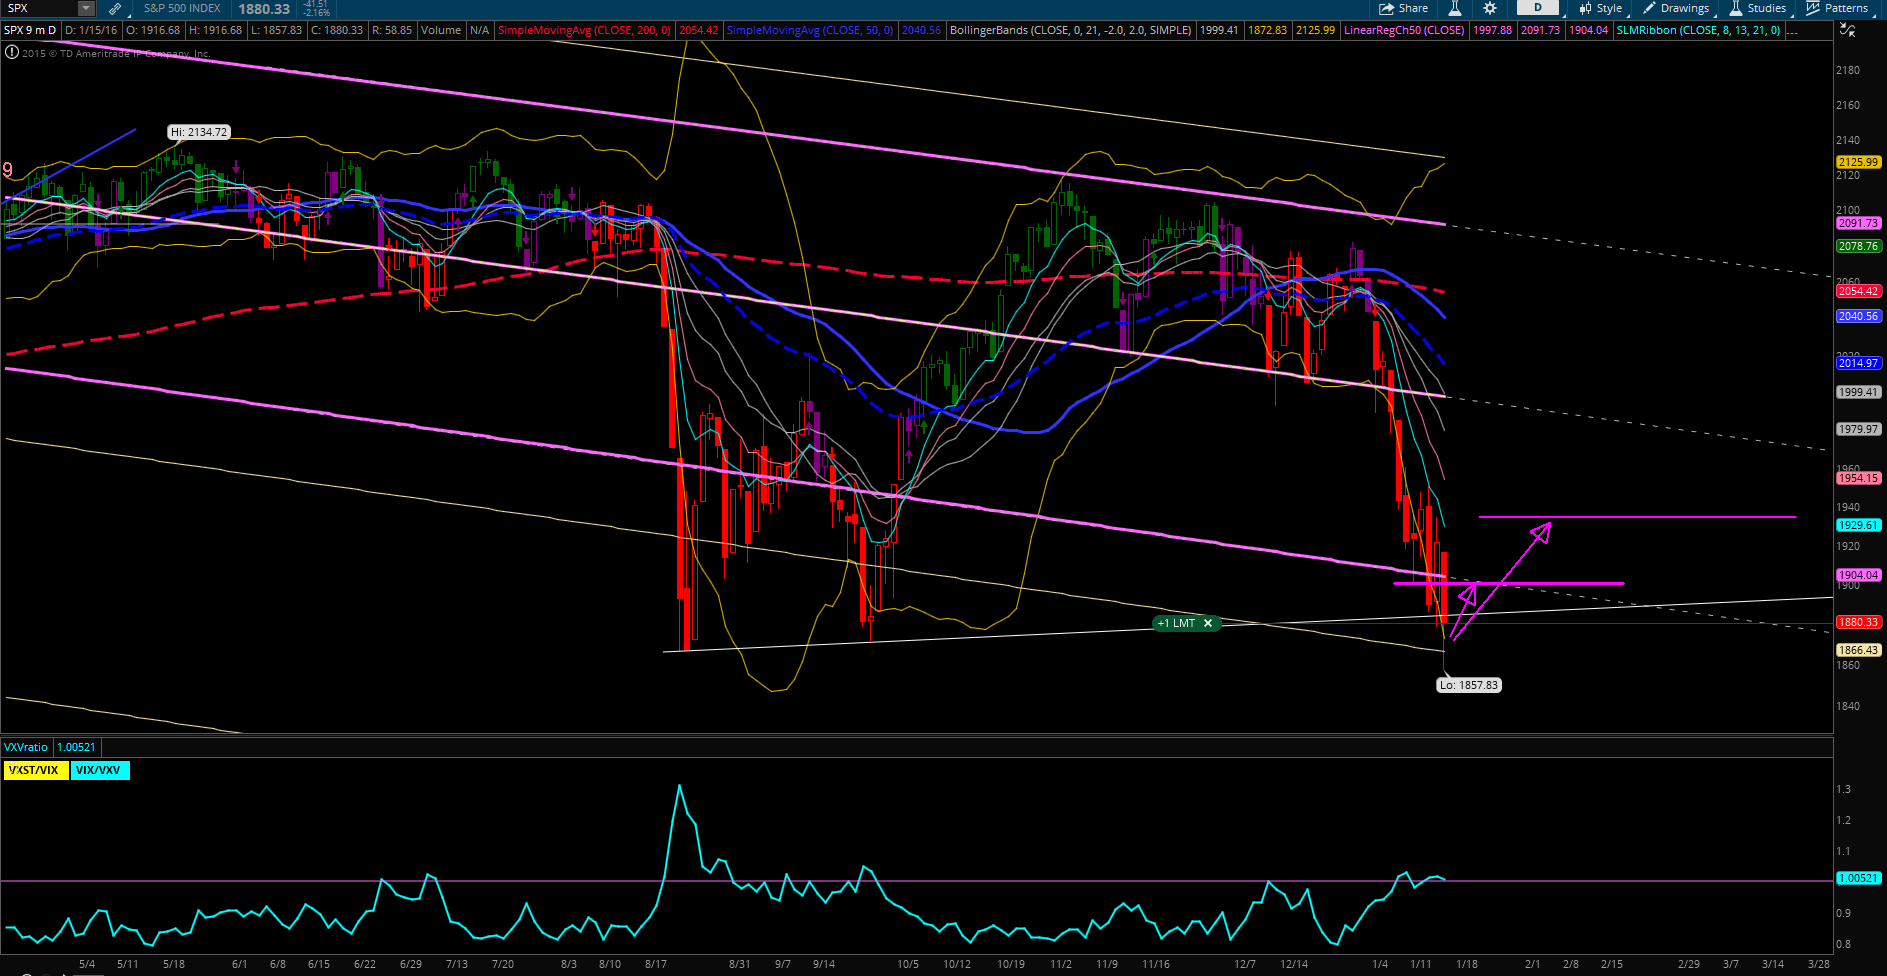
But I see an even bigger chance of the market opening with a bounce up tomorrow morning, then selling resumes in the afternoon and we will see another 10% selloff in the coming days or weeks.


 · Another 10% selloff


Why I think there will be more selling coming?

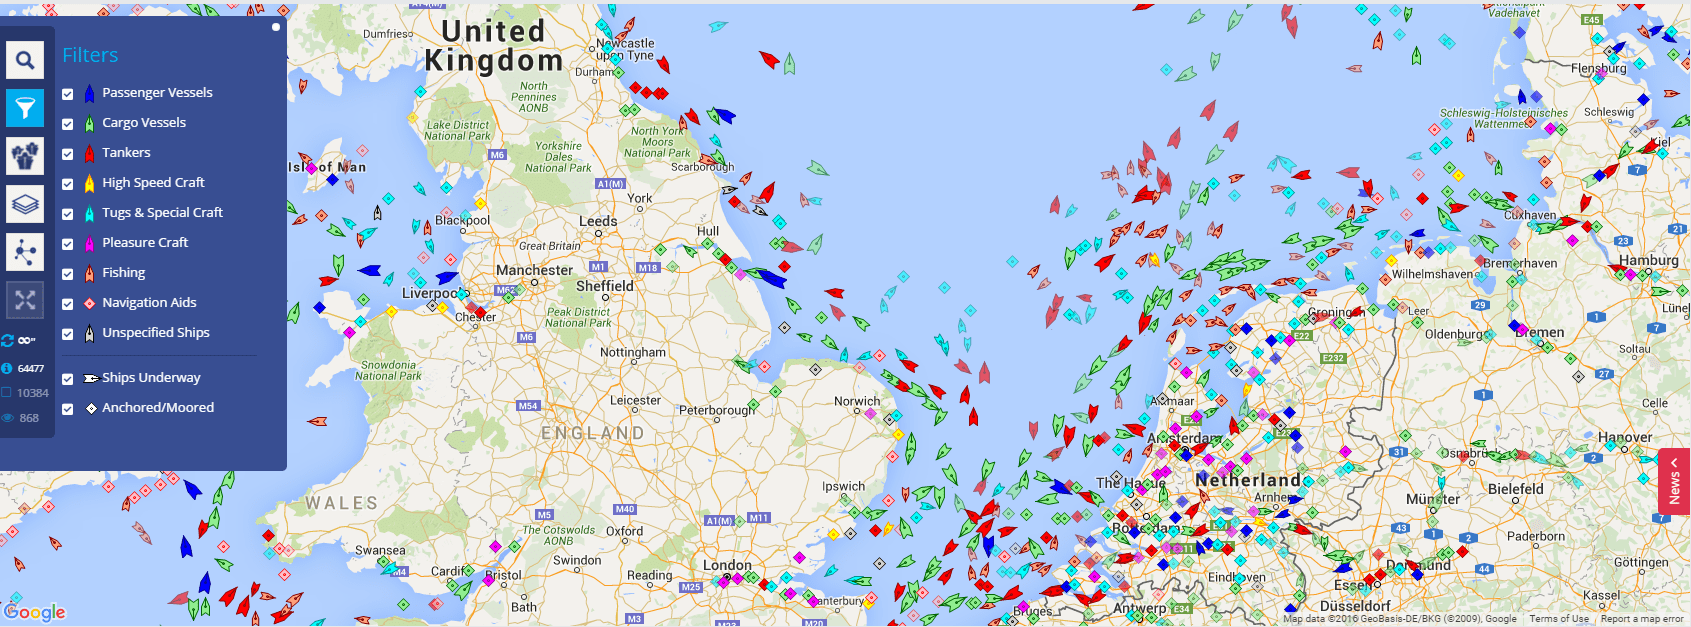
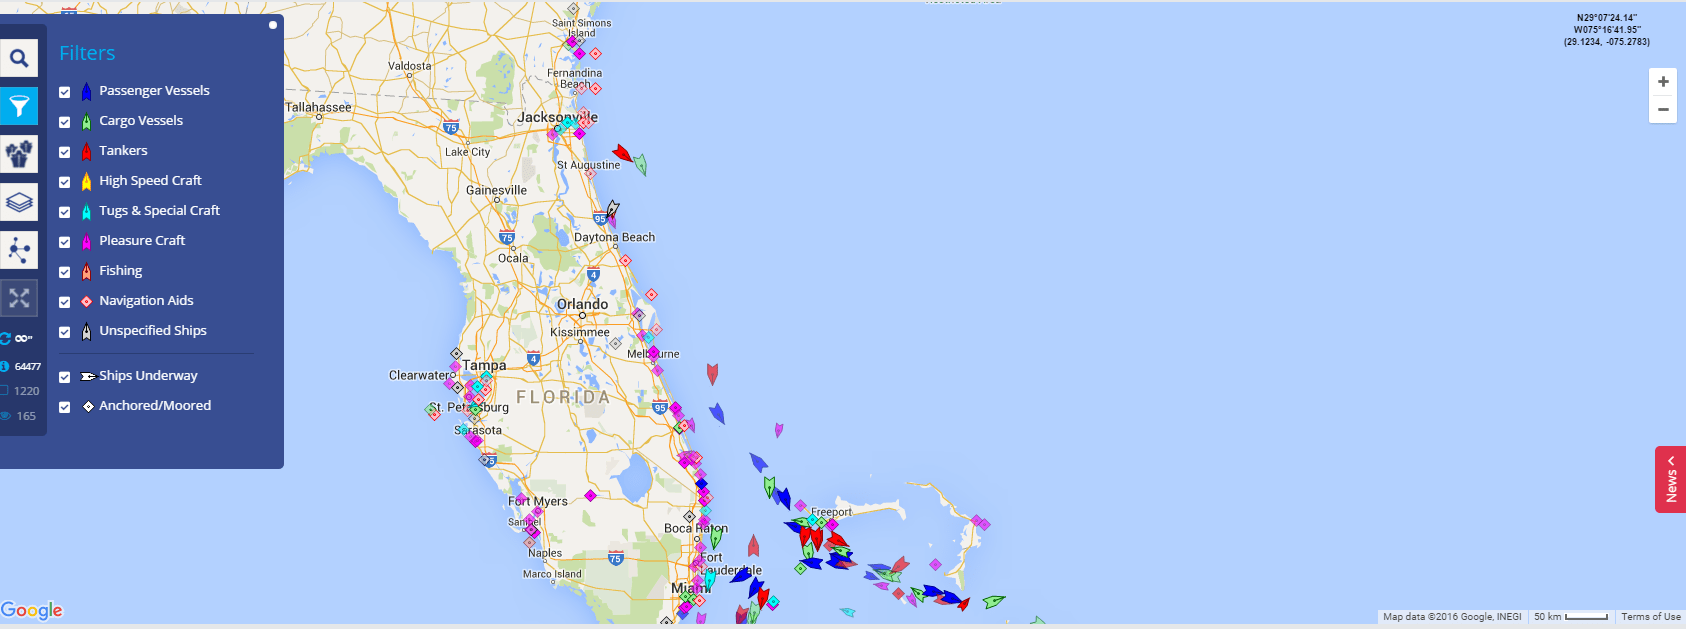
There are a few reasons for it. Of course the first reason is slowing US and world (global) economy. Do you remember my post about transatlanting transportation? I wrote the post 8 days ago and I was checking the cargo ship movements time to time on the Marine Traffic website to see if the halted commerce was an anomaly or something more serious.

There are still no ships transporting goods over the Atlantic Ocean. No single oil tanker or cargo ship. They are still halted docked at the port or near cost.

If you open the web site, you will still see the same picture as the one below I posted eight day ago:

 
SPX trend
 

Is this an anomaly? Or is the website working? How else we can verify whether the traffic is moving? Let’s take a look at Bloomberg Baltic Dry Shipping index:

 
SPX trend
 

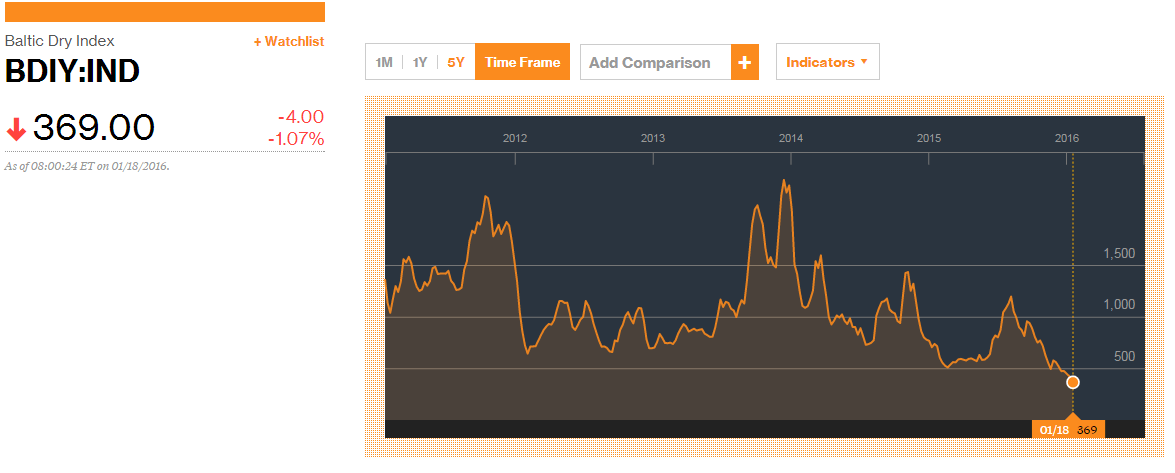
The Baltic Dry Index (BDI) measures the rates for chartering the giant ships that transport iron ore, coal and grain, and it has attracted the attention of traders and market commentators hoping to take the pulse of world trade. This index has been falling the entire second half of 2015 and is at all-time low.

It corresponds with the calm seas and no ships being deployed to transport goods overseas. It seems like no one is buying any goods and no one is selling. If this trend continues, this will impact the economy further. And not only the US economy but the entire world one.

We can see this same evolution in the transportation index (DJT). For most of the time we could see the transportation index in line with other indexes such as Dow Jones or S&P 500. but recently the transportation index has been also falling hard and dragging other indexes with it. It too fell hard in the second half of 2015.

 
SPX trend
 

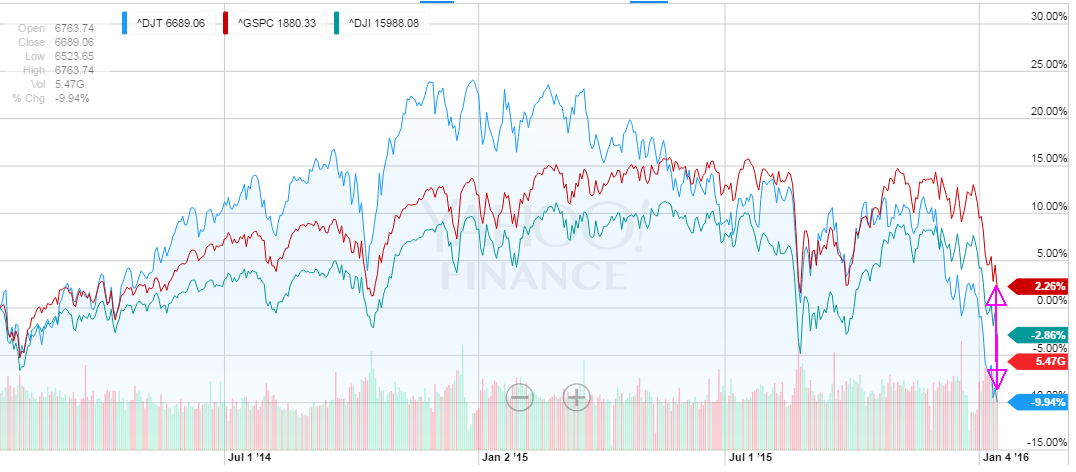
But the divergence of the transportation index and other indexes is so big, that I believe the markets will tend to get into alignment with the transportation index to find equilibrium. The transportation index may rise a bit to go to meet the indexes, but mostly the indexes will fall lower to meet the transportation index. But given the fact that there is no commercial activity out there, it is more likely that it will be the indexes to go to meet the transportation index.

To do so, the indexes will have to fall another 10%.


 · How to protect yourself?


It is quite hard to provide an advice and I cannot provide any financial or investment advice. But this is what I will be doing if my expectations are correct and the markets fall another 10%.

Dividend investor

There is not much to do as a dividend investor. Even if there will be a tornado in Wall Street and markets crash I will still continue reinvesting dividends using DRIP program.

I will continue buying shares on the way down (dollar cost averaging) but I will apply a strategy I call a contingency buying order. It means that I split my cash into smaller buying lots (not the market lots). For example, if I have $3,000 to buy my next stock, I will split it into (3) $1,000 lots.

Then I will place an OTO (one triggers other) buying order, which will basically do: If the price gets at or above a certain level, trigger a buy order at or below that level at market. Then I will place my limit price approx. 10% above the previous day high price.

What this does is that if the price of the stock is falling, the buy order is not triggered and I trace it down with the stock price. Once the stock reverses and reaches my limit, it triggers the buy order and buys the stock.

I used this method successfully in the past and thanks to that I could buy stocks at a lot cheaper price than originally expected. Don’t be greedy, wait for the price to come to you.

Options trader

As an option trader I will be very careful selling puts as of now. The market doesn’t show any strength which can be used and ridden. The bounces are weak and shallow and they can be quickly sold off by bears. We are in a bear market and when in a bear market, you want to go with the trend and not against it.

I will most likely wait for a bounce and then sell that bounce by selling call spreads.


What about you? Do you have any trading plan for the bear market protecting your investments? Are you going to sell everything and stay in cash until this storm calms down or continue diligently investing?


We all want to hear your opinion on the article above:
No Comments


Posted by Martin January 16, 2016
No Comments


Why the heck are the markets tanking?


Bear market

That was a question Yahoo! has recently asked. Sometimes it really stuns me out when liberals start slowly waking up and asking such questions, which all others with common sense already knew what was happening.

Yet there is still many with the rose colored glasses on unquestionably believing everything FED and Obama’s administration is feeding them with.

At first, I wanted to answer that question why the markets are tanking. But one of the reader in the discussion responded for me. I found his answer interesting and I decided to repost it here:

It is the economy, stupid!

Jobs: There have been no private sector jobs created, but 952,000 jobs have been added to Obama’s Federal Government. Source: White House Budget.

Unemployment: The percentage of our labor force that is employed is 62.4%., meaning that 37.6% are unemployed. Source: Department of Labor

Economic Growth: Virtually non-existent. Gross Domestic Product up 0.78% (after deducting revenue from bonds purchased by the Federal Reserve Quantitative Easing Program).

Credit Rating: The first time in Americans history our credit rating was downgraded. Standard and Poor’s dropped our rating from AAA to AA+, and Moody’s followed suit. Much was based on our debt at $14.7 trillion; now at $18,923,558,492,663.

Fraser Institute of Economic Freedom, a world-recognized organization reports that in 2010 the United States ranked #2 in the world, but 5 years of Obama’s economic Socialism has caused the U.S. to fall to #16.

The Heritage Foundation, which also calculates economic freedom reports that the United States has fallen to 12th place in the world.

Debt: up $8,262,260,795, Up 77.76%, Source: US Treasury

DOW Jones: Lost 96.61% of its 2015 gains since December 24, 2015.

Household Income:

Income per Capita (in 2013 dollars):

All Races -1.18%
White -0.37%
White (non-Hispanic) 0.66%
Black -1.57%
Asian -3.90%
Hispanic -1.66%

Median Household Income:

All Races -4.56%
White -1.72%
White (non-Hispanic) -3.01%
Black -6.41%
Asian -5.07%
Hispanic -0.13%

Source: U.S. Census Bureau

Poverty: 8,644,875 citizens added to our poverty rolls, Source: US Census Bureau
18,313,000 citizens added to our food stamp rolls, Source: US Dept. of Ag.
7,668,224 citizens filed personal bankruptcy, Source: US Bankruptcy Court

Health Care: Obamacare is Socialized Medicine. It is not about health care. It is about controlling the people and forcing them to become dependent of the Federal Government. It was sold to the citizens on lies, as most have experienced increases in premium and deductible costs. There is, indeed, a “death panel.” We have seen how it has worked with the Veteran’s Administration in Phoenix, AZ in 2014, where 40 wounded veterans died because they were denied basic health care needs.

National Security: There is none. Our borders are wide open, and Homeland Security has bussed in millions. Obama has released 106,000 criminal illegal aliens from our prisons, and the number of ISIS attacks continue to increase. We also have 1.7 million citizens of the radical Middle East countries here on student visa’s whose backgrounds have never been checked, and no means of determining where they are, if they have over staid their visas or if they have connection to ISIS. We need to secure our borders immediately.

Law Enforcement: Non-existent. Obama, and his neo-Marxist Democrats make victims of the villains and villains of the victims. Obama, Holder, Sharpton, and Lynch have incited our race riots in violation of Federal Law.


Judicial System: As corrupt as the rest of the Federal Government. According to the Federal Election Commission campaign finance reports, the Judges and Attorney’s PAC has contributed $2.2 Billion dollars to Democrat politicians, a full 84% of their contributions. Democrats are willing to pass millions of laws to control the citizens, and each law makes another attorney a millionaire. The Supreme Court has been stacked with Democrats, including John Roberts, who twists the law like a thing of wax. Additionally, on two occasions in 2015 he ruled on cases that resulted in money going to his family members. In one case the amount was $250,000. His administrative staff called it “human error.” Actually it is a conflict of interest, a violation of the law, and sufficient to impeach him in accordance with Article 3, Section 1 of the Constitution. We the people must demand term limits for Judges as well as members of Congress.

Guns: Obama’s teary eyed pitch for firearm control falls short of an Academy Award. It is not about controlling guns, it is about controlling law abiding citizens, making them defenseless and unable to defend themselves against murderous illegal aliens, ISIS cell members, and, possibly, from our Federal Government.

The 2009 annual report from the Center for Disease Control shows 13,200 homicides involving firearms. It further shows 2,453,000 deaths due to alcohol and alcohol related disease, and 37,423 deaths due to alcohol related auto accidents.

Marxist despots throughout history have, upon achieving power, disarmed their citizens, and then slaughtered all that refused to accept Marxist doctrine. Lenin, Stalin, Mao, Pol Pot, and Tito combined slaughtered 88,086,000 of their citizens for that very reason.

Bill Ayers, a close, personal friend of Obama’s who introduced him into politics in Chicago, was a co-founder of the Stalinist Weather Underground, an anarchist, and a convicted cop killer. In the Preface of their revolutionary Manifesto, “Prairie Fire,” they laud Sirhan for killing Bobby Kennedy.

Ayers informed Undercover FBI Agent Larry Grathwohl the Underground was prepared to slaughter 25,000,000 Americans if they refused to bow to Communism.

Thomas Jefferson said, “No free man shall ever be debarred the use of arms. The strongest reason for the people to retain the right to keep and bear arms is, as a last resort, to protect themselves against tyranny in government.”

Global Warming: Our own NASA scientists, on December 13, 2015 stated that the France boondoggle on taxpayer dollars was the grandest fraud ever perpetrated on the citizens of the world.

Consensus is not science. But there is no consensus. Only 36% of supposed scientists believe global warming is man-made, while 64% believe it is not. That includes John Coleman of Chicago, who founded the National Weather Service.

The corrupt politicians, despots, and pseudo-scientists at the U.N. created climate science out of whole cloth. And corrupt world leaders continue to bilk the citizens of their countries. Obama and his Democrats have spent $138.2 BILLION middle class taxpayer dollars funding their friends and supporters like at Solyndra. In return millions of our tax dollars are returned to Obama and Congressional Democrats in the form of campaign contribution.

Green companies launder taxpayer dollars and turn them into cash for Democrat politicians.

It is a violation of federal racketeering law, but Democrats have never found a law they believe applies to them.

We need a Congressional investigation and demand the pseudo-scientists turn over all of their scientific data.

What do you think? Do we have a rosy economy and the current two weeks of selling is just transitory?


We all want to hear your opinion on the article above:
No Comments


Posted by Martin January 16, 2016
2 Comments


Today we created a new lower low. We are in Bear market!


The August 2015 low was the first lower low of the trend; until today.

A week ago I wrote a post saying we are in a bear market and shown a charting showing why I think so.

 
SPX trend
 

I posted the chart above in January 7th, 2016 to show and explain what lines and trend I am looking at to identify a trend. But this was not my only warning about bearish market. I was posting about my bearish outlook in December when the market failed to create new highs that we were in a bearish trend. You can read my warnings in this post and here.

But in October and November the bull market could be still saved as you can see in the above chart. The trend was recovering from the August selloff and creating healthy new higher lows. It was until FED raised rates. Then the entire story started changing.


Here is the same chart again a few weeks later proving we are in trouble and that bigger trouble is ahead of us.

 
SPX trend
 

As you can see, there are a few significant changes:

1) We created a new lower low in a longer term time frame!

This is a big issue. Before we were creating lower lows in a short term cycles basically warning about troubles. This time we are creating lower lows even in a big picture time frame.

2) More selling is coming as we are not that oversold as in August

Take a look at the circles marking the fear and greed levels of the market. Although we are creating a new lower lows in the last 9 months, we are barely in oversold territory. That means, we can go lower and more violently before we see a reversal.

3) Trend slope is sinking further down

As you may know I use 50% regression channel study in TOS to identify the trend. It is a study inbuilt in the platform and it does all the charting based on price action of the market. I do not draw those lines. It is all done automatically the same way as moving averages are drawn.

The dashed grey lines are the only lines I draw manually. The lines you can see I drew in November 2015 and haven’t touched them since then. These are the trend projections lines to help me indicate where the market is moving. I draw them exactly on top of the 50% regression channel lines so later I can see if the market is rising or declining. Since November 2015 market started declining from these lines as you can see a magenta regression lines dropping below the grey dashed lines.

This confirms that the bear trend is deepening.

However. Even in a bear market like this, we may see relief rallies. But expect those rallies to be sold off.

In all this, FED is still clueless and promising more interest rate hikes. As usually, when FED realizes that the economy is already in a recession it will be too late.

People have short memory, but you still may remember when FED and media were all optimistic about economy at the verge of the great recession in 2008 and realized how serious the problem was when we were already in a big selloff and financial houses such as Lehman Brothers admitted that they were already bankrupting.

Unfortunately, we can expect the same from FED. They are still optimistic and they will be again late to the party trying to save the economy by another set of QE as they believe that the previous QE programs worked well, so let’s start another one to save the economy and market.

They will just kick the can down the street. But this time, this medicine may no longer work. Like when you overdose a patient with antibiotics, the bacteria will become resistant to the pills.

Expect worse to come.


 · What to do as an investor?


If you are a long term investor, for example a dividend investor, do not worry, this will be over in a year or two. So invest in this slowdown. It will create opportunities and make you richer (if not outright rich). Continue investing into a good quality dividend stocks or mutual funds and you will survive well.

If you are at the end of your wealth building journey, and about to ready to retire, you should have money located more in less volatile products than stocks (unless you are in dividend stocks). Relocating or selling stocks now is probably too late and risky. You should have done this a lot earlier. You should have reallocate in October – November.

I know, providing an advice now when the damage has been already done and after the fact is not much helpful, but if I were to retire next year and my portfolio was in stocks in this market, I would waited it out and postponed the retirement by a year or two.

This is by the way one of the reasons I am learning hard trading options so I can create an income in any market and be free from stocks falling in price during sell offs. I understand, this is not for everybody. So if you do not want to trade, invest hard into dividend stocks to create a dividend income which will also be independent from the price of the stocks.

Even if my ROTH IRA dividend portfolio value drops by 50%, my dividend income will stay the same as many of my holdings are still paying and increasing the dividend (for example, check Realty Income (O) as they increased the dividend recently and the price of the stock went up while the entire market was falling apart).

In 2008 I kept my long term investments intact and invested more into the declining stocks and funds. My 401k account doubled since then thanks to adding more cash into falling stocks and reinvesting dividends and distributions. I plan on doing the same this time. If we see a recession and the market crashes, I will be investing money and reinvesting dividends.


 · What to do as a trader?


Depends what you trade. If you trade options for example, as I do, then best approach is to ride the waves and time the market. Do not listen to those who tells you it is not possible, as they do not know what I am talking about.

Last few months I learned how to read the trend. You can easily see when the market rallies and suddenly the rally is exhausted and starts falling apart. That’s the time you want to short the falling market. When the market is falling, there will be times of relief rallies. You may want to ride them and get long again. In these situations I plan on selling call spreads and bull spreads to ride the relief rallies.

Trading bullish trades in this market can be dangerous so I plan on having tight stop loss orders and try to keep those trades short term. I may even stop trading them whatsoever.

Stay save and if you are not sure about the market, its trend, or a trade, then stay away. It is better to stay aside than be in a trade at all cost. It may turn out to be your all remaining cost at the end.

Cheers!


We all want to hear your opinion on the article above:
2 Comments


Posted by Martin January 15, 2016
2 Comments


Wall Street in panic, S&P 500 plunged 3.16%


FED
(Source: Hedgeye)
 
At one point today, the S&P 500 plunged 3.16% below August 2015 lows. Wall Street is in panic selling and stop losses are now being hit.

FED is still clueless.

But do not worry. My coworkers who normally have no clue about stock market noticed this and started asking if they should sell their 401k holdings to protect themselves from selling.


We all want to hear your opinion on the article above:
2 Comments


Posted by Martin January 13, 2016
2 Comments


Selling continues towards August lows


Chinese banks saving the market

An interesting parallel to save the market.

This market is a rip for dividend investors and a nightmare for traders. All over the internet we see traders expecting bottom and bullish reversal. It is not happening and more selling is coming every day.

Pundits blame oil and China. I blame slowing economy, gloomy economic outlook, worsening earnings, coming deflation and recession around the corner. On top of that I blame FED’s mishandling of the problem since 2009. I have always criticized the policy of “too big to fail”. I disagreed with pouring millions to GM, issuing $600 dollar check to everybody, saving big banks, printing cheap money, etc. If the money was used properly I wouldn’t have problem with such approach. But stuffing money into economy where it was used to artificially boost earnings by buy backs, or invested in the stock market rather than used for economic growth was a bad idea from day one.


I expected a bounce to approx. 1960 level, to 1990 or 2000 at most. It looks like, we had a lot shallower bounce only today, just to 1953.6 and then selling resumed. And it was a free fall.

Expect more selling to come. I hope I am wrong, but now we most likely will go to 1830 level which is an August bottom. If we do not bounce at that level, then more selling will come. I started to believe that this market can really go all the way down to 1550, which is the top of the end of 2007 before the market crashed in 2008.

Do not panic if you are a dividend investor. Invest diligently even if the market crashes. Reinvest dividends and lower your cost base by investing during this selloff time. If you are a trader, short the market every time it rallies hard. I am also selling bounce rallies but they can be dangerous so watch them carefully.

Stay safe and preserve capital.


We all want to hear your opinion on the article above:
2 Comments


Posted by Martin January 10, 2016
2 Comments


What a halted commerce tells us about economy?


Commerce
Transportation sector is usually the first one which signals trouble with the market and economy overall. But transportation sector is a wide branch. So take a look at one significant portion of it – maritime transportation.

Typically, majority of goods are still transported by sea using large cargo ships and tankers. Typically, you can see a frequent transportation between Europe and the North America.

For the first time in known history, not one cargo ship is in-transit in the North Atlantic between Europe and North America. All of them (hundreds) are either anchored offshore or in-port. NOTHING is moving (source: Superstation95)

Yellen and her cohorts were convincing us for the entire 2015 that the US is doing well and that the labor market is improving, and all slowdown is transitory.

Yet there is no commerce between Europe and Americas. Only a few ships are moving overseas and most of them are empty moving to their home ports. All other ships are pinned in their ports or at coast and not moving!

 
Commerce
(All ships are at European or American ports. No cross Atlantic traffic)
 

This is very unusual and it indicates that people are not buying that our supplies are larger than we consume and that the commerce is literally at a halt. When there is no transportation on the high seas then that is an evidence that there are no raw material orders. If there are no orders there are no buyers and sellers will have to cease their operation.

This will like domino move further deeper into the economy and everything will slowly go to a stop.

Below you can see all the ships being at coasts doing nothing or just a local traffic:

 
Commerce
(Local traffic at Spanish coast)
 

Commerce
(Local traffic at English – Netherland – Norway coast)
 

Commerce
(Local traffic at Florida coast)
 

The empty Atlantic is a scary thing basically confirming that the global economy is at halt. And that the US economy will follow soon. So, do not believe our ignorant academics at FED telling you that we are in a great shape. We are not. If we ever have been in a good shape, that shape is going to turn against us soon.

Get ready for coming recession, save money, pay off your debt, invest in a good high quality dividend paying stocks for good income which can weather a recession (such as JNJ, KO, WMT, etc.). Get ready to survive what’s coming at us. If you stocks you have go down (and they will during the recession) be ready for it mentally and do not panic. It is a normal behavior. It always happen. You stay the course and if you can be buying more shares and reinvest dividends.

You can check all those charts above online at the MarineTraffic.com website. No matter how scary it looks it is quite entertaining to play with those maps and see that there is not a single ship traveling over Atlantic.


We all want to hear your opinion on the article above:
2 Comments


Posted by Martin January 10, 2016
No Comments


Is selling over? Should you trade this market?


Futures are down again at the opening. It can mean nothing yet. We can see the market improve significantly overnight and we may see a rally.

Some traders and investors are asking whether it is already time to start buying calls or selling puts. They are expecting the market to reverse. Yes we are oversold, the trend is moving down below the Bollinger Bands which means we are in a buying zone.

 
SPX
 

As you can see on the chart above, the Friday’s trading was already below the lower Bollinger Band (that tiny little line pointing down as of now). That doesn’t mean that we are done with selling. The market can stay there for a prolonged period of time. It can be there longer than we may like, then I might like and longer that we may stay solvent.

 
SPX
 

Even if selling is really at its end and we may finally see a green day as a trader I would stay away. If this is really an end, you need confirmation. We need to see that we are really at the end of selling and that bulls are willing to step in and start buying.

None of that is visible in the market. None of that is happening. We may see more selling and we may see this market to stop at 1880-ish level.

If however we draw a line connecting last August lows, we can see that we really may be seeing the end of this selling. But do not get fooled. We still need to see that bounce and confirmation that we will see a relief rally.

 
SPX
 

If you are a trader, do not jump the gun yet. It may be early and it may be costly.

If you are a long term dividend investor, it is a perfect time to start initiating new positions but do not invest all your money yet. We may see a bounce only with more selling yet to come. If that happens, you can get better prices.

Nevertheless, this is a bear market and there is nothing yet which can change it. Coming earnings season is expected to be in recession, if coming data will be worse than expected, expect more selling. Only if earnings season will come with good numbers this bear market can be stopped.


Online - H&R Block Free Edition


We all want to hear your opinion on the article above:
No Comments


Posted by Martin January 08, 2016
No Comments


Should we really blame China?


ISM
 

A few days ago the market was selling hard and media blamed China and their circuit breaker and worries over Chinese slowing economy.

Then media blamed North Korean hydrogen bomb for a selloff.

A day before yesterday, they blamed China and their circuit breakers again.

Yesterday, China removed the breaker feature and their market rallied. China finished +2.9%. Futures rallied.

This morning the US market crashed because of a good job report.

I think the slump today was due to the US economy getting into trouble and not China, oil, job report, or bad weather.


We all want to hear your opinion on the article above:
No Comments


Posted by Martin January 07, 2016
No Comments


Are you panicking yet?


Did you know that panic selling by retail investors (like you and me) is the worst thing you can ever do?

Studies prove that when a retail investor finally gives up and decides to sell his losing stock positions, it is always already late. (Source: S&P, BofA, Merrill Lynch)

 
Panic selling
 

It is the same as with other strategies. Many times you see investors and traders decide to short the market. Inexperienced traders would again have it wrong. Would you short this market now?

If you answered yes, then you are too late to the party. It is not time to be shorting the market, but sit tight, wait for a reversal and then actually buy it.


But this post is not about trading this market. It is about regular investors. It’s about you and me as a dividend investor. Not a trader.


In my previous post I wrote I was bearish. And I am bearish!


And I love to be bearish! I want this market to fall! I want my stocks to go down! I want other stocks to go down! I want more crashing prices!

Why?

Because I can buy stocks I want for less. I can accumulate stocks I already own for cheap!
 

Remember, as a dividend (income) investor you invest for income not the stock future value (growth)! As an income investor all what matters is the income your investments generate and not it’s value, growth or decline.

But even as a growth investor you are probably panicking and selling but you should not. You have one friend on your side in this market battlefield – time. If you invest into good growth companies, blue chips, you will be able to afford weathering this selling.

It is the same and even better with dividend investing. Time is on your side. You invest for next 20 years or more. And in 20 years, who will remember selling of 2016? Nobody.


We all want to hear your opinion on the article above:
No Comments


Here is why I consider this market bearish


Look at the chart. I use regression channel. It is a study provided for free in TOS. So the lines of the regression channel shown on the chart are drawn automatically by the study based on the price action of the underlying. It is as automatic as Bollinger Bands. It is expected that the price of the underlying stays within the channel. If it moves out of the channel, the longer it stays out of the channel the the most likely the trend reverses.

This happened in August 2015. The channel was trending up, but after the huge drop it started trending down as seen on the chart. So, just to clarify, those line are not drawn by me manually based on my feeling, but strictly by the study based on the price action and time frame (9 months in this case).


The idea of the Linear Regression Channel 50% is close to the Linear Regression Channel but the upper and lower lines are drawn at the distance of one, not of two, standard deviation from the Linear Regression line. By drawing two parallel lines over and under the Linear Regression line, we obtain a Linear Regression Channel 100%.
At the distance of two standard deviations over and under the Linear Regression line Parallel and equidistant lines are traced. The channel lines are located much farther from the Regression line than any of the closing prices. As far as the Regression channel is a channel for price fluctuations, the top borderline shows resistance whether the bottom channel line shows support. Price values can fall out of the channel for a while, but if the price stays out of the channel for a prolonged period of time, the trend may reverse.
Unlike Linear Regression trend line whose purpose is to show the equilibrium price Linear Regression Channels are the indicators of possible price fluctuations from the trend line.


(source: Online Trading Concepts)
 

The trend is clearly down and until the price reaches the upper regression band and stays them longer we are doomed to continue going down.
What is important now is that we moved to the lower band of the regression band and we may expect a bounce back to the mean price (also shown automatically). But, when this reversal happens I do not know as of now. We need to wait for it. There still may be more selling. But once the signal comes and the prices start going up, we will be ready to start selling put spreads.

Some say, we still may re-test August lows. So cautiousness is needed. We may have bottomed already and tomorrow we may see the reversal. Or next week. But even if we see a reversal, it still will be a bounce to the mean or even the upper regression band, but still staying inside the down-trending channel. That’s why I am bearish until the channel changes up again. Before that happens we will play the game of this channel.


We all want to hear your opinion on the article above:
No Comments


This site has been fine-tuned by 14 WordPress Tweaks