Weekly Newsletter   Challenge account   Weekly Newsletter   


Posted by Martin January 30, 2013
4 Comments


New trade – Lorillard, Inc. (LO)


Today I added Lorillard, Inc.(LO) shares into my portfolio. It pays nice dividend with 23% dividend growth, 4 year dividend increase history and 21% annual expected return growth. My calculated fair value is at 41.33 a share and Morningstar lists their fair value at 41 a share. Their analysis expect better and more aggressive growth due to menthol and flavored cigarettes market where Lorillard dominates. The only risk this company is facing is EPA menthol market regulation, which is however highly unlikely due to mainly large tax impact (10 billion in taxes) to federal budget. I liked what I could read about this company, which currently undergo a 3:1 split (which may create another capital gain potential in the long run). From the technical analysis the stock is trading bellow 200 day MA but at 50 day MA support with narrow Bollinger Bands (the price break is imminent; the only question is which direction; and I believe it will be upside).

01/30/2013 10:40:00 Bought 25 LO @ 39.64

Total shares held as of today: 25
Estimated annual dividend: $51.75
Consecutive Dividend Increase: 4 years
Dividend yield today: 5.21%
Dividend 5yr Growth: 23.33%
Dividend paid since: 2008


We all want to hear your opinion on the article above:
4 Comments


Posted by Martin January 30, 2013
No Comments


List of great high yielding dividend stocks


I was finally able to update my watch list of dividend stocks I consider worth to watch closely and potentially add to my portfolio. I had the watch list created in my Google Spreadsheet, but today I finally changed my watch list page to reflect the table. It currently shows my most recent list of great dividend payers.

The list is not a buy list however. It is a list of stocks I found on the internet or thru the screening process or even recommendations. For example my recent (as of this writing, 01/30/2013) addition to the watch list is a Morningstar web site recommendation. They published a featured stock – Corning (GLW) as a great company with maturing business and better than expected earnings. So I quickly checked the stock if it pays dividends and if so, what is the yield, dividend history, expected growth, etc.

I found that Corning pays 0.09 dividend per share which equals to 2.63% yield, the projected yield is 3.00%. The company has a 2 year history of consecutive dividend increase (which is nothing extra and not within my criteria, but interesting metric anyway). The dividend growth is at 30%, which may not be sustainable, but even if it will be slowing down over time, I am fine with it as long as the growth stays positive and above 6% in every consecutive year.

The valuation of the company is also interesting. The Morningstar lists the fair value to be $15.00 a share (the stock is currently trading at $12.00 a share). My own calculation indicates the fair value to be $18.88 a share and calculated expected annual growth at 26%. These metrics are quite impressive to me so I decided to put this stock to my watch list into a group of hot candidates for closer review before purchasing.

Similar hot candidates from my watch list currently are:

ABT
AGNC
EGAS
GD
KO
LMT
LO
NKE
NLY
NOC
PBI
RTN
TGT
TOT
UVV

Again, even though these are just “hot candidates”, they still are not a buy list, just a shortened list of stocks I want to analyze closely to decide whether to buy or not.

Check my watch list page to see the entire list of my dividend paying stocks.


We all want to hear your opinion on the article above:
No Comments


Posted by Martin January 29, 2013
2 Comments


Trade adjustment – DMD covered call repair


As I wrote in my article “My DMD covered call and fiscal cliff? my covered call against DMD may go against me. I expected that to happen if the fiscal cliff happens. Well, fiscal cliff didn’t happen (yet, and maybe won’t happen at all), nevertheless DMD is not going in my favor.

Since the covered call I opened originally became already worthless I decided to buy it back and sell a new covered call farther in time at the same strike. This trade will bring another $40 into my account and builds a cushion for further repair process if the stock remains where it is or fall even lower.

So here are the trade adjustment details:

I bought back my old February 2013 $10 strike covered call at 0.05 and paid $5 and then I sold a new May 2013 $10 call at 0.45 and received $45.

If the stock manage to raise up above 10 strike the trade will look like this:

New Expiration date: 5/18/2013
New Strike: $10
Buy Back Old Call: $0.05
Buy Back Commission: $0.02
DMD May 18 2013 10.0 Call $0.45
New Commission: $8.78
Total New Expense: $862.53
   
New Expected Option Assignment: $1000.00
Option Assignment Fee: $19.00
Expected Proceeds: $981.00
   
New Expected Net Gain: $118.47
New Expected ROI: 13.74%

If the stock won’t go up and stays at current levels or falls lower and the above sold option becomes worthless again I may buy it back and sell another covered call and this time with a lower strike. That would ensure the stock will get called away with a profit. I will however post it as it happens.

Here is the original covered call trade on DMD.


We all want to hear your opinion on the article above:
2 Comments


Posted by Martin January 28, 2013
No Comments


New trade – Targa Resources Partners LP (NGLS)


Today I realized a new purchase and added Targa Resources Partners LP into my portfolio.

01/28/2013 09:33:55 Bought 25 NGLS @ 39.56

Total shares held as of today: 25
Estimated annual dividend: $68.00
Consecutive Dividend Increase: 5 years
Dividend yield today: 6.93%
Dividend 3yr Growth: 7.00%*
Dividend paid since: 2007

* I wasn’t able to find data which would look reliable to me. I typically use two websites for this review. One was showing 30% 5yr average growth and the other N/A for that discrepancy I decided to use 3yr growth rate only.


We all want to hear your opinion on the article above:
No Comments


Posted by Martin January 27, 2013
2 Comments


Why I dumped mutual funds from my investing strategy

Why I dumped mutual funds from my investing strategy

Mutual Funds I no longer believe in mutual funds. Earlier I thought they were a great investment vehicle, because they can provide diversification. But is it really such a significant trait of the funds that it can beat mutual funds flaws?

People, those slightly informed about investing, know that generally, 95% of mutual funds do not exceed or keep up with the overall market. Ninety five per cent of fund managers lose money compared to the benchmark. Those managers are the true suckers when speaking of investing.

There are less known facts about the mutual funds, which investment salesmen, advisers, mutual fund managers (Wall Street) and Washington will never tell you. Lets take a look at a few of them.

What is your mutual fund doing with your money?

Do you know how good or bad your mutual fund is in investing your money? How do you find out? How do you want to evaluate and research the funds fundamentals to find out whether it is making you money or losing you money, whether it is a money making machine or a loser? The only way you can rely on is the past performance, but how reliable it is?

How many times you have read in the news something like “the mutual fund managers rushing into stocks to chase the performance”?
Can you tell whether your fund manager is day-trading or following a long term investing strategy to save you money?

Turn over or churn is your enemy

When I started investing I hated a strategy to buy a stock and forget about it. I wanted to get rich quick by hitting a home run. I wanted to buy a stock which would multiply tenfold and made me rich. So I was trading. I refused to acknowledge that I was acting like a sucker. And I was losing money.

Truly I did hit a few home runs. But I was so obsessed with trading that I wasn’t even able to let that winner run and I sold it prematurely. Remember Netflix when it was trading at $44 a share? I bought it at that price before it skyrocket to 300-ish levels, but sold it way before it run in there.

Six years later I must humbly admit, that this was a sucker’s game. Unfortunately there are fund managers out there who play this game today. You can refer to those funds as actively managed funds.

Of course, you can find funds known as index funds or fund tracking one of the market indexes. So you would think these have a very little churn right? No they do not. When researching it, then you find out that their turn-over is at 90% or around that number. How is that happening? Any time you or investing public puts money into the fund or redeem money from the fund the fund manager must buy or sell shares to get money for you. This contributes to the overall churn of the fund. It won’t go away, you cannot escape it. And what are the consequences? Read further.

There are two things in the world you cannot escape – death and taxes

Have you seen a movie “Meet Joe Black”? Joe Black (Brad Pit) is helping Bill Parish (Anthony Hopkins) saving his company against Drew (Jake Weber) plotting to sell Parish Communications. At the board meeting Drew states:

Drew: We all know this deal is as certain as death and taxes.
Joe Black: Death and taxes?
Drew: Yes.
Joe Black: “Death” and taxes?
Drew: Yes.
Joe Black: What an odd pairing.

You cannot escape death and you cannot escape taxes. Unlike in certain accounts where your taxes are deferred, mutual fund heavily generates them.

I said there are two things you cannot escape, but I would add a third one – fees. You may be able to defer taxes if you hold your mutual funds in your ROTH IRA or IRA or 401k accounts, but in most cases you won’t defer fees.

Compared to you as individual investor investing in individual stocks, you can almost eliminate taxes on capital gains and limit fees to a very minimum. If you buy dividend paying stocks and leave them for 30 years in your account, you will only pay a fee when originating your purchase. No more fees and taxes as long as you hold. And since you can hold literally forever because it is the dividend income, not capital gain income which interests you, you only pay taxes on your dividend income. The difference in fees and taxes between this strategy and mutual fund with 150% turnover is tremendous.

Every mutual fund collect seamlessly a variety of fees which eat up gains you may have if any at all. Regular investor usually have no clue what fees the fund charges and how they affect the performance. The funny part is that the fund usually reports its performance without discounting fees and taxes. So if you read that your mutual fund gained 13% last year you may feel like a king of the world. The reality is however far from the bright future. When the fund discounts the annual management fee (expense ratio) , marketing and distribution fee (12-b fee), redemption fees, load fees you may end up with a loss or very low profit, which will be further destroyed by taxes and inflation.

If you compare this performance with investing on your own into individual dividend paying stocks then $1000 invested for 30 years in mutual funds would translate into $13,000 compared to $63,000 when invested into individual stocks.

Is diversification, mutual funds offer, worth it? In my opinion, the answer is a resounding no.

Conclusion

Because of mediocre performance, high taxes and fees charged by mutual funds I decided not to invest into mutual funds anymore. I believe, that good quality dividend paying stocks with long history of dividend payout and great dividend growth you can perform almost fivefold better than any of the mutual fund manager can ever dream of. Unfortunately I have to have mutual funds in my 401k account, since I have no choice in our plan. That’s why I contribute only the absolute minimum to get my employer’s match. The rest goes to my individual accounts where I invest into individual stocks only (and basic option strategies).


We all want to hear your opinion on the article above:
2 Comments


Posted by Martin January 27, 2013
No Comments


My inspiration in last week #7


I often browse the internet to find ideas about investing, trading stocks, options, investing opportunities and strategies. I like to read about investors and what their investing/trading approach to create income you can live on is.

This week I found the following interesting posts:

Dividend Yield or Dividend Growth?The Dividend Guy

Dividend Yield Vs. Dividend Growth – Part 1Dividend Engineering

Dividend Yield Vs. Dividend Growth – Part 3Dividend Engineering

Dividend Growth Investing In A Bull Market Dividend Mantra


We all want to hear your opinion on the article above:
No Comments


Posted by Martin January 24, 2013
1 Comment


New trade – Ferrellgas Partners LP (FGP) put selling


FGP is one of the stocks I wish to buy and own. It is an MLP paying nice dividend and the stock is optionable. It pays 10.50% dividend as of this writing. However, the company has never increased its dividend since it started paying it in 1994. Thus I am willing to hold this stock for short period and use it for put selling and covered calls only. This stock will not be a part of my core portfolio.

So what is the game plan?

I will be selling puts against this stock as long as I get assigned. As soon as I get assigned I start selling covered calls as long as I get assigned. In the meantime I will be also collecting dividends.

I will also use this trade to learn better how to trade puts. I know this in general, but want to get better in it.

Today I sold one put contract against FGP and collected $185 premium.

01/24/2013 10:06:54 Sold 1 FGP Aug 17 2013 17.5 Put @ 1.85

If I get assigned I will have FGP for $17.5 and my cost basis will be at $15.65 (less the premium). If the stock stays above the strike price, the put expires worthless and I’ll keep the premium and repeat the process. Also if the stock manages to run up and the put becomes worthless prior to its expiration I may consider buying the put back and selling new further in time. I’ll keep posting the progress of this trade.


We all want to hear your opinion on the article above:
1 Comment


Wating for the stock can improve profits – attempting to buy NGLS

Wating for the stock can improve profits - attempting to buy NGLS

On many occasions I have read and heard dividend investors saying that it doesn’t matter much when you buy your dividend paying stock and if you invest regularly, in long term the prices will smooth into average anyway.

However I like to wait for the stock I am interested in to pull back and buy the dip even though I am buying for the long term. It’s like a game for me. I believe that no stock would ever go up in a straight line and one day pulls back.

A few days ago I wrote that the stock market is very extended and overbought and it may switch into correction any day. Thus I am in minimal buying mode and willing to buy stock which show pull back, breaking from a base, correcting no matter what the market does as long as such a pullback isn’t caused by bad fundamental data of the company.

One of the stock I wanted to buy is Targa Resources Partners LP, but when I found this stock it was already too late for me to jump into this stock. it was running up and I missed the pull back late in December 2012. Would you be chasing the stock? It was very tempting for me to jump in.

Targa resources pays nice dividend, as of this writing the yield is 6.30%. Targa Resources Partners LP provides midstream natural gas and natural gas liquid (NGL) services in the United States. The company operates in two divisions, Natural Gas Gathering and Processing, and Logistics and Marketing. Targa has recently acquired its first big foothold in the Bakken Formation in North Dakota. The pipeline operator recently raised its target for 2013 adjusted EBITDA (earnings before interest, taxes, depreciation and amortization) by 10% to 15% and kept its projections for distribution growth for 2013 over 2012 at 10% to 12%. The 5yr average dividend growth is listed at 30%, and 3yr. average at 7%. It has a history of 5 years of increasing the dividend and it pays dividends since 2007.

Targa Resources Partners LP

From the chart above, you can see the stock running up with a strong break up from 200 day MA when the company increased its dividends. In my opinion this break was weak, because of previous long run up, so I was expecting a pull back. However, I was expecting it down to 200 day MA only and not such deep fall. Although this fall can be temporary and tomorrow the stock can reverse and march up, it still can continue further down to 50 day MA.

So although the market is in Extreme Greed as per the chart at CNN Money, having a value of 92 of 100 at fear & greed index, you still can find dividend paying stocks (or wait for the stocks) at good current valuations worth buying as Dan writes on his blog.

I think NGLS is now a stock worth buying. But the price can fall even further. Today’s price action can spark even more selling and profit taking. For that reason I am entering a contingency order to buy 25 shares of NGLS if the stock reverses and goes higher than $39.84 a share. If this doesn’t happen and the stock continues falling, the order will not execute and tomorrow I will move my buy order limit lower based on tomorrow’s new closing price. That will ensure that I will not buy on daily volatility, but when the stock reverses. This of course is not a bulletproof strategy of entering the position, but worked for me in many occasions.


We all want to hear your opinion on the article above:
No Comments


Posted by Martin January 23, 2013
No Comments


Closing trade – PIMCO All Asset All Authority Fund Class D (PAUDX)


Originally my plan was to use non transaction mutual funds (NTF) as a savings vehicle. You can save a small amount of money without paying any commission or fees and as long as you save enough to buy the stock, sell the fund and buy the stock. I was looking for the fund which can provide some growth, is relatively cheap (low expense ratio), has nice yield and is free to buy. PIMCO All Asset All Authority Fund Class D (PAUDX) was a good choice.

But not anymore. I no longer like this approach – saving cash in a fund, then sell and buy a stock. The reasons for that are that you had to hold the NTFs for at least 180 days or you would be charged a redemption fee $49. The growth of the fund is questionable and the expense ration is now 2%. I think I can keep ETFs doing the same job for cheaper, or wait a bit with cash and then buy dividend stocks outright.

So I decided to close this position and use the money later buying a dividend paying stock – either adding a new position or adding to any of my existing positions.


We all want to hear your opinion on the article above:
No Comments


Posted by Martin January 23, 2013
6 Comments


Do you have your cash ready for market pullback?

Do you have your cash ready for market pullback?

In my previous article I advocated for keeping cash in my account for potential purchases when opportunities show up.

The principle I was looking at is save cash in the account during market upward run, minimize buying, only when a stock you are interested in shows you an excellent buying opportunity such as a dip (make sure the dip is not caused by a fundamental problem, but by big investors pushing the stock down to shake off retail investors, for example) or the stock currently trading at the support level, breaking from the base etc,.

When the market starts falling, then that will be my time to start looking for stocks on sale and use accumulated cash for buying. But do not use all of your cash all at once. Split your purchases in smaller lots. I use $800 or purchase lot.

Market direction

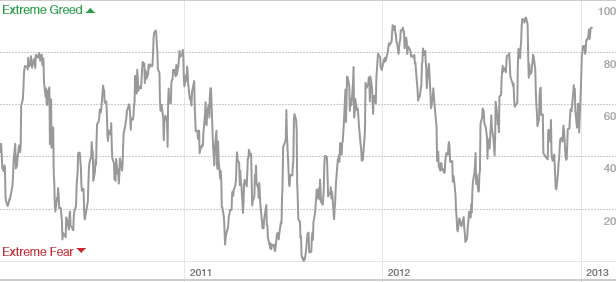
Looking at the market, we can still see a positive trend, but currently the market is extremely overbought.

Fear & Greed

I mentioned in my previous article that I like to use Fear & Greed indicator (see above) to get a quick sense of where the market is. You can find that chart at Money CNN website. Today, the chart indicates “Extreme Greed” and the value at 90, which is the same value as one year ago. And the similar value as two years ago.

If we assume that the market moves in cycles, we may expect a repetition in future. The future may look like the one at the beginning of 2012 with a slightly prolonged period of time hanging at those elevated levels, or in the middle of 2012 with sharper correction. The fact is, the market will not stay at these levels for ever and will correct or pull back.

The pullback may look like the end of 2010, relatively shallow one, but it will be there. It will happen.

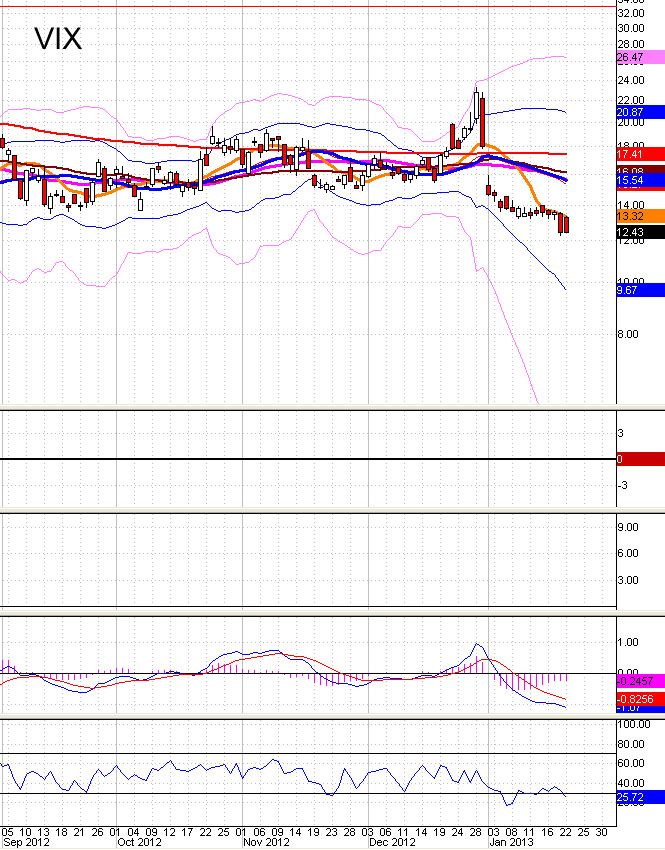
Well, let’s take a look at VIX (volatility index) which I also look at when trying to find out what’s going on with the overall market.

VIX

The VIX index is currently at 12.43 level. When was the last time you saw the index that low?

Well, I save your time and tell you. In 2006 – 2007 period before the market crash in 2008 (by that, I do not want to imply that the market will crash). Look at the oscillators. Both, the Ultimate Oscillator and MACD are in oversold territory (but MACD is not indicating reversal yet).

However, This doesn’t mean, that the market will fail tomorrow and start falling like a rock. It looks like there is still a lot of capital flowing from bonds to stocks and we still may see a long period of market going up and up and up like without the end. When you take a look at intraday charts, you can see that the investors are picking up every dip which occurs and buying stocks. That indicates there is still a lot of money.

What to do?

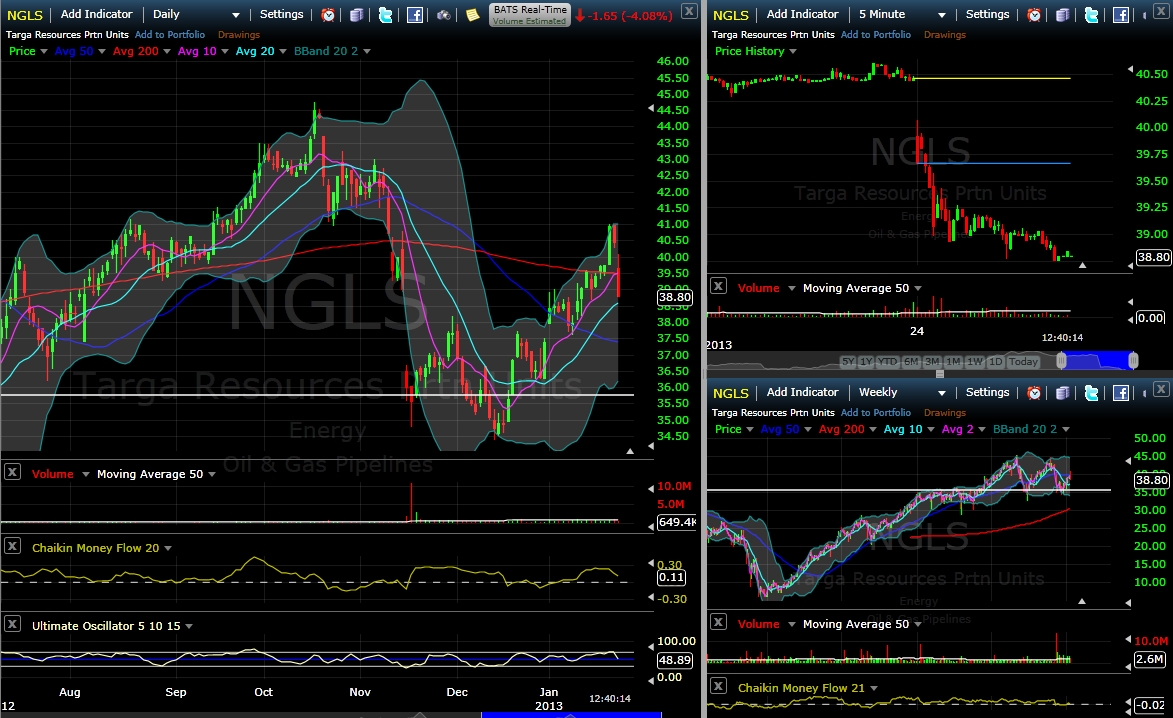
Do you want to chase this market? All stocks I wanted to buy were following the overall market’s trend and they are overextended.

NGLS – dramatic break thru above 200 day MA. Great sign, but extended almost 10% above 50 day MA. The stock may correct this extended run back to 50 day and continue back up. Indicators are in overbought territory and slowing down.

PSEC – steady uptrend without a rest. Indicators slowing down dramatically, MACD showing a crossover and moving into negative territory. Ultimate Oscillator is already negative (but still close to overbought and heading down). Stock extended 6% above 50 day MA.

FGP – a parabolic run up, hitting upper Bollinger Band, reaching November 2012 major pivot point (top) or resistance, we may expect the stock to bounce off of it down before it breaks up. Ultimate Oscillator in overbought, MACD just crossed into a positive territory as well as Chaikin Money Flow indicator (which I also use). So this stock doesn’t look that bad, but signals are mixed to make a decision.

Do you want to start shorting the market (if it is your trading philosophy)? I wouldn’t do it either, although there is a growing number of traders who are moving to the bear side of the market out there.

However, I am still saving cash, because I believe, based on what I see on the charts (and I like it, because I can see nice capital gains), that this market is due for correction. It can be a small one, just down to 1450 level (SPX) or 1430 or even 1400. And that will be a great opportunity, to add more shares to my portfolio.

Why buying now, when the prices are high, when I can be comfortably saving cash (which I have to do anyway) and as soon as the market starts correcting start picking up those sweet cherries on the top of the cake instead of buying now and when the correction begins ride it and sitting on losing stocks for who knows how long. And honestly, I hate seeing my account with too many red numbers in it.

Happy Trading!


We all want to hear your opinion on the article above:
6 Comments


This site has been fine-tuned by 14 WordPress Tweaks