Weekly Newsletter   Challenge account   Weekly Newsletter   


Cognizant Technology Solutions Corporation A (CTSH) above a buy point

Cognizant Technology Solutions Corporation A  (CTSH) above a buy point

Cognizant Technology Solutions Corporation A (CTSH) an Indian IT services company seems to be on its move. It showed up on my screener list as well as in IBD 100 list creating new highs and broke up from a flat base recently. It is a large growth (16 billion) stock and it seems to have a momentum for further growth.

I checked how the stock is trending:

CTSH

A one year chart shows that the stock is in a very strong uptrend which is positive. The stock is a trending stock. The 3 year chart confirms that trend. We can see a choppy downturn during recession period, but that can be ignored as it will be seen on 5 year trend:

CTSH

Five year trend shows that the stock has been trending prior the downturn and it resumed the trend when the overall trend of the market returned north.

CTSH

So the stock is a trending stock. Let’s take a look at fundamental evaluation:

  2009 2008 2007  
Revenue $3,278(m) $2,816(m) $2,135(m) Pass

  2009 2008 2007  
EPS 1.78 1.44 1.15 Pass

  2009 2008 2007  
ROE 20% 22% 24% Fail

Analyst recommendation: strong buy Pass

  12/09 09/09 06/09 03/09  
EPS Surprise +2.40% +9.76% +25.67% +1.88% Pass

  2014 2013 2012 2011 2010
EPS Forecast 3.26 2.85 2.76 2.31 2.07 Pass

EPS Growth Rate (next 5 years) 20.0% Pass

PEG 1.21 Fail

EPS / Industry (TTM) 16.16% 48.7% Fail

Short Interest 1.7 days Pass

Insider Form 4 -181,986 Fail

Weighted Alpha +118.70 Pass

So far the stock has received 8 point out of 12 available. That means that the stock DIDN’T PASS through my fundamental evaluation, so I am not continuing in further evaluations. Originally I was thinking to be lenient on PEG, which seems to be quite low, but such a large negative insider activity prevents me from further evaluating of the stock or being lenient in regards loosing some rules.

The next stock I wish to look at is Atheros Communications (ATHR)


We all want to hear your opinion on the article above:
No Comments


Medifast (MED) shows great results and trading setup.

Medifast (MED) shows great results and trading setup.

Next stock which showed in my trading screener list is Medifast (MED). I added it to my watch list and performed my analysis and it passed my screener, trending and fundamental criteria.

As for the trending, the stock started its move up basically two years ago, in June 2009 and since then it ran up almost to $40 per share. I made quite a good money riding this stock. However during January 2010 correction the stock pulled back with, as IBD says, “absurdly deep cup” and it is running back up.

The company shows excellent performance and I wonder what power slashed this stock so deep because fundamentally there was no reason for it.

See the daily chart:

MED

From the three year chart it is obvious that the stock broke from its base and since then it has been trending up:

MED

I ran my fundamental check with the following results (data are retrieved from EDGAR unless noted otherwise):

  2009 2008 2007  
Revenue $45,005(t) $27,281(t) $21,845(t) pass

Because the last quarter data weren’t complete, I was comparing the last known quarters. But even with incomplete last quarter the company is already beating revenue of the previous years easily.

  2009 2008 2007  
EPS 0.23 0.11 0.07 pass

  2008 2007 2006  
ROE 14% 12% 18% pass

Available data weren’t complete, so I was comparing older numbers and reviewed other sources for 2009 & 2010. The most actual number I could get for ROE was 28.22%, while industry is only 7.89%. With that in mind I am assigning a “pass” mark to this criterion.

Analyst recommendation: strong buy pass

  12/09 09/09 06/09 03/09  
EPS Surprise +41.67% +11.11 +21.05% +10.53% pass

The company consistently beat EPS forecast last year and it is expected to do so this year. The 1st Quarter earnings is supposed to be released on May 5th.

  2012 2011 2010  
EPS Forecast 1.76 1.55 1.17 pass

EPS Growth Rate (next 5 years) 25% pass

source: Yahoo.com

PEG 1.45 failed

source: TD Ameritrade

EPS / Industry (TTM) 137.70% 100.79% pass

source: TD Ameritrade

Short Interest 3.4 days failed

Insider Form 4 +7,660 pass

Insiders are buying !! Total trades in last 3 months was 13 and in last year 34 with positive number.

Weighted Alpha +337.4 pass

Another great number indicating strong price move over the years.

The stock received 10 points out of 12 available which makes it a very strong candidate to buy.

However, there are two reasons, why I am not going to buy right now. The stock seems to be forming a cup with handle pattern right now:

MED

It would pay to wait what the price will be doing in a couple of weeks prior buying. Also when I checked a weekly chart, it also shows a possible overbought reversal, so the price may actually drop. The earnings expectation until May 5th may sink the price and create a handle of the cup. If the earnings will be positive and better than expected, that may be the break out.

The second reason is that when I was calculating my risk I wasn’t able to meet my buying criteria. With the price of the stock at $29.89, ATR Value at 1.25 and total risk per the entire portfolio at 2% I could buy only 22 shares. That would still account to $657.58 trade size which is below my required $800 minimum limit and still my total capital exposure will rise to 10.66% which is a way too lot above 6% limit.
Since my total portfolio liquidation value to existing stops will be at $2,013.69 (above $2,000 limit) and this stock shows really strong momentum, it is #2 on IBD 100 list, etc, I may consider a variance for the rules and accept higher risk for this trade. But I really have to think about it.


We all want to hear your opinion on the article above:
No Comments


Ansys (ANSS) evaluation


In my previous post I tried to describe how I evaluate stocks which I am going to buy. First I was looking at Stryker Corporation (SYK), but further evaluation disappointed me so I decided not to buy yet. The next stock I liked was Ansys (ANSS). My first criteria is that the stock must be in my screener list, then I look at the chart to see if the stock is trending. I look at 1 year chart, 3 year (or 2 year) chart and then to 5 year chart. If on both charts you can identify strong uptrends I then continue with evaluation or drop the stock and do not bother anymore. Ansys passed all these first screening criteria and now is time to take a look at fundamentals.

I want to buy an aggressive fundamentally strong companies which have great potential for doubling or tripling their value. However these stocks are naturally more volatile and sort of dangerous to trade. So a good money management with defined stop protection is crucial. To eliminate stocks which are just a pure pump & dump stocks I want to be sure that such a company is making money; that I am not looking at any sort of phantom stock with virtual value. The only way how I can be sure is to look at some fundamental numbers. I look at 14 financial ratios and key number and try to decide whether it is good or what I am looking for or not. It is not an easy job and I am not an expert in it, but at least I try and make sure I did all I could.

Also all those fundamentals I am reviewing do not guarantee that the stock will perform well or even exceeds all my expectations. But at least I know that the stock has a high probability to grow and I am more confident holding the stock during corrections.

First I take a look at 12 criteria to see whether to continue with others or not.
The very first ratio I look at is revenue. I think, there is no need to explain this. If the company is not making money, I do not bother buying it. I want to see the revenue growing every year, so I take a look at last three known years (if the last year is not known yet I compare last three known quarters):

  2009 2008 2007  
Revenue $516,885(t) $478,339(t) $385,340(t) pass

The stock passed. Every year the company increased its revenue.

Next I check its EPS. I want to see grow in every year:

  2009 2008 2007  
EPS 1.27 1.29 1.02 fail

EPS in 2009 was lower than in 2008, the stock didn’t pass.

Here are the next criteria I typically look at:

  2009 2008 2007  
ROE 9% 9% 13% fail

Analyst recommendation = should be buy or better. This stock fails. You may say that opinion of analysts may be irrelevant and they may be wrong. That’s true and they may be wrong, but 12 independent analyst ca create some consensus and today’s Wall Street is obsessed with analysts and every a bit piece of bad or good news may trigger a large move of the stock. I do not want to go against the crowd. I want the crowd to ride my profit.

Next number I look at is EPS surprise which has to be positive in every reported period. That means that the stock had to exceed analyst expectations. Those number are what provide fuel to the further growth of the stock. Ansys passes this criteria:

  Quarter End Surprise %
  Dec 2009 8.38
  Sep 2009 8.96
  Jun 2009 18.78
  Mar 2009 2.49

Next number I want to see is the EPS forecast and it should be positive and higher every following year. This company meets such criteria.

Then I check what is the EPS long term growth. It should be more than 10%. This company indicates 20%, so it exceeds my criteria twice.

Then I want to see how expensive the stock is, what premium I will pay by buying this stock. I check its PEG and it should be at 1 or less. This company doesn’t meet this criteria. It’s number at 1.87 exceeds my criteria. The expected 5 year trailing PEG is 1.27, so I assign “fail” to this criteria.

Next I check EPS growth of the stock with industry. The stock has a ratio 7.68% while the industry 16.04%, so the stock is not a leader in the industry.

Next criteria I look at is short interest. I want to know how long it would take to cover all short positions (assuming that I will trade the stock long). I want the coverage to be at 2 days or less. This number basically tells me how confident bulls are vs bears. The higher the number the more bears are selling the stock and it will most likely be falling in price. This stock has more than 5 days to cover, so it fails.

Next number I check is what insiders are doing. From the Form 4 I can see selling. Sometimes it doesn’t have to be as negative as it looks, but with this stock it may be a warning. This stock fails.

The last number I look at is Weighted Alpha. That tells me whether the stock price has growing or falling tendency over the time based on its current price and its movement. Ansys passes this criteria.

Overall this stock received 5 points out of 12 possible. That means I do not have to bother with further review because I am not satisfied with such results and I am not buying this stock.
If the stock ranked high (such as DeVry (DV) did recently) I would then calculate my risk, gain expectation, position size and look at the chart again to identify my entry point. But since I am not satisfied with the results of this stock I am not going to waste my time by reviewing it more.

The next stocks which were in my list and which I will review using the same approach are:

BIOS, PLCE, & CTSH (I will follow with this last one first, since it ranked really high). But I will write about it more later.
Happy trading.


We all want to hear your opinion on the article above:
No Comments


Posted by MartZee April 13, 2010
No Comments


DeVry (DV) regains its strength

DeVry (DV) regains its strength

DeVry (DV) gapped up today on the positive news. It is confirming its volatile attitude and strong growth type of stock. The strong uptrend remains intact driven up by institutional money and positive outlook of educational stocks although with some caution and good stop management in place. Today all educational companies rose after improved rating from analysts. First Oppenheimer changed its target price up to $75 per share and today Credit Suisse AG increased their rating to outperform and raised the target price to $75 too.

DeVry

If you are thinking of buying this stock, I would however wait for couple of days for the next development. The stock is now hyped up and tomorrow it may tend to go to close the gap and may fall down. I would like to see a confirmation of this break out. I would place a buy order a few ticks above today’s price high and lower it every day with the stock. if it continues falling and close the gap on high volume I wouldn’t buy, but if it turns back up, the stock should pick you up on its way up and provide you with some lift. Well, this is at least what I would do here.

DeVry

I am still watching Stryker Corporation (SYK) and as of today, it is down about 1%. I am planning on using similar strategy as what I said above in regards to DV. I will be trailing the buy order down with the stock price as long as the buy set up continues. The fair value of the stock seems to be at $72 a share so the stock has a potential for growth.


We all want to hear your opinion on the article above:
No Comments


Stryker Corporation (SYK)

Stryker Corporation  (SYK)

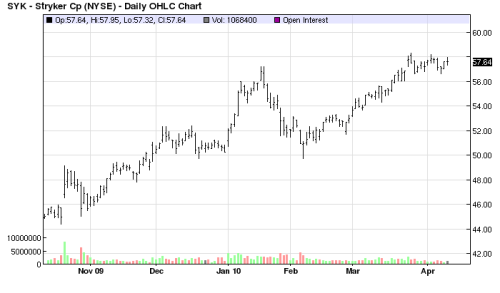
Stryker Corporation (SYK) is once again on my buy list with a target price at $70 per share. I reviewed the trend of the stock and the only thing which I do not like so far is that the stock was growing in price on drying volume.

SYK

So I decided to watch this stock for couple of days to see where the stock will go next. I also run my position sizing and risk control calculation with the following results:

With the buy price at $58.00 per share, total risk per the portfolio at 2% I can buy 37 shares. However that would increase my total exposure to the entire portfolio to 8.64% per this trade and this is what I am not willing to accept. So if I buy 17 shares only, my trade size still will be above $800 per trade and my total risk per trade will be less than 6% (5.95% to be exact) and this meets all my criteria for opening a new position. I will risk roughly $50 on this trade only and that is acceptable for me.

I am not buying yet, just adding this stock to my watch list to see what the next movement will look like. I would like to avoid a similar mistake I did with DeVry (DV) where I overlooked the price – volume behavior of the stock and had to be watching the stock falling down just right after I bought it.

When speaking about DeVry, I am still quite confident about this stock, since it still presents strong fundamental values, it broke up through 2-year resistance, so this pullback may actually be a great opportunity to either buy or add DeVry to your portfolio.


We all want to hear your opinion on the article above:
No Comments


This site has been fine-tuned by 14 WordPress Tweaks