Weekly Newsletter   Challenge account   Weekly Newsletter   


Posted by Martin February 01, 2023
No Comments


Technical view: Icahn Enterprises L.P. (IEP)


Technical view
 

IEP is in stage #2. The stock started declining as is typical but then reversed, possibly on the news that Carl Icahn reached the deal with Crown Holdings to add the activist investor’s members to the Crown’s board. The weekly chart shows a sideways pattern.

 
Technical view weekly
 

The company’s revenue is erratic but improving since 2020. If it keeps going higher, it may have a positive impact on the stock pushing the price higher:

 
Technical view weekly
 

Free cash flow is also choppy which may explain the stock price choppiness:

 
Technical view weekly
 

But the company has more cash in hand to pay its $7 billion debt (despite the recent cash decline, possibly resulting from the recent acquisitions).

 
Technical view weekly
 

The stock is more like a bond. It pays a great dividend but offers very little growth. This lack of growth is possibly a result of stock dilution that is extremely high. So, buying this company is for income than appreciation. In this case, I want to be buying at lower prices in the price cyclical decline.

 
Technical view weekly
 

Technical view weekly
 

The stock is now HOLD
 

This post was published in our newsletter to our subscribers on Sunday, January 28th, 2023. If you want to learn more about our stock technical analysis subscribe to our weekly newsletter.


We all want to hear your opinion on the article above:
No Comments


Posted by Martin February 01, 2023
No Comments


01.31.2023 – TUESDAY MARKET OUTLOOK


Market Outlook
 

The market reversed yesterday’s and today’s losses as the economic data showed weakness. Consumer confidence also dropped. We are in an environment where bad data are good news. This gave investors hope that the FED will not be aggressive anymore and raises the rates by 0.25 points as is widely expected. In the end, the markets finished up 1.46%

 
Market Outlook
 

This is good for this new bull market. It continues improving providing more and more bullish odds to the market’s narrative. The Ichimoku chart below is full-blown bullish now. We still may see a pullback as the cloud is narrow (we want it wide, and we want the market ideally to hug it, not run away from it).

 
Market Outlook
 

The market pretty much acted as forecasted. We went down and then recovered (as forecasted). The only difference was that the recovery was stronger than expected. But that is not that important. What matters is the trend so we can position our trades accordingly. And this trend is improving so far.
Tomorrow, we will have the FOMC interest rate hike announcement, and after that Powell will be speaking. That will provide a lot of volatility to the markets. It is a wild card so far. Generally, I expect that Powell will do as expected and the markets will go higher.

 
Market Outlook
 

If you want to learn more about our SPX weekly analysis, subscribe to our weekly newsletter.


We all want to hear your opinion on the article above:
No Comments


Posted by Martin January 31, 2023
No Comments


01.30.2023 – MONDAY MARKET OUTLOOK


Market Outlook
 

Abysmal day at Wall Street today. The markets started selling off before even opening and there was only a small attempt to recover in the middle of the day, but then we sold off again. But the markets do not go straight up. It goes in waves and after last week’s strong rally, we ran into significant resistance. It was obvious that we will pull back. One day of selling is not a deal breaker. It would be if it continues.

 
Market Outlook
 

The longer-term outlook is bullish (by a longer-term I mean a bit longer than a mid-term but not as long as long-term… I know…silly). This means we will most likely continue trying to break above the resistance and rally a bit before we see a bigger pullback or even another 50% retracement. But if this outlook fails (for example the FED screws the markets up again this week, we will fall like a rock instead).

 
Market Outlook
 

The Ichimoku chart improved better than it was last week. We now have all three bullish checkboxes marked. That means, if we clear the hurdles in front of us, we may expect a nice bullish move.
Today’s move didn’t follow the pattern, so let’s see if tomorrow will be any better. Tomorrow, we should see selling continue, but we may see some early bounce to recover the losses from today. We may also see the beginning of the FED meeting rally when investors will be rushing into the market prior to the FED’s announcement and selling afterward. We could go up to the POC of the weekly volume profile and bounce down from there. The price is below VWAP so I would expect selling to continue.

 
Market Outlook
 

If you want to learn more about our SPX weekly analysis, subscribe to our weekly newsletter.


We all want to hear your opinion on the article above:
No Comments


Posted by Martin January 29, 2023
No Comments


January 2023 $100 Challenge account review


We were selling spreads successfully last month, but we entered a TSLA call spread right before investors started chasing the stock up again. We are now rolling the trade higher, and hopefully, we will be able to get out of the trade. I think a 70%+ run-up is not justified, and we may see a pullback. But in the meantime, there will be many investors and believers sucked into this stock which may prop it further up before it reverses and tanks.

Besides that, our Challenge account continues grinding higher, and as the market stabilizes, I expect it to improve more.
 

Accumulation phase

 
The account is still underperforming our goal but started growing again. We are investing in stocks of our interest and building equity positions. We also started selling Iron Condors and spreads. We got rid of QYLD stock, and we will no longer invest in this ETF as its performance is terrible, and its dividend income doesn’t look as enticing as it looks on paper. We want a stable company that provides some price appreciation and dividend growth. So we replaced QYLD with MAIN.
 

January 2023 Challenge account review


MONTH GOAL $$ ACTUAL $$
December 2021: $821.00 $802.08
January 2022: $924.00 $594.29
February 2022: $1,027.00 $283.87
March 2022: $1,130.00 $301.74
April 2022: $1,233.00 $350.56
May 2022: $1,336.00 $428.82
June 2022: $1,439.00 $459.70
July 2022: $1,542.00 $641.27
August 2022: $1,645.00 $653.32
September 2022: $1,748.00 $617.92
October 2022: $1,851.00 $829.46
November 2022: $1,954.00 $1,003.01
December 2022: $2,057.00 $1,152.65
January 2023: $2,160.00 $1,221.22


$100 Challenge account review

 
From the chart above, the red dot (line) indicates the current account value, compared to the blue line (plan). Our account is underperforming our goal. But I expect this to improve with the market. We will keep buying assets and monetize them once we accumulate enough shares.
 

January 2023 Overall Challenge account review

 
The chart below indicates our account value compared to the overall goal and plans to grow the $100 investment into a $75,000 portfolio. As of today, we are still at the beginning of our journey.

YEAR CONTRIBUTIONS $$ GOAL $$ ACTUAL $$
Year 0: $100.00 $100.00 $100.00
Year 1: $1,300.00 $1,336.00 $459.70
Year 2: $2,500.00 $3,016.96 $1,221.22
Year 3: $3,700.00 $5,303.07  
Year 4: $4,900.00 $8,412.17  
Year 5: $6,100.00 $12,640.55  
Year 6: $7,300.00 $18,391.15  
Year 7: $8,500.00 $26,211.96  
Year 8: $9,700.00 $36,848.27  
Year 9: $10,900.00 $51,313.64  
Year 10: $12,100.00 $70,986.56  


$100 Challenge account review goal


January 2023 Challenge account Income


Total Invested in Stocks $1,173.64
Stocks Unrealized Profit -$69.87
Stocks Realized Profit -$57.18
Strangles Income -$1,316.00
Spreads Income $543.00
Dividends Income $44.14
Deposits Total (lifetime) $2,100.00
Cash $581.70
Net-Liq $1,221.22


If you want to see what investments we take and what trades and strategies we will use to grow this small account, join our program today and grow your money. We engage in safe investments, select strategies to maximize winning trades, and grow our portfolio. And you can do it too, today! We do not provide quick rich promises, gambling, or reckless strategies. We want our portfolio to grow steadily and preserve our capital while maximizing returns.
 

As a member, you will have access to the following features:


We all want to hear your opinion on the article above:
No Comments


Posted by Martin January 28, 2023
No Comments


January 2023 SPX put credit spreads trading review


The last trading month was rolling trades and adjusting the old ones only. We were not opening any new trades at this point. We had many trades that we rolled, and we do not want to add more risk until the old trades are fixed. We use “box” spreads to collect credit and use that credit to offset the debit trades. Usually, one box trade allows us to adjust two to three old trades.
 

In January 2023, our trading delivered a gain of $2,476.00. Our account was up by 6.00% while SPX gained 4.51%.
 

Our SPX account is up +1,115.67% since the beginning of this program, and we have $41,681 in unrealized gains.


Initial SPX trade set ups


I dedicated a $3,600 initial amount that will be used to trade SPX PCS strategy per week. Today, the account is up at $43,763.95. However, due to the recent bear market, many trades are still open, and the funds are tied to those open trades. The trades need to expire or be closed for a profit to release the funds.
 

Our SPX strategy is designed as directional options trading. We are selling credit put spreads to collect premiums, and hopefully, these spreads expire worthlessly, or we repurchase them for a small debit.

We use a set of indicators, trend prediction (primarily based on moving averages, volume profiles, and trend forecasting), and market sentiment that generates bullish signals. The trading is based on a “trend-following strategy.” We open the trade if we have a bullish signal and a bullish trend. If we do not have a signal, we stay away. We also trade credit call spreads when we have bearish signals. In a choppy market, we stay away from or trade very short expirations (usually 1 or 2 days or up to 7 days), but the trading is muted as we need a trending market.

Unfortunately, today, the market is headline sensitive and can gap in either direction to fail and reverse. It is not easy to trade and not get whipsawed. That’s why we are managing our older trades and not opening new ones until we see a clear market direction.
 

Here you can see all our 2023 trades:

 
SPX PCS account value
Click on the picture above to see the entire list.
 

Last month trading


Overall, the strategy resulted in a +1115.67% gain last month.
 

Initial account value (since inception: 12/07/2021): $3,600.00
Last month beginning value: $41,567.95
Last month ending value: $43,763.95 (+6.00%; total: +1,115.67%)
The highest capital requirements to trade this strategy: $19,995
Current capital at risk: -$17,681
Unrealized Gain: $41,681 (-235.74%)
Realized Gain: -$933 (5.27%)
Total Gain: $40,748 (-230.47%)
Win Ratio: 41%
Average Winner: $449
Average Loser: $356

As you can see, our account currently shows a realized loss of -$933, but we have $41,681 unrealized gains.


SPX PCS account value
 

SPX PCS account vs SPX
SPX PCS account vs SPX index net liq
 

SPX PCS account vs SPX
SPX PCS account vs SPX index
 

If you want to receive trade alerts whenever we open a new SPX put credit spread or a hedge trade, you can subscribe to our service:


Note that if you wish to subscribe to multiple levels, you can only subscribe to one level and send us an email that you want to be added to other levels.

Also, if you like this report, hit the like button so I know there is enough audience wanting to see this type of report. If you have any questions or want to see anything else about my SPX trading, do not hesitate to contact me or comment in the comments section. Thank you!


We all want to hear your opinion on the article above:
No Comments


Posted by Martin January 28, 2023
No Comments


January 2023 Investing and Trading Report


I decided to post my monthly investing and trading reports instead of weekly ones. It is too much time-consuming writing about my investments every week, mainly when I also write a newsletter and do research for it. That takes a lot of time.

January 2023 was a good month when our portfolio recovered many 2022 losses. In January 2023, we are up 19.58%, and our overall loss decreased to -28.86% (from January 2022 peak). Our stock holdings increased significantly, and our options income erased previous early losses (incurred by rolling our trades). Our Net-liq grew by 12.36% in January, our options income finished from -$1,487 at $1,466, our dividend income was in line with our plan, and we received $407 in dividends. Given the market conditions, I think this is a spectacular result.

Our NetLiq-cash-buying power ratio improved with the market, but it is still vulnerable to market declines. I need to build more cash reserves.

 
Cash - Net-Liq - BP 01
 

Our trading delivered $2,953.00 gain last week, ending January 2023, at $1,466.00 (1.97%) of options income. Our net-liq value increased by +12.36% to $74,446.65 value. Our overall account is up 19.58% YTD and -28.86% from when the bear market started in January 2022.
 

Here is our investing and trading report:


Account Value: $74,446.65 +$9,204.70 +12.36%
Options trading results
Options Premiums Received: +$2,953.00
01 January 2023 Options: +$1,466.00 +1.97%
Options Premiums YTD: +$1,466.00 +1.97%
Dividend income results
Dividends Received: +$325.61
01 January 2023 Dividends: +$407.13
Dividends YTD: +$407.13
Portfolio Equity
Portfolio Equity: $192,888.86 +$17,843.95 +10.19%
Portfolio metrics
Portfolio Yield: 5.33%
Portfolio Dividend Growth: 15.73%
Ann. Div Income & YOC in 10 yrs: $127,453.90 62.05%
Ann. Div Income & YOC in 20 yrs: $25,927,526.43 12,622.91%
Ann. Div Income & YOC in 25 yrs: $3,759,296,201.36 1,830,226.56%
Ann. Div Income & YOC in 30 yrs: $5,928,391,657,607.50 2,886,258,300.06%
Portfolio Alpha: -3.32%
Sharpe Ratio: 5.58 EXCELLENT
Portfolio Weighted Beta: 0.47
CAGR: 259.46%
AROC: 1.40%
TROC: 2.37%
Our 2023 Goal
2023 Dividend Goal: $8,000.00 5.09% In Progress
2023 Options Income Goal: $70,000 2.09% In Progress
2023 Portfolio Value Goal: $96,532.51 77.12% In Progress
6-year Portfolio Value Goal: $175,000.00 42.54% In Progress
10-year Portfolio Value Goal: $1,000,000.00 7.44% In Progress


Dividend Investing and Trading Report


In January 2023 we have received $325.61 in dividends bringing our dividend income at $407.13.

We did not purchase any dividend stock this month.

Here is a chart of our account equity showing our accumulation goal and the value of all stocks in our account. It shows a nice upward-sloping chart as our equities grow. This is a result of our options trading and using premiums to buy dividend stocks:

 
Account Equity January 2023
 

And here you can see the dividend income those equities pay us every year:

 
Annual Dividend Payout January 2023


Growth stocks Investing and Trading Report


In January 2023, we bought the following growth stocks and funds:
 

  • 50 shares of AMZN @ $97.39
     
    It was a repurchase of shares we bought earlier in 2022, but we had to sell them to release buying power. We will be repurchasing other companies such as Google or Netflix (maybe) to get our portfolio back to the “base core holdings.”


Options Investing and Trading Report


In January 2023, our options trading delivered a gain of $2,953.00 making our January options income $1,466.00. This is a promising outcome for our trading, and I hope it will continue this way for the rest of the year.


We were actively trading our SPX strategy that delivered $2,476.00 gain.


Expected Future Dividend Income


We received $325.61 in dividends last month. Our portfolio currently yields 5.33% at $74,446.65 market value.

Our projected annual dividend income in 10 years is $127,453.90, but that projection is if we do absolutely nothing and let our positions grow without adding new positions or reinvesting the dividends.

We are also set to receive a $7,137.45 annual dividend income ($594.79 monthly income). We are 5.60% of our 10 year goal of $127,453.90 dividend income.

 
Future Divi on YOC week 01
 

The chart above shows how our future dividend income is based on the future yield on cost and what dividend income we may expect. The expected dividend growth depends on what stocks we add to our portfolio and the stocks’ 3 years’ average dividend growth rate. It is interesting to see what passive income we may enjoy 10, 20, 25, or 30 years from now.


Market value of our holdings


Our non-adjusted stock holdings market value increased from $175,044.91 to $192,888.86 last month.

In 2023 we planned on accumulating dividend stocks, monetizing these positions, HFEA strategy, and SPX trading. We plan to raise more of our holdings to 100 shares to sell covered calls. We continued rebalancing our options trades that released buying power significantly. That allowed us to start repurchasing shares of our interest.

 
Stock holdings trading week 01
 

We aim to accumulate 100 shares of dividend growth stocks we like and then start selling covered calls or strangles around those positions. We also planned on reinvesting all dividends back into those holdings.


Investing and trading ROI


Our options trading delivered a 1.97% monthly ROI in January 2023, totaling a 1.97% ROI YTD. We plan to exceed our 45% annual revenue goal in selling options against dividend stocks.

Our entire account is still down -28.86% from when the bear market started. However, in 2023 our account is up 19.58% YTD.

Our trading averaged $1,466.00 per month this year. If this trend continues, we will make $17,592.00 in trading options in 2023. As of today, we have made $1,466.00 in trading options. This is below our projected goal. Based on the goal, we should average $5,834 options income per month. But I hope, as the year progresses, we can increase options income to our goal.


Old SPX trades repair


We traded our SPX put credit spread strategy, which you will be able to review in in our next post. The SPX strategy provided $2,476.00 income (6.00%) while SPX delivered 4.51%.


Investing and trading report in charts


Account Net-Liq


TW Account trading Net-Liq week 01
 

The drawdown of our account is highly discouraging, but it started improving. I am not selling any stock positions, and I will be buying back those I sold to release our Buying power. On top of that, I will be buying more dividend-paying shares as much as possible. My new addition to the watchlist is Arbor Realty Trust, Inc. (ABR) which I plan on purchasing next week.


Account Stocks holding


TW Account holdings week 01
 

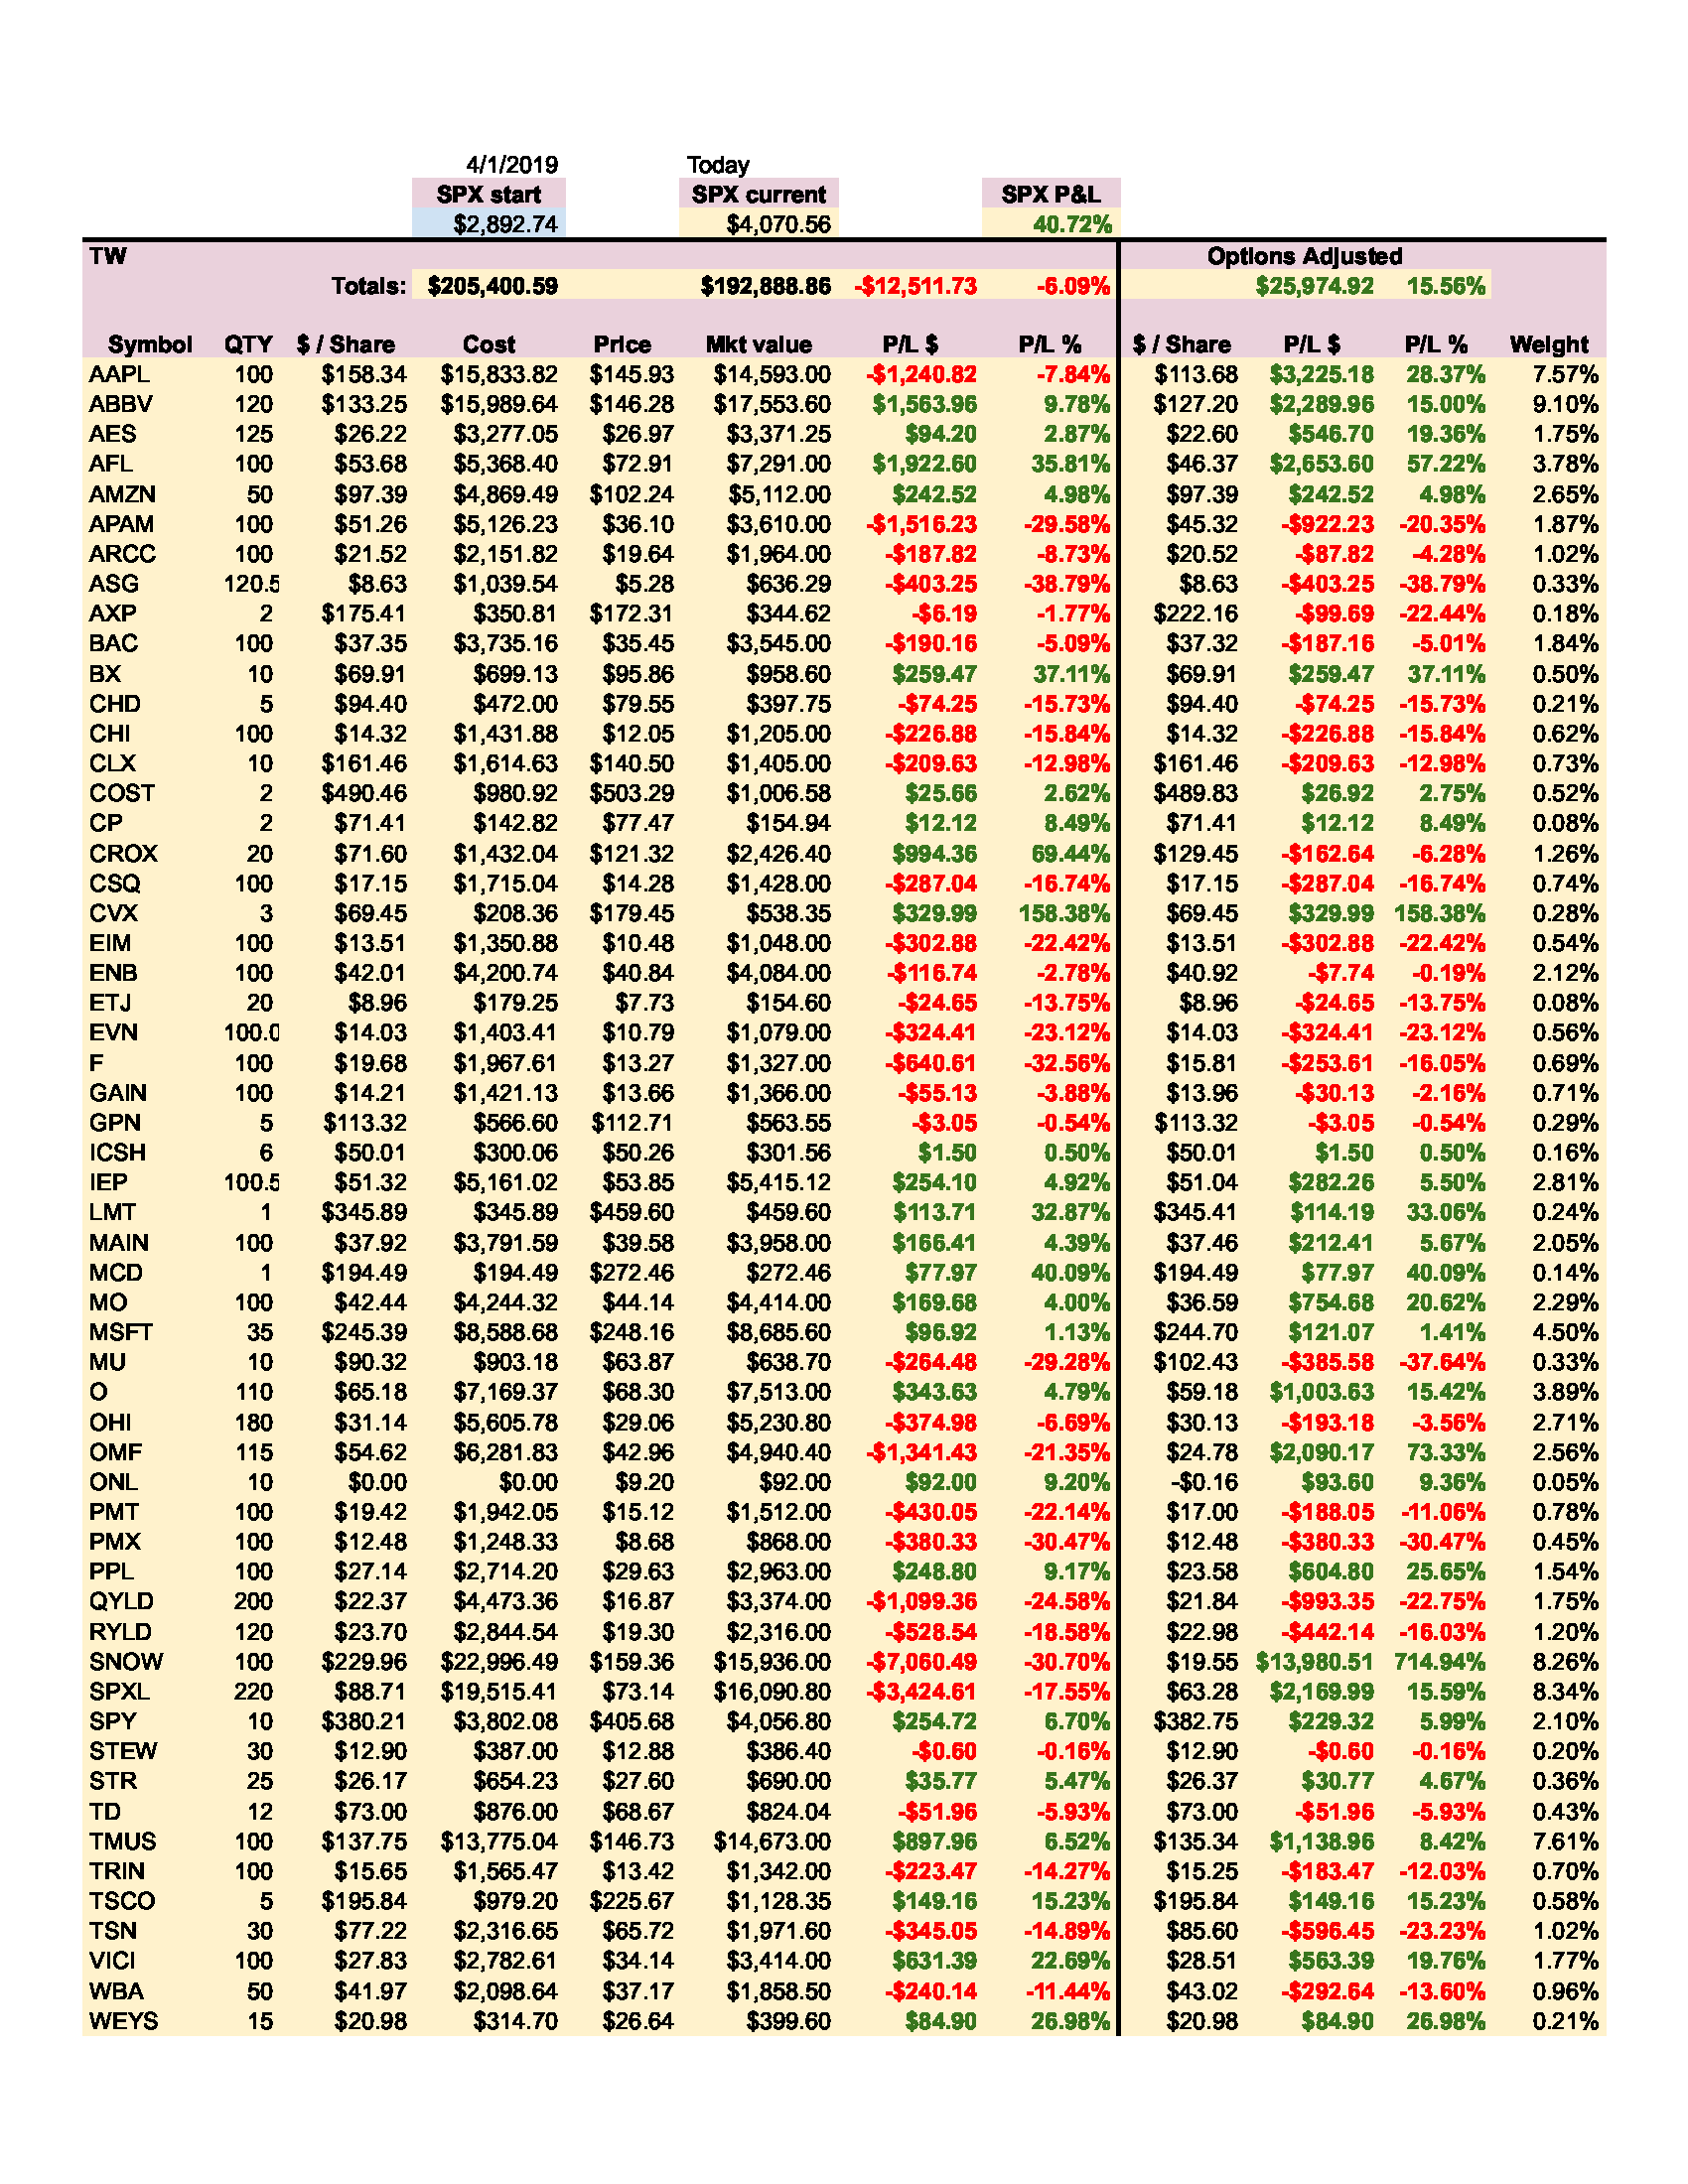
Last week, S&P 500 grew 40.72% since we opened our portfolio while our portfolio grew 15.56%. On YTD basis, the S&P 500 grew 7.99% and our portfolio 6.08%. We are underperforming the market.

The numbers above apply to our stock holdings only.


Stock holdings Growth YTD


TW Account holdings Growth YTD
 

Our stock holdings are underperforming the market. Hopefully, this trend will stay, and we will constantly do better than S&P 500.

Our 10-year goal is to grow this account to $1,000,000.00 value in ten years. We are in year two, and we accomplished 7.44% of that goal.

Our 6-year goal is to reach $175,000 account value to be eligible for portfolio margin (PM), and today we accomplished 42.54% of that goal.

Our 2023 year goal is to grow this account to a $96,532.51, and today we accomplished 77.12% of this goal.


Investing and Trading Report – Options Monthly Income


TW Options Trading Income week 01
 

Investing and Trading Report – Options Annual Income


TW Options Annual Trading Income week 01


Our dividend goal and future dividends


TW Received vs Projected Dividends week 01
 

We planned to make $8,000.00 in dividend income in 2023. As of today, we received $407.13. This week, we completed our 2023 dividend goal. We also accumulated enough shares to start making $7,137.45 a year. Our monthly projected dividend income is $594.79, and our current monthly dividend income is $33.93.

 
TW Received vs Future monthly Dividends 01


I have a favor to ask. If you like this report, please, hit the like like button button, so I know that there is enough audience that like this content. Also, if there is something you want to know or you want me to change this report to a different format, let me know in the comments section.


We all want to hear your opinion on the article above:
No Comments


Posted by Martin January 27, 2023
No Comments


01.26.2023 – THURSDAY MARKET OUTLOOK


Market Outlook
 

Another day of investors chasing stocks they were selling just a few days ago and that they will probably start rapidly selling as soon as someone like the FED spooks them again. We rallied toward the target price at 4,050 (we reached 4,061), and now we are near the upper-level target at 4,100. There is still a possibility of a retreat unless the traders get crazy, as they did in 2021.

 
Market Outlook
 

We are currently sitting at the downward sloping trend, so we have work to do. And be careful; we are also creating a double top (near-term). So we are at a resistance, possibly double top… a lot of hurdles to overcome.

 
Market Outlook
 

No changes in the Ichimoku chart. Same view, the same possible issues.
The forecast predicts the market going higher. The only caveat could be tomorrow’s PCE report which may send the market deep down, but I do not expect it. I think the PCE will indicate prices cooling off, and the investors may take it as a potential for the FED to pivot.

 
Market Outlook
 

If you want to learn more about our SPX weekly analysis, subscribe to our weekly newsletter.


We all want to hear your opinion on the article above:
No Comments


Posted by Martin January 26, 2023
No Comments


01.25.2023 – WEDNESDAY MARKET OUTLOOK


Market Outlook
 

And here we go again. Investors cannot make up their minds. One day they were frantically buying because semiconductors were reporting good numbers. Today, they were scared because Microsoft reported terrible numbers, and tomorrow, they will be optimistic again because other companies like TSLA reported good numbers. But this is typical. What was good yesterday is not good today, but it will be good tomorrow. We need to find trading out of this frantic range, or we get whipped out. In the morning, we sold off hard. As good earnings news was coming in, the market recovered all losses; well, almost all losses.

 
Market Outlook
 

That is good for the market trend, though. But we still have a big resistance in front of us. We still have the downward-sloping trendline we are about to break if we break it. It can be an extreme resistance to break. It sits in the 4,055 area. And then, ultimately, in the 4,107 level (the previous high from October’s lows). The Ichimoku chart is still the same. It is bullish but confirms that we are facing some possible weaknesses. The price can continue to increase (the best way), but there is currently a large gap. In a solid bullish market, this wouldn’t be a concern. But we have an emotional, weak trend with many investors freaking out about the recession. So there is a good possibility that the market would go lower to close the gap. Then, it may bounce on the top of the cloud and continue higher (the better way), or if fear and recession prevail, it will smash through the cloud and head lower (the worst way).

 
Market Outlook
 

This time, I think the trend forecasting will be accurate tomorrow. Today, the market sold off but recovered (it was not supposed to happen). Tomorrow, we will probably rally from the get-go (as investors are optimistic about Microsoft and Tesla, but we have too many outs out there (the fear is still more prominent than the good news), so in the end, we may see some selling before the PCE report coming out on Friday. I expect the market to go to the 4,050 – 4,100 level and then retreat again. It may evolve tomorrow and on Friday or next week as the market is still sideways moving.

 
Market Outlook
 

If you want to learn more about our SPX weekly analysis, subscribe to our weekly newsletter.


We all want to hear your opinion on the article above:
No Comments


Posted by Martin January 25, 2023
No Comments


01.24.2023 – TUESDAY MARKET OUTLOOK


Market Outlook
 

After a big jump on Monday, the market acted as expected and retreated back closer to the 4,000 level. Futures are already down and below that level. There was very little to no news for the pop-up on Monday, so it could be expected that today, the market will retreat. But there was no news for this retreat either, so it was purely technical (and possibly emotional) trading.

 
Market Outlook
 

We may expect this to continue tomorrow, too, that the market will go lower, but if there are no catalysts, the market will tend to go higher overall. The ichimoku chart below is still looking good but showing weakness again. The size and shape of the cloud are concerning. It may drag the market lower (which, so far, the trend forecasting indicates to happen) if it spooks enough of the fragile investors. The futures are already dragging the market down. Will it be a blip or a reversal?

 
Market Outlook
 

Tomorrow, the trend will be lower if the forecast plays out. The black dash line is 2022 year major point of volume, so it is quite natural that the markets may struggle here, and prices will be bouncing around this level for a while until either bulls or bears take full control.

 
Market Outlook
 

If you want to learn more about our SPX weekly analysis, subscribe to our weekly newsletter.


We all want to hear your opinion on the article above:
No Comments


Posted by Martin January 25, 2023
No Comments


Technical view: Occidental Petroleum Corporation (OXY)


Technical view
 

OXY is in stage #3. It bounced off its support at $62 a share and now going higher. It is also sitting at the 50-day MA support (on the daily and weekly chart). It may continue going higher until $73 level again.

 
Technical view weekly
 

Technical view weekly
 

Based on the valuation of the company trading significantly below its fair value, the stock still may go higher, but I do not expect it. The fair value in 2022 was estimated at $148 a share, and the stock failed to reach it. The 2023 fair value is calculated at $111 a share and earnings are expected to be dropping in 2023 (-33%), 2024 (-21%), and 2025 (-18%). With declining oil prices, declining earnings, and fair value estimates, I expect the stock to start declining too.
 

Technical view weekly
 

The stock is now SELL
 

This post was published in our newsletter to our subscribers on Sunday, January 20th, 2023. If you want to learn more about our stock technical analysis subscribe to our weekly newsletter.


We all want to hear your opinion on the article above:
No Comments


This site has been fine-tuned by 14 WordPress Tweaks