Our trading and investing last week went smoothly again. We opened a few credit spreads, and all expired out of the money. But as the market crumbled last week, I closed a few high-flying stock positions like Amazon or Netflix. I did it to protect my net liq and am ready to buy back when the market improves. I do not mind buying at a higher price (it will still be way lower than what the stock price will be ten years from now). I sold to prevent margin calls. Suppose the market and these stocks continue lower; great. If not, my margin will improve, and I will buy back.
This is what I am talking about. Our NetLiq-cash-buying power ratio is a shit show, and I hate it. As you can see below, my cash balance increased significantly, yet my buying power and net-liq are dropping:

Our trading delivered $1,526.00 premiums last week, ending December 2022, at $2,844.00 (4.75%) options income. Our net-liq value decreased by -4.90% to $59,871.06 value. That is still a terrible result. I do not understand it anymore. I have defined risk option trades. These shall have no impact on the net-Liq. I have a few strangles. Yes, these can impact the net-liq, but I have only a few trades with long expiration, so they are not that sensitive. This is insane. Our overall account is now down -42.79% YTD.
Here is our investing and trading report:
| Account Value: |
$59,871.06 |
-$2,934.91 |
-4.90% |
| Options trading results |
| Options Premiums Received: |
$1,526.00 |
|
|
| 01 January 2022 Options: |
+$8,885.00 |
+8.36% |
|
| 02 February 2022 Options: |
+$10,009.00 |
+10.34% |
|
| 03 March 2022 Options: |
-$1,662.00 |
-1.47% |
|
| 04 April 2022 Options: |
+$1,047.00 |
+1.19% |
|
| 05 May 2022 Options: |
+$8,604.00 |
+11.32% |
|
| 06 June 2022 Options: |
+$9,691.00 |
+13.73% |
|
| 07 July 2022 Options: |
+$8,717.00 |
+11.39% |
|
| 08 August 2022 Options: |
+$7,987.00 |
+12.15% |
|
| 09 September 2022 Options: |
+$2,997.00 |
+5.76% |
|
| 10 October 2022 Options: |
+$3,979.00 |
+6.36% |
|
| 11 November 2022 Options: |
+$3,555.00 |
+5.26% |
|
| 12 December 2022 Options: |
+$2,844.00 |
+4.75% |
|
| Options Premiums YTD: |
+$66,653.00 |
+111.33% |
|
| Dividend income results |
| Dividends Received: |
$105.46 |
|
|
| 01 January 2022 Dividends: |
$303.38 |
|
|
| 02 February 2022 Dividends: |
$732.81 |
|
|
| 03 March 2022 Dividends: |
$393.74 |
|
|
| 04 April 2022 Dividends: |
$337.31 |
|
|
| 05 May 2022 Dividends: |
$343.99 |
|
|
| 06 June 2022 Dividends: |
$445.80 |
|
|
| 07 July 2022 Dividends: |
$367.66 |
|
|
| 08 August 2022 Dividends: |
$683.58 |
|
|
| 09 September 2022 Dividends: |
$555.20 |
|
|
| 10 October 2022 Dividends: |
$359.89 |
|
|
| 11 November 2022 Dividends: |
$723.16 |
|
|
| 12 December 2022 Dividends: |
$262.80 |
|
|
| Dividends YTD: |
$5,509.32 |
|
|
| Portfolio Equity |
| Portfolio Equity: |
$179,213.34 |
-$11,590.78 |
-6.07% |
| Portfolio metrics |
| Portfolio Yield: |
5.64% |
|
|
| Portfolio Dividend Growth: |
15.73% |
|
|
| Ann. Div Income & YOC in 10 yrs: |
$139,447.10 |
69.41% |
|
| Ann. Div Income & YOC in 20 yrs: |
$34,068,990.47 |
16,958.50% |
|
| Ann. Div Income & YOC in 25 yrs: |
$5,825,331,514.93 |
2,899,671.88% |
|
| Ann. Div Income & YOC in 30 yrs: |
$11,343,861,943,535.20 |
5,646,627,555.16% |
|
| Portfolio Alpha: |
106.21% |
|
|
| Sharpe Ratio: |
8.80 |
EXCELLENT |
|
| Portfolio Weighted Beta: |
0.45 |
|
|
| CAGR: |
252.35% |
|
|
| AROC: |
70.52% |
|
|
| TROC: |
5.39% |
|
|
| Our 2022 Goal |
| 2022 Dividend Goal: |
$4,800.00 |
114.78% |
COMPLETED |
| 2022 Portfolio Value Goal: |
$151,638.03 |
39.48% |
In Progress |
| 6-year Portfolio Value Goal: |
$175,000.00 |
34.21% |
In Progress |
| 10-year Portfolio Value Goal: |
$1,000,000.00 |
5.99% |
In Progress |
Dividend Investing and Trading Report
Last week we have received $105.46 in dividends bringing our December’s dividend income at $262.80.
Last week, we did not purchase any dividend stock.
Here is a chart of our account equity showing our accumulation goal and the value of all stocks in our account. It shows a nice upward-sloping chart as our equities grow. This is a result of our options trading and using premiums to buy dividend stocks:

And here you can see the dividend income those equities pay us every year:

Growth stocks Investing and Trading Report
Last week, we bought the following growth stocks and funds:
- 10 shares of SPXL @ $64.77
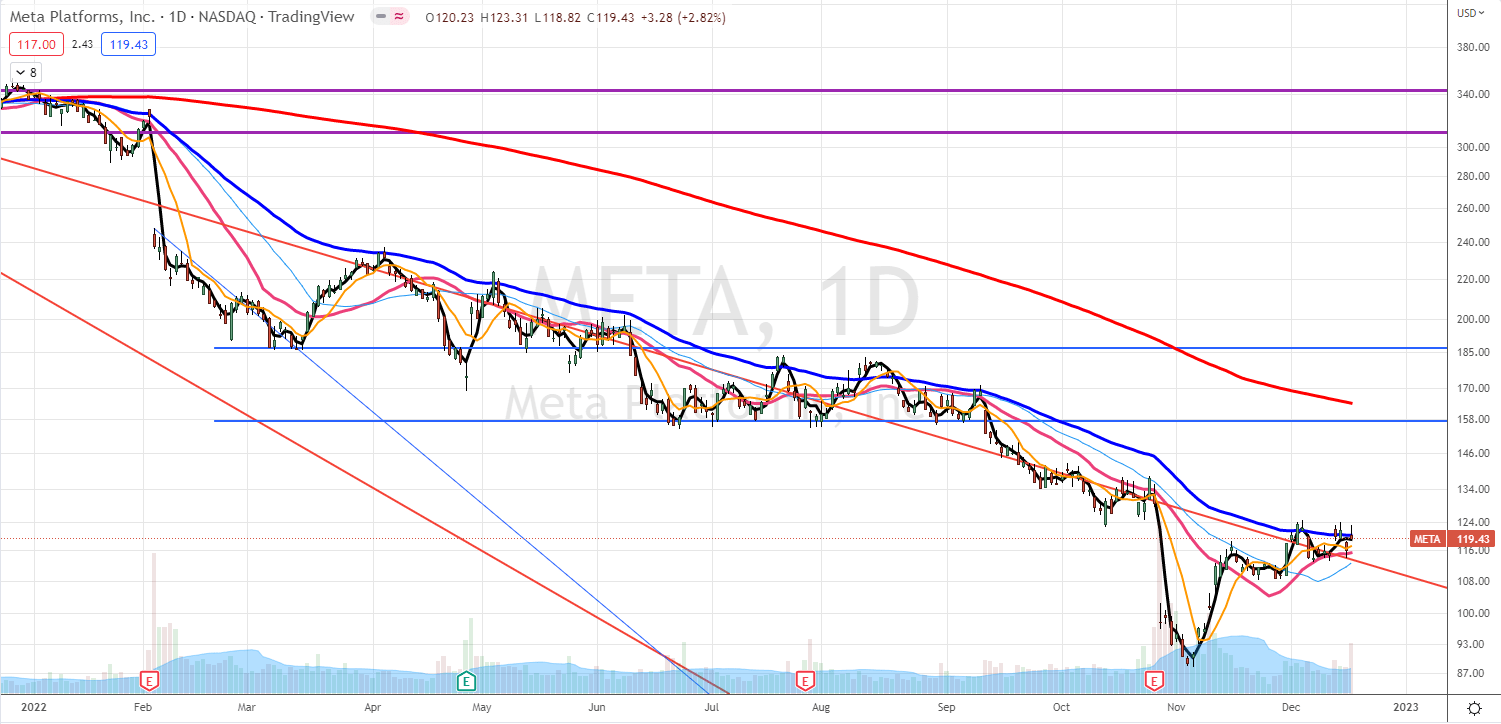
I temporarily sold AMZN and NFLX, but I will repurchase these shares as soon as my net-liq improves. I also sold out shares of Tesla. I do not plan on repurchasing these shares back.
Options Investing and Trading Report
Last week options trading delivered a gain of $1,526.00 making our December options income $2,844.00.
We were actively trading our SPX strategy that delivered +$2,560.00 gain.
Expected Future Dividend Income
We received $105.46 in dividends last week. Our portfolio currently yields 5.64% at $59,871.06 market value.
Our projected annual dividend income in 10 years is $139,447.10, but that projection is if we do absolutely nothing and let our positions grow without adding new positions or reinvesting the dividends.
We are also set to receive a $7,126.91 annual dividend income ($593.91 monthly income). We are 5.11% of our 10 year goal of $139,447.10 dividend income.

The chart above shows how our future dividend income is based on the future yield on cost and what dividend income we may expect. The expected dividend growth depends on what stocks we add to our portfolio and the stocks’ 3 years average dividend growth rate. It is interesting to see what passive income we may enjoy 10, 20, 25, or 30 years from now.
Market value of our holdings
Our non-adjusted stock holdings market value decreased from $190,804.12 to $179,213.34 last week.
In 2022 we plan on accumulating dividend stocks, monetizing these positions, HFEA strategy, and SPX trading. We plan to raise more of our holdings to 100 shares to sell covered calls. We continued rebalancing our options trades that released buying power significantly. That allowed us to start repurchasing shares of our interest.

We aim to accumulate 100 shares of dividend growth stocks we like and then start selling covered calls or strangles around those positions. We also planned on reinvesting all dividends back into those holdings.
Investing and trading ROI
Our options trading delivered a 4.75% monthly ROI in December 2022, totaling a 111.33% ROI YTD. We will exceed our 45% annual revenue goal in selling options against dividend stocks.
Our entire account is still down -42.79%.
Our options trading averaged $5,554.42 per month this year. If this trend continues, we will make $66,653.00 in trading options in 2022. As of today, we have made $66,653.00 trading options.
Old SPX trades repair
We traded our SPX put credit spread strategy, which you will be able to review in my next report. The SPX strategy has held well so far, and our signals kept us from opening new aggressive trades.
Investing and trading report in charts
Account Net-Liq

This drawdown of our account is highly discouraging. It’s like all previous gains were all wiped out. But this is just a temporary drawdown. Despite the losses, I am not selling any stock positions (except strategically sold Amazon and Netflix, which I will buy back). I will keep buying more shares if possible. I also have realized losses in my options trades. I am rolling those trades to keep them alive and adjusting them slowly, one by one, until they expire as winners. Then, this terribly-looking chart improves. It will be a long process to get back up, but I am determined.
Account Stocks holding

Last week, S&P 500 grew 33.17% since we opened our portfolio while our portfolio grew 10.22%. On YTD basis, the S&P 500 fell -31.59% and our portfolio -19.55%%. We are outperforming the market.
The numbers above apply to our stock holdings only.
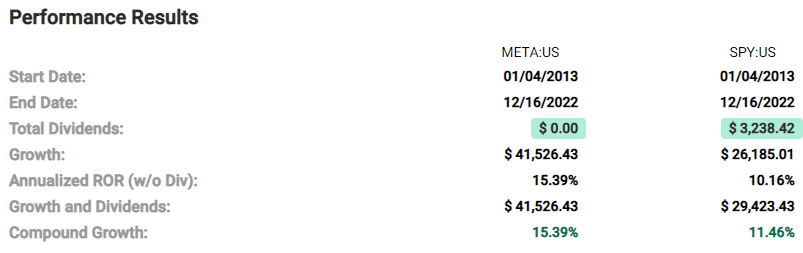
Stock holdings Growth YTD

Our stock holdings outperform the market. Hopefully, this trend will stay, and we will constantly do better than S&P 500.
Our 10-year goal is to grow this account to $1,000,000.00 value in ten years. We are in year two, and we accomplished 5.99% of that goal.
Our 6-year goal is to reach $175,000 account value to be eligible for portfolio margin (PM), and today we accomplished 34.21% of that goal.
Our 2022 year goal is to grow this account to a $151,638.03, and today we accomplished 39.48% of this goal.
I am afraid our account is no longer on track to accomplish our 2022 year goal. We may achieve our dividend and options income goals, but our account balance (Net-Liq) will be down significantly. Of course, if the market finally rallies by the end of the year, it may all change, but if not, we will fail.
Investing and Trading Report – Options Monthly Income

Investing and Trading Report – Options Annual Income

Our dividend goal and future dividends

We planned to make $4,800.00 in dividend income in 2022. As of today, we received $5,509.32. This week, we completed our 2022 dividend goal. We also accumulated enough shares to start making $7,126.91 a year. Our monthly projected dividend income is $593.91, and our current monthly dividend income is $459.11.

I have a favor to ask. If you like this report, please, hit the like  button, so I know that there is enough audience that like this content. Also, if there is something you want to know or you want me to change this report to a different format, let me know in the comments section.
We all want to hear your opinion on the article above:
No Comments |


Recent Comments