Last week I didn’t trade SPX much, just tried to stay afloat. I mostly rolled the trades away and created box trades. That is a trade where a short call has the same strike as the long put and the short put has the same strike as the long call. This way the structure resembles a box. Now when it looks like the market finally found a bottom and may go higher again, my goal will be to adjust those trades and get rid of them. Will the market go higher? I believe so. And I do not care what the doom and gloom predictors say. They are wrong. We are not heading into a recession and the inflation is already going lower.
Our strategy works and we could deliver $90 income this week. That brought our account up by +0.88% while SPX gained +6.58%.
Overall, the SPX account is up +187.28% since the beginning of this program, and we have $8,585 in unrealized gains.
We also had a trade that expired in the money (tomorrow) that we didn’t offset by a new box. We will do that next week, though.
Initial trade set ups
For my SPX strategy, I dedicated a $3,600 initial amount that will be used to trade SPX PCS strategy per week. If this amount is depleted, I will evaluate the strategy to determine whether to continue or change it. If I grow this amount, I will scale up the trading.
| WHAT WILL WE TRADE? | ||
|---|---|---|
| DAY | DTE | TYPE |
| MONDAY | 7 DTE & 40 delta | 10 wide Put Credit Spread |
| TUESDAY | 30 DTE & 40 delta | 10 wide Put Credit Spread |
| WEDNESDAY | 7 DTE & 40 delta | 10 wide Put Credit Spread |
| FRIDAY | 60 DTE & 14 delta | 10 wide Put Credit Spread |
| EVERY MONTH | 120 DTE | Put Debit Spread – HEDGE |
Our SPX strategy is designed as a directional options trading. We are selling credit put spreads to collect premiums and hopefully, these spreads expire worthlessly or we buy them back for a small debit.
We use a set of indicators (mostly based on moving averages) and market sentiment that generates bullish signals. The trading is based on a “trend following strategy”. If we have a bullish signal and bullish trend, we open the trade. If we do not have a signal, we stay away.
We set the set of rules and alerts and backtested them. The backtesting software proved that the strategy was viable and returned good gains. We also tried to automate the decision-making as much as possible to have the trading as mechanical as possible. This helps eliminate our emotions. The decision-making was reduced to: “bullish signal present” – open a trade, “not present” – stay away. it worked well.
Then 2022 year came and put this strategy to a hard test in the violent market. The signals worked well, but we had old trades that got busted and didn’t have time to perform. So I had to evaluate the strategy. The original strategy was based on letting the trade expire in the money and take a loss. But I didn’t like it. I tested an option of rolling the trade rather than letting it be and I feel a lot more comfortable with that.
Rolling a trade is still a losing trade because we close the old trade for a loss and open a new trade for a credit that partially offsets the loss. We also add a credit call spread or widen the put spread to get more credit. I believe by managing these trades and offsetting them with an opposite, adjusted, or new trade will result in fewer losses and larger gains. And so far, this strategy works.
Here you can see all our trades:
![]()
Click on the picture above to see the entire list.
We do not trade 0 DTE trades. This strategy is designed to be as passive as possible. You open a trade and let it run. You do not need to be glued to the computer all the time. The strategy takes advantage of the market’s historical behavior of going mostly up. Yes, there will be selloffs and corrections, even bear markets but over time, it goes up. And therefore our strategy is designed for this direction. The premise is, that if we have a bullish trend, we open a bullish spread and let it run. 80% or 90% of the time, it will be a winning trade. And if the trend is strong, we even open more aggressive trades (which is not the case today due to the market’s correction).
How much money you can trade?
As you can see in the table below, the highest amount of cash to trade this strategy is $19,995.00. That will allow for all adjustments, rolls, and comfortable trading without blowing your account. Can you trade less? Well, yes, I started with a $3,600 initial amount. But you need to be selective. You won’t trade all trades. You just trade the safest trades only (which is the Friday trade), especially in this market and when the market gets out of this mess you can start adding trades. And you do not compound. You must wait for the original trade to end before opening a new trade. This way the growth will be a lot slower and you collect less credit but you do not blow your account, mainly when you need to roll and you do not have money to do that (as the old busted trade will need more buying power which can be reduced by adding an offsetting trade that neutralizes the old trade, but you still will need that initial buying power).
Last week trading
Overall, the strategy resulted in a +187.28% gain last week.
| Initial account value (since inception: 12/07/2021): | $3,600.00 |
| Last week beginning value: | $10,251.95 |
| Last week ending value: | $10,341.95 (+0.88%; total: +187.28%) |
| The highest capital requirements to trade this strategy: | $19,995 |
| Current capital at risk: | $18,205 |
| Unrealized Gain: | $8,585 (+47.16%) |
| Realized Gain: | -$828 (-4.55%) |
| Total Gain: | $7,757 (+42.61%) |
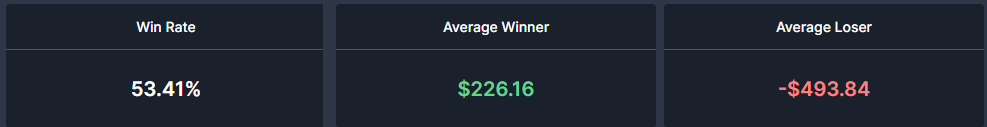
| Win Ratio: | 64% |
| Average Winner: | $254 |
| Average Loser: | $463 |

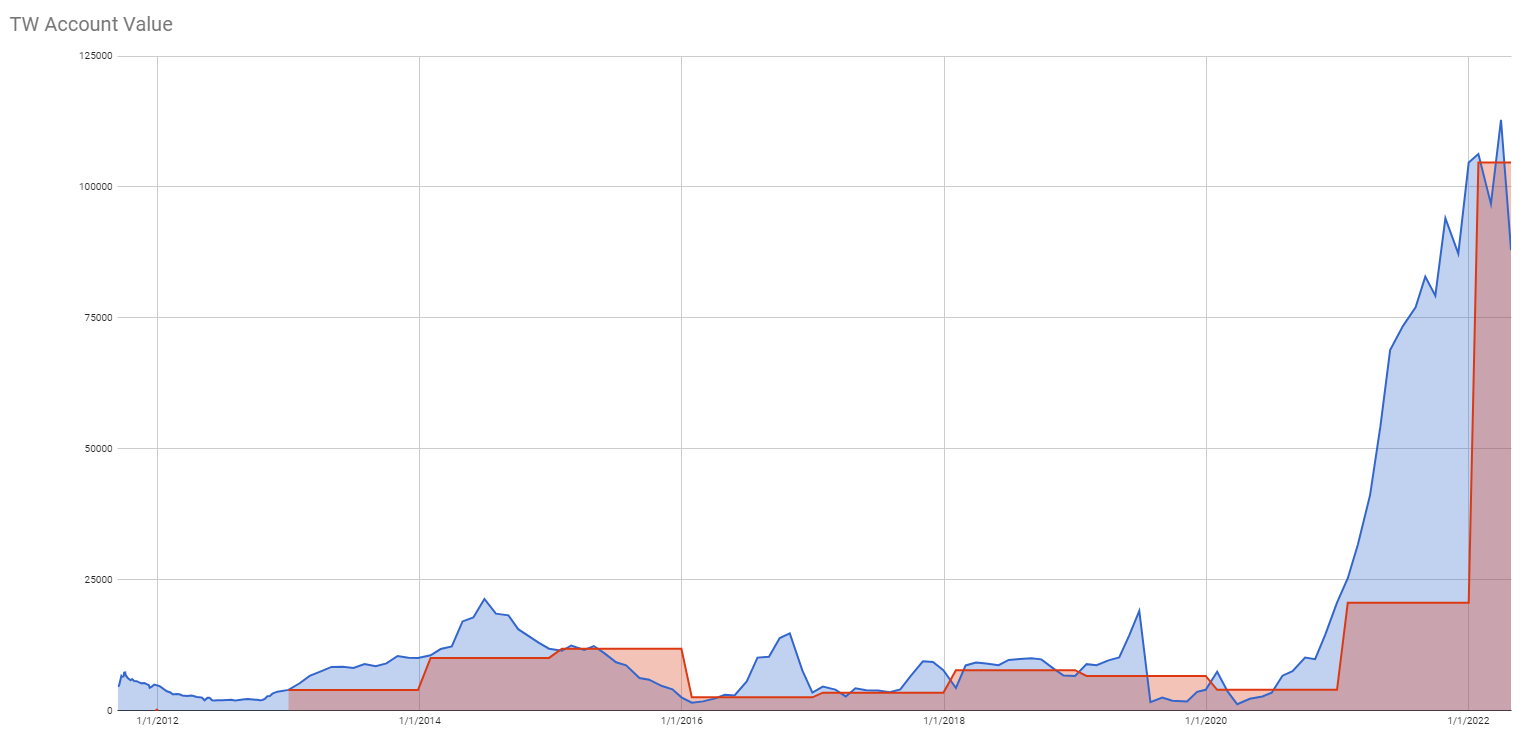
SPX PCS account value
Our SPX net-liq increased slightly last week. The market is volatile and selling too much and because of that, I am reducing our trading activity to just adjusting our existing trades.
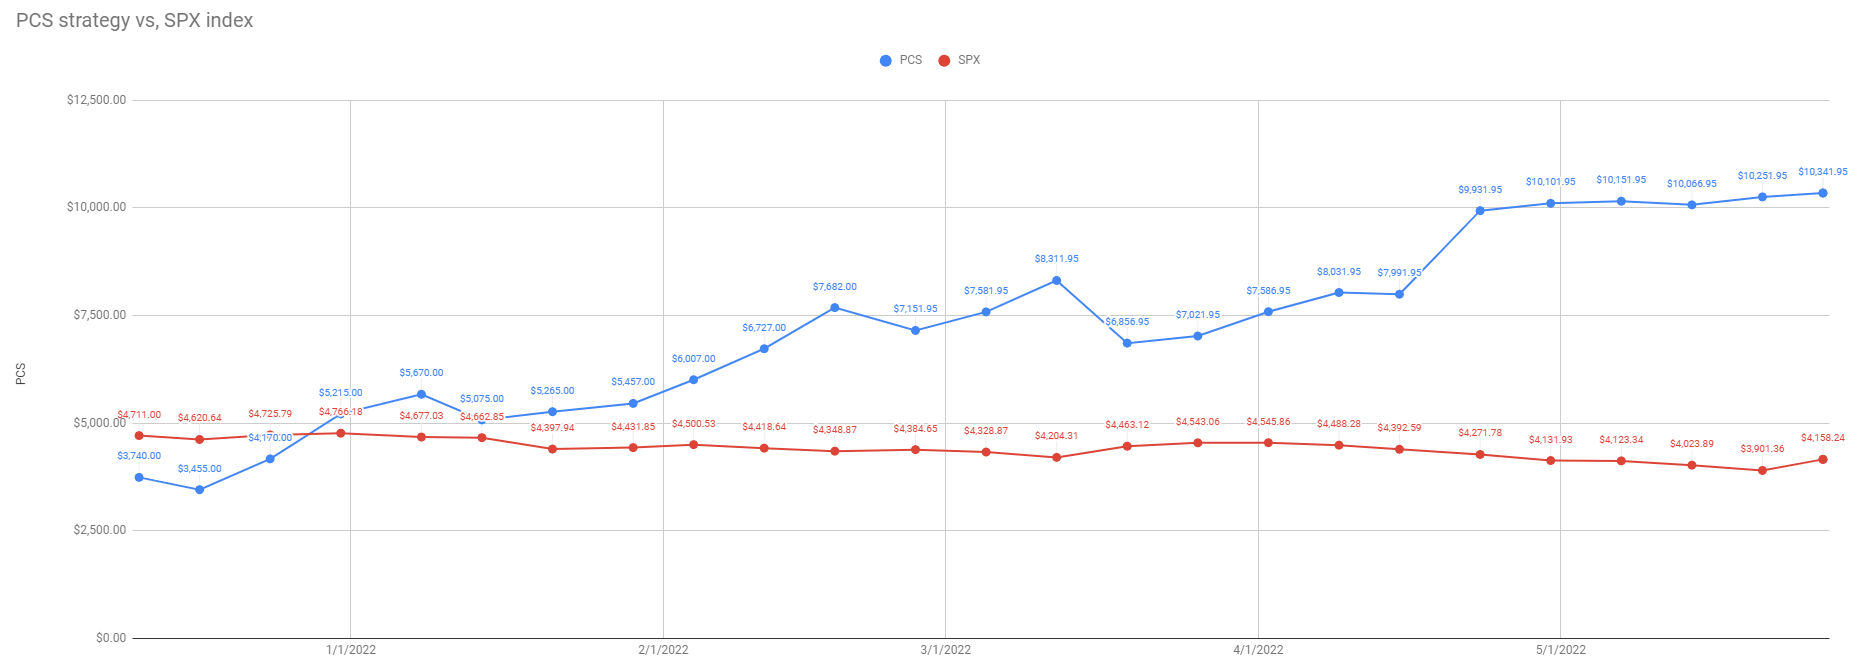
SPX PCS account vs SPX index net liq
Our account is slowly growing while the entire market was struggling even though last week SPX grew faster than our account. I am looking forward to this selling to end and the market resuming its bullish uptrend. We will be able to get into the more aggressive trades and boost our income significantly.

SPX PCS account vs SPX index
If you want to receive trade alerts whenever we open a new SPX put credit spread or a hedge trade, you can subscribe to our service:
Note, if you wish to subscribe to multiple levels, you can do so by subscribing to one level only and then send us an email that you want to be added to other levels too.
Also, if you like this report, hit the like button so I know there is enough audience wanting to see this type of report. If you have any questions or want to see anything else about my SPX trading, do not hesitate to contact me or write a comment in the comments section. Thank you!
|
We all want to hear your opinion on the article above: No Comments |


 button so I know that there is enough audience that like this content. Also if there is something you want to know or you want me to change this report to a different format, let me know in the comments section.


Recent Comments