The stock market and our trading performed well last week. I am still managing old trades as the damage from the last two months of selling is still present and I have too much buying power tied to those open trades. But it is getting better every day. I keep investing in high-quality dividend stocks and getting ready for more upside.
Last week, we finally made some money trading options. In the previous weeks, I had to roll some trades for debit. That ended last week and the rolls are now credit trades again. But my portfolio is still stretched.
Here is our investing and trading report:
| Account Value: | $105,015.51 | $4,938.20 | 4.70% |
| Options trading results | |||
| Options Premiums Received: | $503.00 | ||
| 01 January 2022 Options: | $8,885.00 | +8.36% | |
| 02 February 2022 Options: | $10,009.00 | +10.34% | |
| 03 March 2022 Options: | -$2,614.00 | -2.49% | |
| Options Premiums YTD: | $16,280.00 | +15.50% | |
| Dividend income results | |||
| Dividends Received: | $6.87 | ||
| 01 January 2022 Dividends: | $303.38 | ||
| 02 February 2022 Dividends: | $732.81 | ||
| 03 March 2022 Dividends: | $269.69 | ||
| Dividends YTD: | $1,305.88 | ||
| Portfolio metrics | |||
| Portfolio Yield: | 5.42% | ||
| Portfolio Dividend Growth: | 7.33% | ||
| Ann. Div Income & YOC in 10 yrs: | $31,617.59 | 21.62% | |
| Ann. Div Income & YOC in 20 yrs: | $268,320.69 | 183.48% | |
| Ann. Div Income & YOC in 25 yrs: | $1,203,548.75 | 823.01% | |
| Ann. Div Income & YOC in 30 yrs: | $8,186,988.57 | 5,598.45% | |
| Portfolio Alpha: | 10.20% | ||
| Portfolio Weighted Beta: | 0.47 | ||
| CAGR: | 479.78% | ||
| AROC: | 12.01% | ||
| TROC: | 11.82% | ||
| Our 2022 Goal | |||
| 2022 Dividend Goal: | $4,800.00 | 27.21% | In Progress |
| 2022 Portfolio Value Goal: | $151,638.03 | 69.25% | In Progress |
| 6-year Portfolio Value Goal: | $175,000.00 | 60.01% | In Progress |
| 10-year Portfolio Value Goal: | $1,000,000.00 | 10.50% | In Progress |
Dividend Investing and Trading Report
Last week we have received $6.87 in dividends bringing March’s dividend income to $269.69.
Last week, we have not purchased any dividend stock.
Here you can see our dividend income per stock holding:

Growth stocks Investing and Trading Report
Last week, we have not purchased any growth stocks.
Options Investing and Trading Report
Last week we rolled our strangle trades to keep our account safe.
These adjustments delivered income of $503.00 lowering our March total loss to -$2,614.00.
We were actively trading our SPX strategy that delivered $165.00 gain.
You can watch all our trades in this spreadsheet. You can watch the spreadsheet and look for a “NEW” indication next to the trading date. When the indicator shows up, it is typically good for up to 3 days to follow that trade.
Expected Future Dividend Income
We have received $6.87 in dividends last week. Our portfolio currently yields 5.42% at $105,015.51 market value.
Our projected annual dividend income in 10 years is $31,617.59 but that projection is if we do absolutely nothing and let our positions grow on their own without adding new positions or reinvesting the dividends.
We are also set to receive a $5,689.60 annual dividend income ($474.13 monthly income). We are 18.00% of our 10 year goal of $31,617.59 dividend income.

The chart above shows how our future dividend income is based on the future yield on cost and what dividend income we may expect in the future. The expected dividend growth depends on what stocks we are adding to our portfolio and the stocks’ 3 years average dividend growth rate. It is interesting to see what passive income we may enjoy 10, 20, 25, or 30 years from now.
Market value of our holdings
Our non-adjusted stock holdings market value increased from $150,126.50 to $152,482.70 last week.
In 2022 we plan on accumulating dividend stocks, monetizing these positions, HFEA strategy, and SPX trading. We plan on raising more of our holdings to 100 shares so we can start selling covered calls. We continued rebalancing our options trades that released buying power significantly. That allowed us to start buying shares of our interest again.

Our goal is to accumulate 100 shares of dividend growth stocks we liked and then start selling covered calls or strangles around those positions. We also planned on reinvesting all dividends back to those holdings.
Investing and trading ROI
Our options trading delivered a -2.49% monthly ROI in March 2022, totaling a 15.50% ROI YTD. We hope that in 2022 we exceed our 45% annual revenue selling options against dividend stocks target, although as of today, we are getting behind this goal.
Our entire account is up 0.35%.
Our options trading averaged $5,426.67 per month this year. If this trend continues, we are on track to make $65,120.00 trading options in 2022. As of today, we have made $16,280.00 trading options.
Old SPX trades repair
This week, we have not adjusted any of the old trades. We adjusted a trade a week ago and it appears to be playout out well. I hope, it will end in our favor and we will be able to get rid of that trade.
We however traded our SPX put credit spread strategy which you will be able to review in my next report. The SPX strategy held well so far, and our signals kept us away from opening new trades.
Market Outlook
The stock market returned 1.79% last week and it is poised for more gains next week.
If you want to find out I recommend you to subscribe to our weekly newsletter. Knowing where the market is heading and knowing when you should expect its reversal can benefit your trading and investing. Subscribe and you get one month free.
Investing and trading report in charts
Account Net-Liq

Account Stocks holding

Last week, S&P 500 grew 57.05% since we opened our portfolio while our portfolio grew 19.84%. On YTD basis, the S&P 500 fell -7.71% and our portfolio -9.93%. We are underperforming the market.
The numbers above apply to our stock holdings only. Our overall account net-liq is up by 0.35% this year thanks to our options strategies that generated enough income to stay up a bit.
Stock holdings Growth YTD

Our stock holdings are starting to outperform the market. Hopefully, this trend will stay and we will be doing better than S&P 500 constantly.
Our 10-year goal is to grow this account to $1,000,000.00 value in ten years. We are in year two and we accomplished 10.50% of that goal.
Our 6-year goal is to reach $175,000 account value to be eligible for portfolio margin (PM) and today we accomplished 60.01% of that goal.
Our 2022 year goal is to grow this account to a $151,638.03 and today we accomplished 69.25% of this goal.
Investing and Trading Report – Options Monthly Income

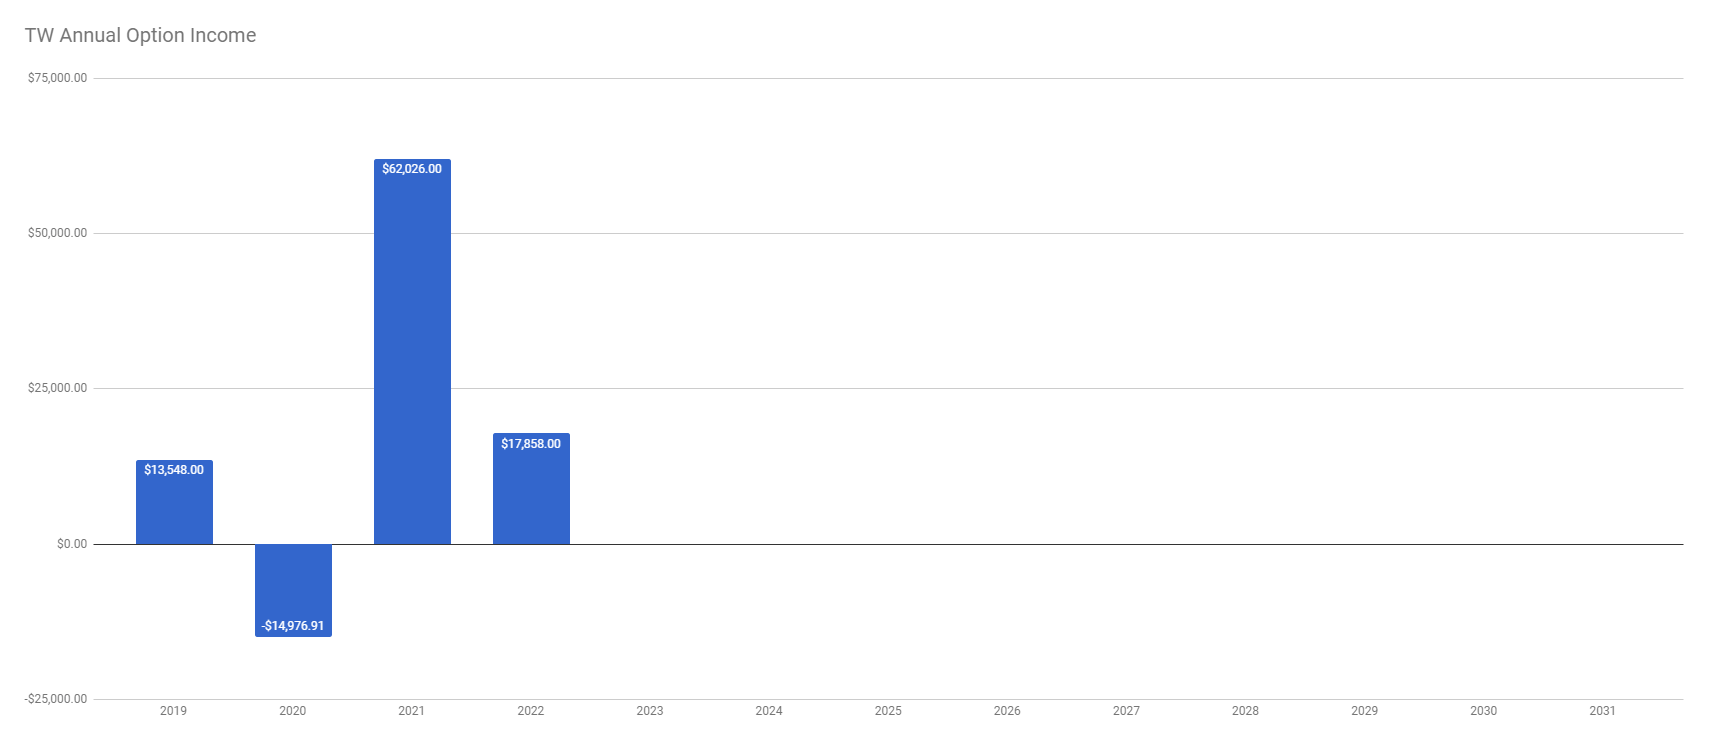
Investing and Trading Report – Options Annual Income

Our dividend goal and future dividends

We planned to make $4,800.00 in dividend income in 2022. As of today, we received $1,305.88. This is in line with our projected dividend 2022 goal. We also accumulated enough shares to start making $5,689.60 a year.

Our account cumulative return
The chart below indicates our cumulative adjusted return since we started tracking this metric.

Here is the cumulative return for the year 2022:

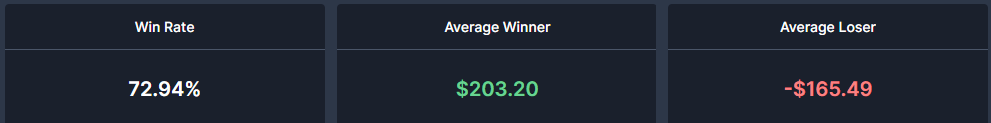
Our win ratio overall:

Our win ratio for 2022:

As of today, our account overall cumulative return is 17.91% (note, data in this section are since March 13, 2021, only as that is the date we started tracking these metrics. Thus the results are skewed a bit and will show full picture next year.) and our 2022 cumulative return is -20.13%.
I have a favor to ask. If you like this report, please, hit the like  button so I know that there is enough audience that like this content. Also if there is something you want to know or you want me to change this report to a different format, let me know in the comments section.
|
We all want to hear your opinion on the article above: No Comments |


Recent Comments