Last week was truly bad. Our net-liquidating value got hit hard, partially because of buying beaten-down tech stocks like PayPal, Tesla, or Netflix and they got beaten again. But it is a temporary drawdown of our investing and trading and I expect it to recover when the market stops freaking about interest rates and Ukraine. And the rates are good for the market, mark my words. As soon as the FED finally raises the rates, the market will rally.
Our options trading was great at the beginning of the week. We made over $3,000 of additional options premiums but when the market tanked, we had to take some trades off to release buying power, so we ended up flat for the week.
Here is our investing and trading report:
| Account Value: |
$101,416.51 |
-$5,332.89 |
-5.26% |
| Options trading results |
| Options Premiums Received: |
-$26.00 |
|
|
| 01 January 2022 Options: |
$8,885.00 |
+8.36% |
|
| 02 February 2022 Options: |
$5,529.00 |
+5.20% |
|
| Options Premiums YTD: |
$14,414.00 |
+14.21% |
|
| Dividend income results |
| Dividends Received: |
$11.18 |
|
|
| 01 January 2022 Dividends: |
$303.38 |
|
|
| 02 February 2022 Dividends: |
$73.57 |
|
|
| Dividends YTD: |
$376.95 |
|
|
| Portfolio metrics |
| Portfolio Yield: |
5.60% |
|
|
| Portfolio Dividend Growth: |
7.74% |
|
|
| Ann. Div Income & YOC in 10 yrs: |
$36,305.77 |
23.99% |
|
| Ann. Div Income & YOC in 20 yrs: |
$361,879.08 |
239.15% |
|
| Ann. Div Income & YOC in 25 yrs: |
$1,873,463.37 |
1238.06% |
|
| Ann. Div Income & YOC in 30 yrs: |
$15,710,296.09 |
10,382.03% |
|
| Portfolio Alpha: |
9.32% |
|
|
| Portfolio Weighted Beta: |
0.43 |
|
|
| CAGR: |
514.68% |
|
|
| AROC: |
14.13% |
|
|
| TROC: |
10.76% |
|
|
| Our 2022 Goal |
| 2022 Dividend Goal: |
$4,800.00 |
7.85% |
In Progress |
| 2022 Portfolio Value Goal: |
$151,638.03 |
66.88% |
In Progress |
| 6-year Portfolio Value Goal: |
$175,000.00 |
57.95% |
In Progress |
| 10-year Portfolio Value Goal: |
$1,000,000.00 |
10.14% |
In Progress |
Dividend Investing and Trading Report
Last week we have received $11.18 in dividends bringing February’s dividend income to $73.57.
We bought the following dividend stocks:
- 17 shares of CSQ @ $17.60
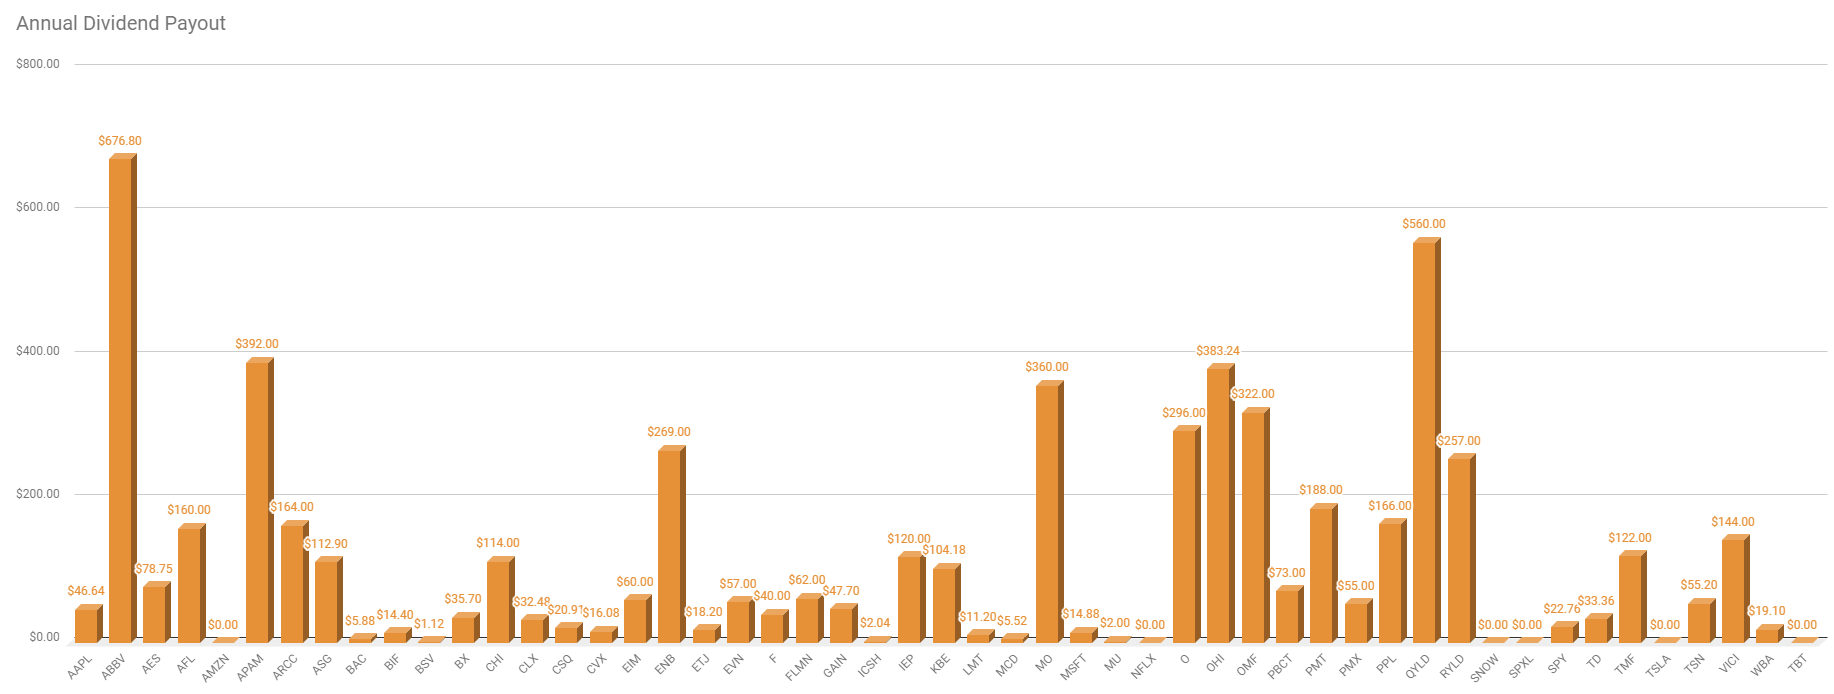
Here you can see our dividend income per stock holding:

Growth stocks Investing and Trading Report
Last week we bought the following growth stocks and funds:
- 12 shares of ICSH @ $50.31
- 5 shares of PYPL @ $118.55
Options Investing and Trading Report
Last week we rolled our strangle trades to keep our account safe. That raised cash and buying power.
These adjustments delivered a loss of -$26.00 bringing February total to $5,529.00.
We were actively trading our SPX strategy that delivered $720.00 weekly income.
You can watch all our trades in this spreadsheet. You can watch the spreadsheet and look for a “NEW” indication next to the trading date. When the indicator shows up, it is typically good for up to 3 days to follow that trade.
Expected Future Dividend Income
We have received $11.18 in dividends last week. Our portfolio currently yields 5.60% at $101,416.51 market value.
Our projected annual dividend income in 10 years is $36,305.77 but that projection is if we do absolutely nothing and let our positions grow on their own without adding new positions or reinvesting the dividends.
We are also set to receive a $5,770.35 annual dividend income ($480.86 monthly income). We are 15.89% of our 10 year goal of $36,305.77 dividend income.

The chart above shows how our future dividend income is based on the future yield on cost and what dividend income we may expect in the future. The expected dividend growth depends on what stocks we are adding to our portfolio and the stocks’ 3 years average dividend growth rate. It is interesting to see what passive income we may enjoy 10, 20, 25, or 30 years from now.
Market value of our holdings
Our non-adjusted stock holdings market value increased from $155,197.02 to $156,648.84 last week.
In 2022 we plan on accumulating dividend stocks, monetizing these positions, HFEA strategy, and SPX trading. We plan on raising more of our holdings to 100 shares so we can start selling covered calls. We continued rebalancing our options trades that released buying power significantly. That allowed us to start buying shares of our interest again.

Our goal is to accumulate 100 shares of dividend growth stocks we liked and then start selling covered calls or strangles around those positions. We also planed on reinvesting all dividends back to those holdings.
Investing and trading ROI
Our options trading delivered a 5.45% monthly ROI in February 2022, totaling a 14.21% ROI YTD. We hope that in 2022 we exceed our 45% annual revenue selling options against dividend stocks target!
Our entire account is down -3.08%.
Our options trading averaged $7,207.00 per month this year. If this trend continues, we are on track to make $86,484.00 trading options in 2022. As of today, we have made $14,414.00 trading options.
Old SPX trades repair
This week, we didn’t adjust our old SPX trades. Our goal is to reach a level where we will be eligible for portfolio margin (PM). Once that happens, we plan on converting the existing SPX Iron Condors to strangles and trade these positions as strangles.
With RegT margin, the capital requirements would be approx. $66,586.06 and that is beyond our means. With PM the requirement for margin would drop to around $10k. That is doable in our account. Once we reach this level, we will start adjusting our SPX trades accordingly. Until then, we will just roll these trades around.
The market seems to be presenting a good opportunity to adjust one old SPX trade. It will be a debit trade and it will consume quite a bit of the buying power. I might take it. The trade has a substantial profit on the call side and I am thinking to take the call side off and convert it into a put side. I will see what happens next week.
We however traded our SPX put credit spread strategy which you will be able to review in my next report. The SPX strategy held well so far, and our signals kept us away from opening new trades.
Market Outlook
The stock market crashed on Thursday and Friday last week when it failed to gain momentum and run higher after Wednesday’s strong rally. Now, it seems that the market is going to retest the previous lows. However, the two selloffs were news-driven and these moves typically do not have a long-lasting effect. What typically moves the markets are two types of news and you should be asking, is it a Known-Unknown or Unknown-Unknown type of news?
A Known-Unknown is something that is already known ahead of time but there are some unknown parts. Today Russia-Ukraine news is an example. We already knew Russia was advancing & combative. That some conflict was likely. We just didn’t know when it would happen.
So it’s fair to say that some of this conflict should already be priced into stocks. Some parts were already known and planned for by buyers and sellers. An Unknown-Unknown would be if war broke out and we had no prior notice (such as 9/11). That reaction can be severe.
The same goes with James Bullard and his remarks on the FED interest hikes he said on Thursday after the hot inflation data when he was calling for an emergency meeting. Again. it was a Known-Unknown. Everyone knows that inflation is high and everyone knows that FED is going to do something about it later or sooner. There is no doubt. So freaking about it is an overreaction.
The FED will not let inflation go out of control so at some point, they will raise the rates and it doesn’t matter how much. If they raise them too much, they can always slash them back down and pour even more money into the economy. The same way they did in 2018 – 2019 when they raise the rates. The markets didn’t like it and crashed a little over 20%. The FED quickly dropped the rates back to zero.
It is my expectation that the markets will like the interest rates hike once it finally happens and they will rally very strongly. And history teaches us that we may expect a single-digit gain by the end of the year (maybe 8% to 9% gain this year??).
If you want to learn more about the stock market, events that moved the market last week and will likely impact it in the near future, I recommend you to subscribe to our weekly newsletter. Knowing where the market is heading and knowing when you should expect its reversal can benefit your trading and investing. Subscribe and you get one month free.
Investing and trading report in charts
Account Net-Liq
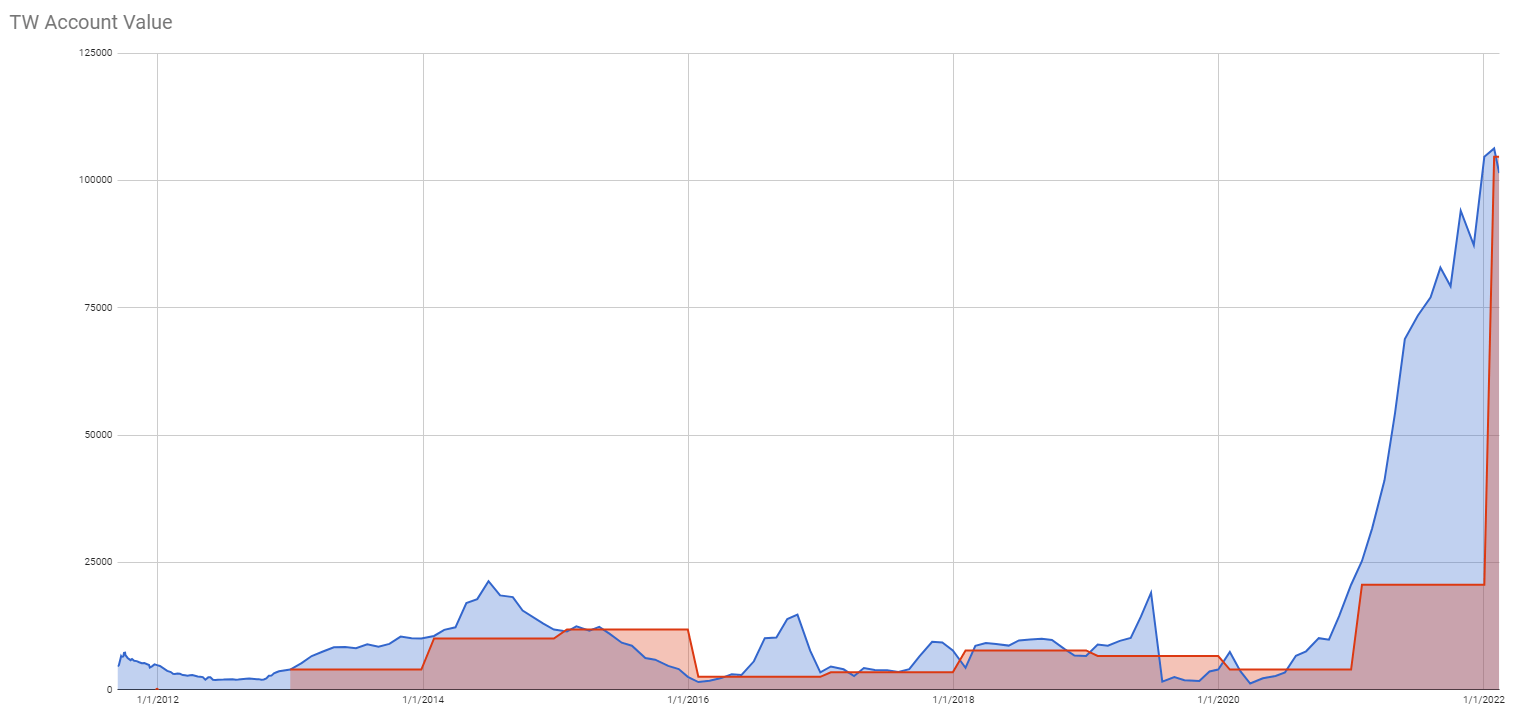
Account Stocks holding

Last week, S&P 500 grew 52.75% since we opened our portfolio while our portfolio grew 20.77%. On YTD basis, the S&P 500 fell -12.01% and our portfolio -9.00%. This clearly indicates that our stock holdings performed better than the market.
The numbers above apply to our stock holdings only. Our overall account net-liq is up by -3.08% this year thanks to our options strategies that generated enough income to stay up a bit.
Stock holdings Growth YTD

Our stock holdings are starting to outperform the market. Hopefully, this trend will stay and we will be doing better than S&P 500 constantly.
Our 10-year goal is to grow this account to $1,000,000.00 value in ten years. We are in year two and we accomplished 10.14% of that goal.
Our 6-year goal is to reach $175,000 account value to be eligible for portfolio margin (PM) and today we accomplished 57.95% of that goal.
Our 2022 year goal is to grow this account to a $151,638.03. and today we accomplished 66.88% of this goal.
Investing and Trading Report – Options Monthly Income

Investing and Trading Report – Options Annual Income

Our dividend goal and future dividends

We planned to make $4,800.00 in dividend income in 2022. As of today, we received $376.95. This is in line with our projected dividend 2022 goal. We also accumulated enough shares to start making $5,770.35 a year.

Our account cumulative return
The chart below indicates our cumulative adjusted return since we started tracking this metric.

Here is the cumulative return for the year 2022:

Our win ratio overall:

Our win ratio for 2022:

As of today, our account overall cumulative return is 26.14% (note, data in this section are since March 13, 2021, only as that is the date we started tracking these metrics. Thus the results are skewed a bit and will show full picture next year.) and our 2022 cumulative return is -14.56%.
I have a favor to ask. If you like this report, please, hit the like  button so I know that there is enough audience that like this content. Also if there is something you want to know or you want me to change this report to a different format, let me know in the comments section.
We all want to hear your opinion on the article above:
No Comments |


Recent Comments