Wow, the year 2021 is over. I wish all my readers Happy New Year 2022! It was exceptionally good year. I made a lot of money this year trading options, buying dividend growth stocks, and reinvesting the dividends.
Overall, I achieved 60% ROI trading options, but if we take into account that I started the account with $20,572.35 and made $62,026 trading options, I achieved 301.50% revenue trading options!
Here is a picture from my tracking spreadsheet:

So, as you can see, I was doing pretty well in 2021 trading options. Along with the stock holdings, that delivered an astonishing 408.67% Net-Liq growth in 2021. I hope, I will have 2022 as successful as 2021 although I do not expect it because, honestly, my trading was quite aggressive and I want to slow down next year.
Here is our investing and trading report:
| Account Value: | $104,644.64 | +$2,395.35 | +2.34% |
| Options trading results | |||
| Options Premiums Received: | -$1,411.00 | ||
| 01 January 2021 Options: | $4,209.00 | +16.65% | |
| 02 February 2021 Options: | $4,884.00 | +15.41% | |
| 03 March 2021 Options: | $5,258.00 | +12.79% | |
| 04 April 2021 Options: | $2,336.00 | +4.30% | |
| 05 May 2021 Options: | $6,346.00 | +9.22% | |
| 06 June 2021 Options: | $4,677.00 | +6.37% | |
| 07 July 2021 Options: | $3,865.00 | +5.14% | |
| 08 August 2021 Options: | $6,133.00 | +7.40% | |
| 09 September 2021 Options: | $2,353.00 | +2.97% | |
| 10 October 2021 Options: | $8,721.00 | +9.27% | |
| 11 November 2021 Options: | $4,577.00 | +5.24% | |
| 12 December 2021 Options: | $8,667.00 | +8.28% | |
| Options Premiums YTD: | $62,026.00 | +62.04% | |
| Dividend income results | |||
| Dividends Received: | $9.46 | ||
| 01 January 2021 Dividends: | $53.04 | ||
| 02 February 2021 Dividends: | $63.00 | ||
| 03 March 2021 Dividends: | $30.31 | ||
| 04 April 2021 Dividends: | $139.70 | ||
| 05 May 2021 Dividends: | $167.45 | ||
| 06 June 2021 Dividends: | $168.56 | ||
| 07 July 2021 Dividends: | $228.62 | ||
| 08 August 2021 Dividends: | $780.09 | ||
| 09 September 2021 Dividends: | $176.60 | ||
| 10 October 2021 Dividends: | $256.73 | ||
| 11 November 2021 Dividends: | $463.90 | ||
| 12 December 2021 Dividends: | $200.20 | ||
| Dividends YTD: | $2,785.53 | ||
| Portfolio metrics | |||
| Portfolio Yield: | 4.70% | ||
| Portfolio Dividend Growth: | 8.80% | ||
| Ann. Div Income & YOC in 10 yrs: | $24,969.22 | 20.57% | |
| Ann. Div Income & YOC in 20 yrs: | $264,575.96 | 217.95% | |
| Ann. Div Income & YOC in 25 yrs: | $1,511,555.24 | 1245.17% | |
| Ann. Div Income & YOC in 30 yrs: | $15,328,917.11 | 12,627.44% | |
| Portfolio Alpha: | 52.97% | ||
| Portfolio Weighted Beta: | 0.58 | ||
| CAGR: | 572.13% | ||
| AROC: | 61.11% | ||
| TROC: | 9.16% | ||
| Our 2021 Goal | |||
| 2021 Dividend Goal: | $1,071.42 | 259.10% | Accomplished |
| 2021 Portfolio Value Goal: | $42,344.06 | 247.13% | Accomplished |
| 6-year Portfolio Value Goal: | $175,000.00 | 59.80% | |
| 10-year Portfolio Value Goal: | $1,000,000.00 | 10.46% |
Dividend Investing and Trading Report
Last week we have received $9.46 in dividends bringing December’s dividend income to $200.20. We didn’t buy any shares of dividend growth stocks last week. We only traded SPX credit spreads.
Here you can see our dividend income per stock holding:

Growth stocks Investing and Trading Report
Last week we didn’t buy any new positions in growth stocks.
Options Investing and Trading Report
Last week we rolled some of the trades that got their call sides breached as the market rallied. But we also bought a protective put against our BABA strangle trade. I no longer feel comfortable holding BABA naked. I think BABA will eventually go to $30 a share. BABA jumped up almost 10% last week but then it started selling again. Buying the protective put reduced our risk in case I am right and the stock goes bust (and I am no longer going to defend the position) unless the Chinese government changes their investment rules so they will be similar to the western countries rules, not necessarily those in the US. Until then, any Chinese company listed in the US is a tremendous risk to me and I am not willing to take it.
These adjustments and buying the protective put lowered our December income by -$1,411.00 bringing December at $8,667.00.
We were actively trading our SPX strategy that delivered $1,045.00 weekly income. However, the market stalled at the $4,800 level that acts as resistance. It then bounced down and some of our SPX positions are in the money. If the selling continues we may be closing those positions at a loss.
You can watch all our trades in this spreadsheet. You can watch the spreadsheet and look for a “NEW” indication next to the trading date. When the indicator shows up, it is typically good for up to 3 days to follow that trade.
Expected Future Dividend Income
We have received $9.46 in dividends last week. Our portfolio currently yields 4.70% at $104,644.64 market value.
Our projected annual dividend income in 10 years is $24,969.22 but that projection is if we do absolutely nothing and let our positions grow on their own without adding new positions or reinvesting the dividends.
We are also set to receive a $4,825.62 annual dividend income. We are 19.33% of our 10 year goal of $24,969.22 dividend income.

The chart above shows how our future dividend income is based on the future yield on cost and what dividend income we may expect in the future. The expected dividend growth depends on what stocks we are adding to our portfolio and the stocks’ 3 years average dividend growth rate. It is interesting to see what passive income we may enjoy 10, 20, 25, or 30 years from now.
Market value of our holdings
Our non-adjusted stock holdings market value increased from $132,669.29 to $133,469.78 last week.
This is another great achievement of our 2021 investing journey. We diligently reinvested all our dividends and options premiums buying stocks and creating a snowball.
Here is another view of our investing progress and stock holdings growth:

As you can see, we started the year with an $18,179.67 stock holdings value and grew our positions to $133,469.78.

Our goal was to accumulate 100 shares of dividend growth stocks we liked and then start selling covered calls or strangles around those positions. We also planed on reinvesting all dividends back to those holdings. We fulfilled our goal at 66%.
Here is what our goal was at the beginning of 2021:

And here is how our goal evolved over time and how we accomplished it:

I am happy with the result but I hoped I could achieve more and buy more shares. But the goal was evolving and I focused on adding new strategies that postponed the goal too. Later when the markets became volatile I had to keep buying power available to sustain the swings (and sometimes I had hard times keeping my BP positive). Overall, I consider this a good achievement.
I will be moving unfinished goals into the 2022 year.
Investing and trading ROI
Our options trading delivered a 8.28% monthly ROI in December 2021, totaling a 59.27% ROI YTD. We again exceeded our 45% annual revenue selling options against dividend stocks target!
Our account grew by 408.67% beating our projections and the market.
Our options trading averaged $5,168.83 per month this year. If this trend continues, we are on track to make $62,026.00 trading options in 2021. As of today, we have made $62,026.00 trading options.
Old SPX trades repair
This week, we didn’t adjust our old SPX trades. Our goal is to reach a level where we will be eligible for portfolio margin (PM). Once that happens, we plan on converting the existing SPX Iron Condors to strangles and trade these positions as strangles.
With RegT margin, the capital requirements would be approx. $66,586.06 and that is beyond our means. With PM the requirement for margin would drop to around $10k. That is doable in our account. Once we reach this level, we will start adjusting our SPX trades accordingly. Until then, we will just roll these trades around.
We however traded our SPX put credit spread strategy which you will be able to review in my next report.
Market Outlook
The market rallied to the $4,800 mark as we predicted in our newsletter and then stalled. The $,800 level happened to become a strong resistance. Almost a book perfect resistance. The market tried to go above but retreated. But trading was light and pretty much quiet. VIX was down and the VIX structure indicates no troubles, also all our SPX trading signals were positive. So I think there is no need to worry. The current price action seems to be just a consolidation. But we need to wait for the next week.
If you want to learn more about the stock market, events that moved the market last week and will likely impact it in the near future, I recommend you to subscribe to our weekly newsletter. Knowing where the market is heading and knowing when you should expect its reversal can benefit your trading and investing. Subscribe and you get one month free.
Investing and trading report in charts
Account Net-Liq

Account Stocks holding

Last week, S&P 500 grew 64.76% since we opened our portfolio while our portfolio grew 29.80%. On YTD basis, the S&P 500 grew 34.92% and our portfolio 22.82%.
The numbers above apply to our stock holdings only. Our overall account net-liq grew by 408.67% this year! This is thanks to options trading that generates income. It can be also seen how the options help lower our cost basis. Just compare the P&L in the regular (left) column with the P&L in the “Options adjusted” column. For example, our AES holding would be a loser as of today (down -7.31%), but we generated enough income (we can call it also a return of our invested capital) and that position is 133.29% up.
Stock holdings Growth YTD

I expect our stock holdings to start outperforming the market hopefully soon. The entire portfolio beats the market by far thanks to monetizing those positions.
Our 10-year goal is to grow this account to $1,000,000.00 value in ten years. We are in year two and we accomplished 10.46% of that goal.
Our 6-year goal is to reach $175,000 account value to be eligible for portfolio margin (PM) and today we accomplished 59.80% of that goal.
Our 2021 year goal is to grow this account to a $42,344.00. We already accomplished this goal.
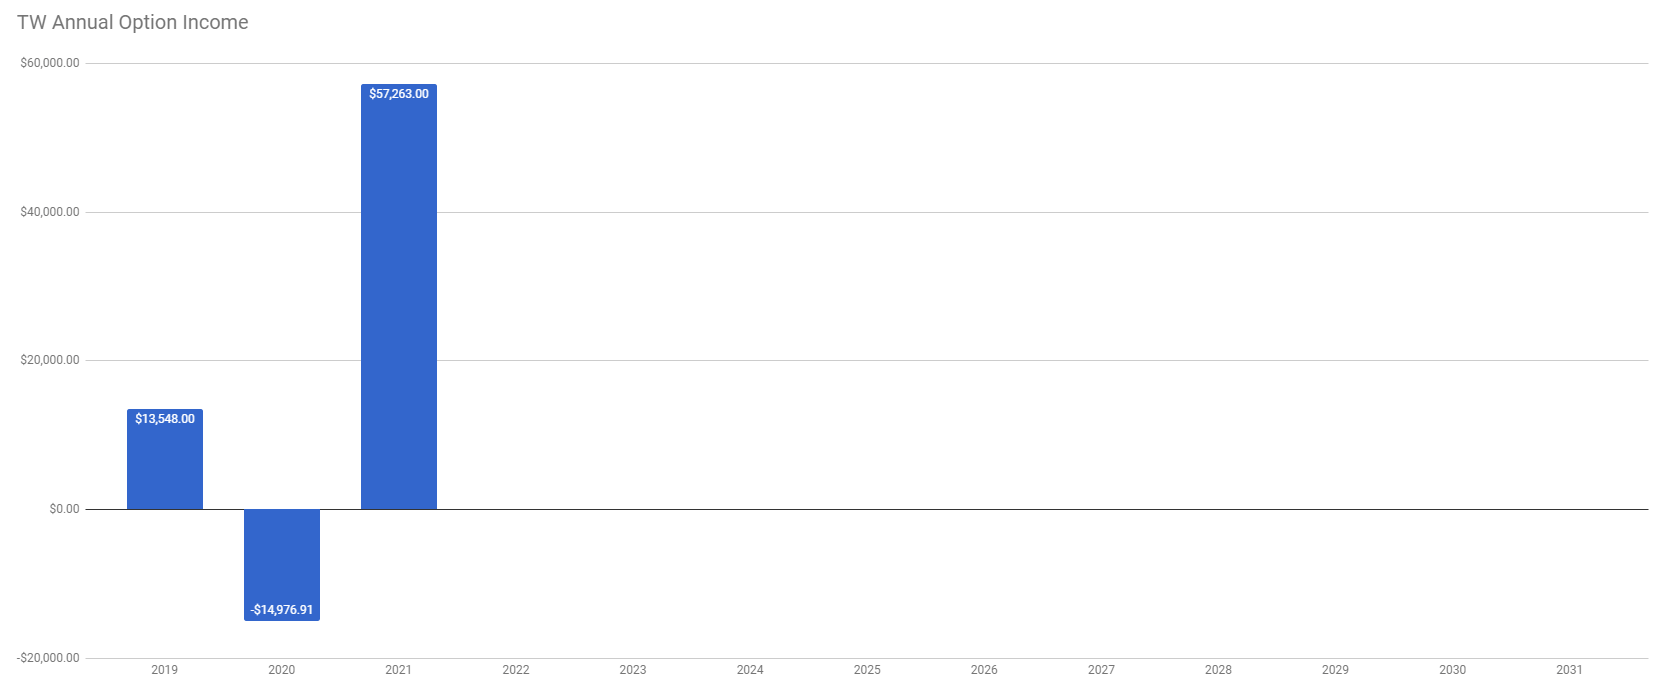
Investing and Trading Report – Options Monthly Income

Investing and Trading Report – Options Annual Income

Our dividend goal and future dividends

We have accomplished our dividend income goal. We planned to make $1,071 of dividend income this year and we finished receiving $2,785.53. However, we accumulated enough shares to start making $4,825.62 a year.
Also, it is amazing to see, that on monthly basis, we received $53 in dividends and grew our account and now we are receiving $400 in dividends.

Our account cumulative return
The chart below indicates our cumulative adjusted return.


As of today, our account cumulative return is 56.47% (note, data in this section are since March 13, 2021, only as that is the date we started tracking these metrics. Thus the results are skewed a bit and will show full picture next year.).
I have a favor to ask. If you like this report, please, hit the like  button so I know that there is enough audience that like this content. Also if there is something you want to know or you want me to change this report to a different format, let me know in the comments section.
|
We all want to hear your opinion on the article above: 4 Comments |


Recent Comments