Weekly Newsletter   Challenge account   Weekly Newsletter   


Posted by Martin November 03, 2021
No Comments


What was bad for the market yesterday is good today


The FED announced today that they would begin their tapering this month. If this announcement was made a few months ago, the stock market would sell off and throw away a baby with bathtub water. The media would be all red screaming “end of the world.”

Yet today, after the FED’s announcement, the stock market jumped up hard. After a week of doing nothing. I know that there is the saying of buying the rumors selling the news, in this case possibly “doing nothing on rumors and buying the news…” or whatever. That probably didn’t apply. Well, this is what happened today:


FED announcement and market reaction


The entire day – nothing. At 2 pm, the market rallied like it was also an end of the world.

I consider myself a seasoned investor and trader but this different perception of the same event still baffles me. I wonder why investors considered this a good thing when everybody considers the easing of easy money a bad thing and predicts the market to crash when the stimulus is taken away… Although history has proven that raising rates is not bad for the market. This time, it is only bad for the high-flying stocks with astronomical P/E and no “E” and revenue. But even ARKK that invests solely in this type of stock rallied.


We all want to hear your opinion on the article above:
No Comments


Posted by Martin October 30, 2021
No Comments


October 2021 $100 Challenge account review


Trading a small account requires a lot of patience and diligence. It is not get-rich-quick trading. When trading a small account, all odds will be against you – the fees, restrictions, regulations, everything will be set to make your journey hard and difficult. But the payoff will be sweet.

When I started trading options I wanted to be rich fast. I saw options as a route for riches bypassing slow stocks. At first, it worked and I believed I found the holy grail. But I only fooled myself when I was actually losing money. In 2019 I finally put a stop to my madness. I learned how to trade options the correct way, but never did it that way. In 2019, it was time to go back to the roots of proper options trading.

I restarted my account with nothing in it and slowly built it up again. The entire year 2019 was still going down. In 2020 my net liq dropped even more as many bad trades were going away. But I was not going astray and traded the way I knew would work no matter what. Today, my account reached $94,000 in just three years.

This program is to show you the progress step by step from a small account to a large one:


Accumulation phase

 
The account is still underperforming our goal but it is on the path to success. We are now trading small trades (strangles) and we will continue accumulating shares for our next options trade. The strangle trades are consuming collateral buying power but as they near towards expiration we will see a jump in BP and net-liq.

We are trading strangles because they are easier to manage compared to Iron Condors, but they are also a bit more expensive as far as capital requirements go. That is why choosing good stocks to trade is crucial. Choose safe, stable stocks, providing enough premium and stability. And that is what we are doing.
 

October 2021 Challenge account review


MONTH GOAL $$ ACTUAL $$
June 2021: $203.00 $202.67
July 2021: $306.00 $334.75
August 2021: $409.00 $397.71
September 2021: $512.00 $476.91
October 2021: $615.00 $632.37
November 2021: $718.00  
December 2021: $821.00  
January 2022: $924.00  
February 2022: $1,027.00  
March 2022: $1,130.00  
April 2022: $1,233.00  
May 2022: $1,336.00  


$100 Challenge account review

 
From the chart above, the red dot (line) indicates the current account value, compared to the blue line (plan). Our account is trailing our goal. When trading naked options, expect volatility in your net-liq. That can be seen by some as a disadvantage. When trading spreads, your net-liq will be stabilized by neutralizing delta. With naked options, you would have to choose other instruments to do so, for example owning stocks to neutralize your call side. We do not have this yet as our account is small, but we are building our position.
 

October 2021 Overall Challenge account review

 
The chart below indicates our account value compared to the overall goal and plan to grow $100 investment into a $75,000 portfolio. As of today, we are at the beginning of our journey.

YEAR CONTRIBUTIONS $$ GOAL $$ ACTUAL $$
Year 0: $100.00 $100.00 $100.00
Year 1: $1,300.00 $1,336.00 $632.37
Year 2: $2,500.00 $3,016.96  
Year 3: $3,700.00 $5,303.07  
Year 4: $4,900.00 $8,412.17  
Year 5: $6,100.00 $12,640.55  
Year 6: $7,300.00 $18,391.15  
Year 7: $8,500.00 $26,211.96  
Year 8: $9,700.00 $36,848.27  
Year 9: $10,900.00 $51,313.64  
Year 10: $12,100.00 $70,986.56  


$100 Challenge account review goal


September 2021 Challenge account Income


Total Invested in Stocks $301.82
Total Unrealized Profit $6.60
Total Realized Profit $2.21
Strangles Income $187.00
Dividends Income $9.02


August 2021 Cumulative return Challenge account review


As of today, our challenge account provided a -14.61% monthly cumulative return.
 

$100 Challenge account review goal

 
$100 Challenge account review goal


If you want to see what investments we take, what trades and strategies we will use to grow this small account join our program today and grow your money too. We engage in safe investments, select strategies to maximize winning trades, and grow our portfolio. And you can do it too, today! We do not provide quick rich promises, gambling, or reckless strategies. We want our portfolio to grow steadily and preserve our capital while maximizing returns.
 

As a member, you will have access to the following features:


We all want to hear your opinion on the article above:
No Comments


Posted by Martin October 29, 2021
No Comments


2021 Week 43 investing and trading report


October 2021 is in the books and it was our best month ever. As you will see in this investing and trading report, our net-liquidating value increased by a whopping $14k, our premium income, selling options reached almost $9k and we met our dividend goal by receiving $250 this month. If all future months will look like this year’s October, I will be very happy. This performance is getting me closer to full-time trading. My plan is to start preparing for full-time trading once our account reaches the limit for portfolio margin. Once we get a portfolio margin, we will adjust our trading, create salary reserves, and start shifting to a full-time trading plan. Originally, I had a plan to reach this goal in 6 years but thanks to this trading progress we may be able to reach this goal two or maybe even three years earlier than planned. That will mean that I will finally achieve financial freedom.


Here is our investing and trading report:


Account Value: $94,045.84 +$2,595.16 +2.84%
Options trading results
Options Premiums Received: $477.00    
01 January 2021 Options: $4,209.00 +16.65%  
02 February 2021 Options: $4,884.00 +15.41%  
03 March 2021 Options: $5,258.00 +12.79%  
04 April 2021 Options: $2,336.00 +4.30%  
05 May 2021 Options: $6,346.00 +9.22%  
06 June 2021 Options: $4,677.00 +6.37%  
07 July 2021 Options: $3,865.00 +5.14%  
08 August 2021 Options: $6,133.00 +7.40%  
09 September 2021 Options: $2,353.00 +2.97%  
10 October 2021 Options: $8,721.00 +9.27%  
Options Premiums YTD: $48,782.00 +51.87%  
Dividend income results
Dividends Received: $86.32    
01 January 2021 Dividends: $53.04    
02 February 2021 Dividends: $63.00    
03 March 2021 Dividends: $30.31    
04 April 2021 Dividends: $139.70    
05 May 2021 Dividends: $167.45    
06 June 2021 Dividends: $168.56    
07 July 2021 Dividends: $228.62    
08 August 2021 Dividends: $780.09    
09 September 2021 Dividends: $176.60    
10 October 2021 Dividends: $256.73    
Dividends YTD: $2,105.58    
Portfolio metrics
Portfolio Yield: 4.21%    
Portfolio Dividend Growth: 8.13%    
Ann. Div Income & YOC in 10 yrs: $19,689.81 15.91%  
Ann. Div Income & YOC in 20 yrs: $167,751.70 121.70%  
Ann. Div Income & YOC in 25 yrs: $779,760.45 518.36%  
Ann. Div Income & YOC in 30 yrs: $5,778,203.82 3413.83%  
Portfolio Alpha: 44.94%    
Portfolio Weighted Beta: 0.66    
CAGR: 632.73%    
AROC: 53.55%    
TROC: 13.41%    
Our 2021 Goal
2021 Dividend Goal: $1,071.42 196.52% Accomplished
2021 Portfolio Value Goal: $42,344.06 222.10% Accomplished
6-year Portfolio Value Goal: $175,000.00 53.74%  
10-year Portfolio Value Goal: $1,000,000.00 9.40%  


Dividend Investing and Trading Report

 
Last week the stock market slowed down its pace upwards and we mostly rolled our trades. We also added SSO but that was all we did. We rolled AES, BABA, and SPY trades. It was a slow week for us but we already reached and exceeded all our goals this week so we could afford to stay aside.

We received $86.32 in dividends last week and that put our dividend income back on track with the plan.

We will keep growing our dividend growth portfolio, in fact, we stopped scaling up our options trading and will focus on adding more dividend growth stocks to our portfolio. Here you can see our dividend income per stock holding. I hope, it will grow faster now:

 
Annual Dividend Payout week 43
 

Options Investing and Trading Report

 
We generated $477.00 options income last week and that concluded October with total of $8,721.00 option income. The best month ever.

Last week we rolled a few of our positions but stayed quiet most of the time. We are also increasing our buying power minimum limit to $4,000 for November. The reason is to have some cash to be buying opportunities. In the recent past, when the market sold off, I couldn’t buy much because of not having enough cash. With this limit, I want to avoid that situation.


You can watch all our trades in this spreadsheet. You can watch the spreadsheet and look for a “NEW” indication next to the trading date. When the indicator shows up, it is typically good for up to 3 days to follow that trade.
 

Expected Future Dividend Income

 
We received $86.32 in dividends last week. This income brings our income stream back to the original plan. I was disappointed last week with our dividend income and thought I may have done something wrong with tracking it. Looks like I am still OK.

 
Our projected annual dividend income in 10 years is $19,689.81 but that projection is if we do absolutely nothing and let our positions grow on their own without adding new positions or reinvesting the dividends.

We are also set to receive a $4,049.13 annual dividend income. We are 23.59% of our 10 year goal of $19,689.81 dividend income.

 
Future Divi on YOC week 43
 

The chart above shows how our future dividend income is based on the future yield on cost and what dividend income we may expect in the future. The expected dividend growth depends on what stocks we are adding to our portfolio and the stocks’ 3 years average dividend growth rate. It is interesting to see what passive income we may enjoy 10, 20, 25, or 30 years from now.


Market value of our holdings

 
Our non-adjusted stock holdings market value increased from $118,822.58 to $121,107.63 last week.

However, we still expect the value of our holdings to grow and outperform the market long term. Many positions in our portfolio are new and “young” and they did not have enough time to show gains yet. We were building cash reserves to buy depressed stocks during selloffs and corrections as well as negative analysts reports (as long as the company is still good long term).

 
Stock holdings week 43
 

Our goal is to accumulate 100 shares of each stock of our interest and we are getting to that goal.
 

Investing and trading ROI


Our options trading delivered a 9.27% monthly ROI in October 2021, totaling a 51.87% ROI YTD. We again exceeded our 45% annual revenue selling options against dividend stocks target!

Our account grew by 357.15% beating our projections and the market.
 

Our options trading averaged $4,878.20 per month this year. If this trend continues, we are on track to make $58,538.40 trading options in 2021. As of today, we have made $48,782.00 trading options.
 

Old SPX trades repair


This week, we didn’t adjust any SPX trades. Our goal is to reach a level that we will be eligible for portfolio margin (PM). Once that happens, we plan on converting the existing SPX Iron Condors to strangles and trade these positions as strangles.

With RegT margin, the capital requirements would be approx. $66,586.06 and that is beyond our means. With PM the requirement for margin would drop to around $10k. That is doable in our account. Once we reach this level, we will start adjusting our SPX trades accordingly. Until then, we will just roll these trades around.


Accumulating Growth Stocks


Last week we have added shares of SSO to our holdings according to our plan and rules. Our goal for the nearest future is to accumulate 25% of our net-liq in these shares and maintain the weight. If the weight goes above 25% we will start trimming the positions, and when the weight goes below 25% we will start accumulating the positions. Any leftovers will be reinvested to the dividend growth stocks, options trades, or reserves.


Accumulating Rules


Our rule is to buy shares of growth stocks using 20% of any BP value that is above the $3,000 October limit. For example, if our BP ends at $3,900, we can buy shares using 20% of $900 or $180 to accumulate shares of any growth stocks. For November 2021, we are increasing this limit to $4,000 and we will invest 20% of anything above this limit. Once we reach the $10,000 limit we will start scaling up our options trades again.

Why such a rule? Up to today, I was scaling up my trades and portfolio. That resulted in rapid growth but also all our proceeds were constantly locked in the trades. If we want to live off of our dividends and options income, we cannot have them locked by new trades. We need to start accumulating “cash available to withdraw”. Therefore, I am shifting my trading to trade the same amount of contracts and invest only a certain excess of the accumulated cash.

Another reason, of course, is to have enough cash to buy opportunities when the market crashes or corrects. As is typical, Wall Street usually overreacts (stupidly) and I want to buy shares when the market is in panic. Like in March 2020. I bought some shares but I wish, I had more free cash. I would buy more.


Accumulating Dividend Growth Stocks


Last week, we didn’t add any new dividend stocks to our holdings. We are still accumulating SSO and SPXL, but from now on we may start adding some dividend stock again (of course, when the BP is above the limit as per our rule).

Our goal is to reach 100 shares of high-quality dividend stocks and build a weekly dividend income as per this calendar, but we have made no changes to this goal last week:
 

Weekly dividends income calendar
 
You can see the entire spreadsheet here.


Market Outlook


I expected the market to correct a bit or pull back the recovery. We had a short (just two days) pause on Tuesday and Wednesday last week but then the market shot up again and didn’t look back. If you are asking why or what moved this market the way it did, then the reason was earnings. Companies still report strong earnings and beat expectations. They also provide positive outlooks for the next earnings. Although some companies, such as Apple and Amazon cited supply chain issues as to why they missed their revenue, the market shrugged it off because it considered it a short-term issue that will go away. If you look at the APPL and AMZN chart, the stock opened down but rallied the rest of the day. The market didn’t consider the supply chain to be an issue. If you are a subscriber to my newsletter, you will get another issue this weekend and I will describe this more in detail.

This was my last week’s expectation about the market’s move. I expected a pullback. We had a slight pause instead:
 

SPX 2021 1022

 
Understand, that it is earnings and earnings outlook that moves the market. Nothing else. Everything else is completely irrelevant. If you want to see why a market or a stock moved the way it did, look at earnings. There probably was some change in the guidance or analysts may have adjusted their expectations. There are a few analysts that I follow and they regularly publish their outlooks based on companies’ earnings and guidance they provide. Look for earnings per share for the entire market and that will give you all information you need to calculate the intrinsic value of the market. And if the market or stock moves but earnings or outlooks didn’t change, you can be assured that such a move is just noise. In that case, you can safely buy the dip.

Here is what happened last week:
 

SPX 2021 1029

 
We didn’t see much bouncing last week but headed directly to a new all-time high. And I expect this trend to continue higher. The $5,000 target is still in play.

If you want to learn more about the stock market, events that moved the market last week and will likely impact it in the near future, I recommend you to subscribe to our weekly newsletter. Knowing where the market is heading and knowing when you should expect its reversal can benefit your trading and investing. Subscribe and you get one month free.


Investing and trading report in charts


Account Net-Liq


TW Account Net-Liq week 43


Account Stocks holding

 
TW Account holdings week 43
 

Last week, S&P 500 grew 58.90% since we opened our portfolio while our portfolio grew 31.45%. On YTD basis, the S&P 500 grew 29.05% and our portfolio 24.47%.

Our portfolio, again, grew faster than the overall market and we are pairing this year’s market performance. I expect this trend to continue in the next few years.

The numbers above apply to our stock holdings only. Our overall account net-liq grew by 357.15% this year! This is thanks to options trading that generates income. It can be also seen how the options help lower our cost basis. Just compare the P&L in the regular (left) column with the P&L in the “Options adjusted” column. For example, our AES holding would be a loser as of today (down -2.47%), but we generated enough income (we can call it also a return of our invested capital) and that position is 132.11% up.
 

Stock holdings Growth YTD

 
TW Account holdings Growth YTD
 

I expect our stock holdings to start outperforming the market very soon. The entire portfolio beats the market by far thanks to monetizing those positions.

Our 10-year goal is to grow this account to $1,000,000.00 value in ten years. We are in year two and we accomplished 9.40% of that goal.

Our 6-year goal is to reach $175,000 account value to be eligible for portfolio margin (PM) and today we accomplished 53.74% of that goal.

Our 2021 year goal is to grow this account to a $42,344.00. We already accomplished this goal.


Investing and Trading Report – Options Monthly Income

 
TW Options Income week 43
 

Investing and Trading Report – Options Annual Income


TW Options Annual Income week 43
 

Our dividend goal and future dividends


TW Received vs Projected Dividends week 43
 

We have accomplished our dividend income goal. We planned to make $1,071 of dividend income this year and we finished receiving $2,105.58. However, we accumulated enough shares to start making $4,048.13 a year.
 

TW Received vs Future Dividends week 43


Our account cumulative return


The chart below indicates our cumulative adjusted return. It shows how the last week’s selloff shook down our returns but we are recovering along with the market.
 

TW cumulative return wk 43
 

TW win ratio wk 42
 

As of today, our account cumulative return is 56.18% (note, data in this section are since March 13, 2021, only as that is the date we started tracking these metrics. Thus the results are skewed a bit and will show full picture next year.).


Conclusion of our investing and trading report


This week our options trading was within our expectations and I believe, the rest of the month will be even better.

We will continue accumulating the dividend growth stocks in our portfolio to reach 100 shares and continue building our cash reserves so we have enough cash to sustain any market corrections and be able to buy depressed stocks.

We will report our next week’s results next Saturday. Until then, good luck and good trading!


We all want to hear your opinion on the article above:
No Comments


Posted by Martin October 24, 2021
No Comments


2021 Week 42 investing and trading report


October 2021 is becoming the best month for trading options. As you will see in this investing and trading report we made over $8,000 this month so far and our net liquidating value jumped above $90k.

And, in the meantime, please, enjoy our weekly investing and trading report.


Here is our investing and trading report:


Account Value: $91,450.68 +$2,189.14 +2.45%
Options trading results
Options Premiums Received: $3,019.00    
01 January 2021 Options: $4,209.00 +16.65%  
02 February 2021 Options: $4,884.00 +15.41%  
03 March 2021 Options: $5,258.00 +12.79%  
04 April 2021 Options: $2,336.00 +4.30%  
05 May 2021 Options: $6,346.00 +9.22%  
06 June 2021 Options: $4,677.00 +6.37%  
07 July 2021 Options: $3,865.00 +5.14%  
08 August 2021 Options: $6,133.00 +7.40%  
09 September 2021 Options: $2,353.00 +2.97%  
10 October 2021 Options: $8,244.00 +9.01%  
Options Premiums YTD: $48,305.00 +52.82%  
Dividend income results
Dividends Received: $15.27    
01 January 2021 Dividends: $53.04    
02 February 2021 Dividends: $63.00    
03 March 2021 Dividends: $30.31    
04 April 2021 Dividends: $139.70    
05 May 2021 Dividends: $167.45    
06 June 2021 Dividends: $168.56    
07 July 2021 Dividends: $228.62    
08 August 2021 Dividends: $780.09    
09 September 2021 Dividends: $176.60    
10 October 2021 Dividends: $170.41    
Dividends YTD: $2,019.26    
Portfolio metrics
Portfolio Yield: 4.18%    
Portfolio Dividend Growth: 8.13%    
Ann. Div Income & YOC in 10 yrs: $16,886.62 15.76%  
Ann. Div Income & YOC in 20 yrs: $128,176.48 119.63%  
Ann. Div Income & YOC in 25 yrs: $542,659.14 506.47%  
Ann. Div Income & YOC in 30 yrs: $3,544,761.59 3,308.37%  
Portfolio Alpha: 45.74%    
Portfolio Weighted Beta: 0.67    
CAGR: 632.53%    
AROC: 54.87%    
TROC: 13.76%    
Our 2021 Goal
2021 Dividend Goal: $1,071.42 188.47% Accomplished
2021 Portfolio Value Goal: $42,344.06 215.97% Accomplished
6-year Portfolio Value Goal: $175,000.00 52.26%  
10-year Portfolio Value Goal: $1,000,000.00 9.15%  


Dividend Investing and Trading Report

 
Last week, the markets continued a strong recovery although at the end of the week the S&P 500 growth slowed down. We grew our net-liq by 2.45% last week. Since our rule of keeping min. $3,000 in BP was met, we purchased dividend growth stocks and SPXL and SSO shares to get our portfolio ready for rapid growth. We also added other dividend stocks and we rolled our strangles up (some to generate more income, others were rolled up as the market was recovering). We were also re-opening trades that expired last week.

Our options income reached another impressive $3,019.00 dollars received in premiums. That makes $8,244.00 in October so far. This is our best month in premium income.

Our dividend income was steady, we have received $15.27 in dividends last week, making October at $170.41 dividend income.

We are also growing our dividend growth portfolio and here you can see our dividend income per stock holding and how they contribute to the overall dividend income:

 
Annual Dividend Payout week 42
 

Options Investing and Trading Report

 
As I mentioned above, we generated $3,019.00 options income so far this month and we expect to generate more next week.

Last week we rolled our positions and it was extremely profitable. I keep saying that these selloffs are great for investors. All they need to do is stop panicking, assess the situation (which means learning how to evaluate the stock market as a whole), and instead of panic selling engage in buying. We rolled our options trades and made over $3k in premiums, but this selloff also allowed us to buy more stock. We also opened new trades replacing the trades that expired last week.


You can watch all our trades in this spreadsheet. You can watch the spreadsheet and look for a “NEW” indication next to the trading date. When the indicator shows up, it is typically good for up to 3 days to follow that trade.
 

Expected Future Dividend Income

 
We received $15.27 in dividends last week. It is a bit disappointing dividend income as in the past few weeks and months it started to look like our dividend income was picking up, but the last month and October sucks. I may need to review my dividend tracking as it shows that I should be getting more in dividends than what I am receiving. So, I guess, there is an error in my tracking. One item could be that I track ex-dividend date but I should probably track a payout date as I noticed that some companies can pay the dividends a few months after the ex-date.

 
Our projected annual dividend income in 10 years is $16,886.62 but that projection is if we do absolutely nothing and let our positions grow on their own without adding new positions or reinvesting the dividends.

We are also set to receive a $4,048.88 annual dividend income. We are 23.98% of our 10 year goal.

 
Future Divi on YOC week 42
 

The chart above shows how our future dividend income is based on the future yield on cost and what dividend income we may expect in the future. The expected dividend growth depends on what stocks we are adding to our portfolio and the stocks’ 3 years average dividend growth rate. It is interesting to see what passive income we may enjoy 10, 20, 25, or 30 years from now.


Market value of our holdings

 
Our non-adjusted stock holdings market value increased from $115,926.73 to $118,822.58 last week.

However, we still expect the value of our holdings to grow and outperform the market long term. Many positions in our portfolio are new and “young” and they did not have enough time to show gains yet. We were building cash reserves to buy depressed stocks during selloffs and corrections as well as negative analysts reports (as long as the company is still good long term).

 
Stock holdings week 42
 

Our goal is to accumulate 100 shares of each stock of our interest and we are getting to that goal.
 

Investing and trading ROI


Our options trading delivered a 9.01% monthly ROI in October 2021, totaling a 52.82% ROI YTD. We again exceeded our 45% annual revenue selling options against dividend stocks target!

Our account grew by 344.53% beating our projections and the market.
 

Our options trading averaged $4,830.50 per month this year. If this trend continues, we are on track to make $57,966.00 trading options in 2021. As of today, we have made $48,305.00 trading options.
 

Old SPX trades repair


This week, we didn’t adjust any SPX trades. Our goal is to reach a level that we will be eligible for portfolio margin (PM). Once that happens, we plan on converting the existing SPX Iron Condors to strangles and trade these positions as strangles.

With RegT margin, the capital requirements would be approx. $66,586.06 and that is beyond our means. With PM the requirement for margin would drop to around $10k. That is doable in our account. Once we reach this level, we will start adjusting our SPX trades accordingly. Until then, we will just roll these trades around.


Accumulating Growth Stocks


Last week we have added shares of SSO and SPXL to our holdings according to our plan and rules. Our goal for the nearest future is to accumulate 25% of our net-liq in these shares and maintain the weight. If the weight goes above 25% we will start trimming the positions, and when the weight goes below 25% we will start accumulating the positions. Any leftovers will be reinvested to the dividend growth stocks, options trades, or reserves.

We also added a few shares of BITO but the ETF didn’t perform as expected so we got out of the position with a small loss. I also did some reading and learned more about the fund. It is trading futures of Bitcoin and replacing expiring futures with the new front-month futures. With this strategy, it will work in a similar manner as the USO fund, and that is a receipt for a disaster for investors as you may suffer value destruction over time because of a contango effect. This vehicle is good to capture short-term moves but not a long-term investment.


Accumulating Rules


Our rule is to buy shares of growth stocks using 20% of any BP value that is above the $3,000 October limit (in November we will be raising the limit to $4,000). For example, if our BP ends at $3,900, we can buy shares using 20% of $900 or $180 to accumulate shares of any growth stocks.

Why such a rule? Up to today, I was scaling up my trades and portfolio. That resulted in rapid growth but also all our proceeds were constantly locked in the trades. If we want to live off of our dividends and options income, we cannot have them locked by new trades. We need to start accumulating “cash available to withdraw”. Therefore, I am shifting my trading to trade the same amount of contracts and invest only a certain excess of the accumulated cash.


Accumulating Dividend Growth Stocks


Last week, we added shares of OMF when the stock dropped 8% unexpectedly. We still plan on adding The Toronto-Dominion Bank (TD) or Walgreens Boots Alliance, Inc. (WBA) dividend stocks once our goal of accumulating SPXL and SSO is accomplished.

Our goal is to reach 100 shares of high-quality dividend stocks and build a weekly dividend income as per this calendar, but we have made no changes to this goal last week:
 

Weekly dividends income calendar
 
You can see the entire spreadsheet here.


Market Outlook


As I indicated above, the stock market continued its rally. It recovered the September pullback so we are now back on track for a new all-time high:


With that said, what could be the next move in the market? Again, we need to remember at what stage or phase this market is. The market is driven by earnings. Nothing else. Everything else is a secondary driver. The primary driver is earnings. It is astounding to see people investing in the market and not knowing what drives it. It is like driving a car but having a thick cover on the front windshield. People invest in the market completely blind and influenced by rumors false expectations and wishful thinking. They think they know but when I ask them, they turn out to be clueless.

Just yesterday I had a discussion with one investor on social media about the market and he proclaimed that it was wishful thinking to expect that the market would make new double-digit gains over the foreseeable future. He revealed that he had no idea what drives the market and he is investing based on HIS expectations and perceptions, not the market. If you are a subscriber to my newsletter, you would know why this market is, in fact, in a very healthy stage and will most likely post triple-digit gains over the foreseeable future.

My expectation for the next week is however some small pullback or consolidation of the recent gains but then we are heading to a Santa Claus rally.
 

SPX 2021 1022

 
We may see some bouncing around but it is my opinion that this market is heading to a new all-time high.

If you want to learn more about the stock market, events that moved the market last week and will likely impact it in the near future, I recommend you to subscribe to our weekly newsletter. Knowing where the market is heading and knowing when you should expect its reversal can benefit your trading and investing. Subscribe and you get one month free.


Investing and trading report in charts


Account Net-Liq


TW Account Net-Liq week 42


Account Stocks holding

 
TW Account holdings week 42
 

Last week, S&P 500 grew 57.11% since we opened our portfolio while our portfolio grew 29.77%. On YTD basis, the S&P 500 grew 27.27% and our portfolio 22.79%.

The numbers above indicate that our portfolio grows faster than the market and we are pairing this year’s market performance. I expect this trend to continue in the next years.

The numbers above apply to our stock holdings in our account, not the overall account net-liq growth. Our overall account beats the market growing by 344.53%!
 

Stock holdings Growth YTD

 
TW Account holdings Growth YTD
 

I expect our stock holdings to start outperforming the market as they mature. However, these are just our stock holdings. The entire portfolio beats the market by far thanks to monetizing those positions.

Our 10-year goal is to grow this account to $1,000,000.00 value in ten years. We are in year two and we accomplished 9.15% of that goal.

Our 6-year goal is to reach $175,000 account value to be eligible for portfolio margin (PM) and today we accomplished 52.26% of that goal.

Our 2021 year goal is to grow this account to a $42,344.00. We already accomplished this goal.


Investing and Trading Report – Options Monthly Income

 
TW Options Income week 42
 

Investing and Trading Report – Options Annual Income


TW Options Annual Income week 42
 

Our dividend goal and future dividends


TW Received vs Projected Dividends week 42
 

We have accomplished our dividend income goal. We planned to make $1,071 of dividend income this year and we finished receiving $2,019.26. However, we accumulated enough shares to start making $4,048.88 a year.
 

TW Received vs Future Dividends week 42


Our account cumulative return


The chart below indicates our cumulative adjusted return. It shows how the last week’s selloff shook down our returns but we are recovering along with the market.
 

TW cumulative return wk 42
 

TW win ratio wk 42
 

As of today, our account cumulative return is 51.87% (note, data in this section are since March 13, 2021, only as that is the date we started tracking these metrics. Thus the results are skewed a bit and will show full picture next year.).


Conclusion of our investing and trading report


This week our options trading was within our expectations and I believe, the rest of the month will be even better.

We will continue accumulating the dividend growth stocks in our portfolio to reach 100 shares and continue building our cash reserves so we have enough cash to sustain any market corrections and be able to buy depressed stocks.

We will report our next week’s results next Saturday. Until then, good luck and good trading!


We all want to hear your opinion on the article above:
No Comments


Posted by Martin October 16, 2021
No Comments


2021 Week 41 investing and trading report


The second week of October 2021 ended great as we will show you in this investing and trading report. Our income from selling options last week reached $3,829.00 in the week alone and delivering $5,225.00 in October. That makes it a third-best month this year trading options. But October is not over yet. We may make more cash before the month-end.

And, in the meantime, please, enjoy our weekly investing and trading report.


Here is our investing and trading report:


Account Value: $89,261.54 $4,236.27 4.98%
Options trading results
Options Premiums Received: $3,829.00    
01 January 2021 Options: $4,209.00 +16.65%  
02 February 2021 Options: $4,884.00 +15.41%  
03 March 2021 Options: $5,258.00 +12.79%  
04 April 2021 Options: $2,336.00 +4.30%  
05 May 2021 Options: $6,346.00 +9.22%  
06 June 2021 Options: $4,677.00 +6.37%  
07 July 2021 Options: $3,865.00 +5.14%  
08 August 2021 Options: $6,133.00 +7.40%  
09 September 2021 Options: $2,353.00 +2.97%  
10 October 2021 Options: $5,225.00 +5.85%  
Options Premiums YTD: $45,286.00 +50.73%  
Dividend income results
Dividends Received: $90.00    
01 January 2021 Dividends: $53.04    
02 February 2021 Dividends: $63.00    
03 March 2021 Dividends: $30.31    
04 April 2021 Dividends: $139.70    
05 May 2021 Dividends: $167.45    
06 June 2021 Dividends: $168.56    
07 July 2021 Dividends: $228.62    
08 August 2021 Dividends: $780.09    
09 September 2021 Dividends: $176.60    
10 October 2021 Dividends: $155.14    
Dividends YTD: $2,003.99    
Portfolio metrics
Portfolio Yield: 4.45%    
Portfolio Dividend Growth: 8.13%    
Ann. Div Income & YOC in 10 yrs: $18,414.72 17.38%  
Ann. Div Income & YOC in 20 yrs: $150,819.58 142.35%  
Ann. Div Income & YOC in 25 yrs: $679,084.61 640.94%  
Ann. Div Income & YOC in 30 yrs: $4,820,916.87 4,550.14%  
Portfolio Alpha: 43.65%    
Portfolio Weighted Beta: 0.67    
CAGR: 638.15%    
AROC: 52.36%    
TROC: 13.37%    
Our 2021 Goal
2021 Dividend Goal: $1,071.42 187.04% Accomplished
2021 Portfolio Value Goal: $42,344.06 210.80% Accomplished
6-year Portfolio Value Goal: $175,000.00 51.01%  
10-year Portfolio Value Goal: $1,000,000.00 8.93%  


Dividend Investing and Trading Report

 
Last week, the markets staged a strong recovery and we grew our net-liq by 4.98%. We had 4 strangles and spreads expiring last Friday and next week we will be reopening those trades. We also purchased dividend growth stocks and SPXL and SSO shares to get our portfolio ready for rapid growth.

Our options income reached impressive $3,829.00 dollars received in premiums. That makes $5,225.00 in October so far. Our third best month in premium income.

Our dividend income was steady, we have received $90.00 in dividends last week, making October at $155.14 dividend income.

We are also growing our dividend growth portfolio and here you can see our dividend income per stock holding and how they contribute to the overall dividend income:

 
Annual Dividend Payout week 41
 

Options Investing and Trading Report

 
As I mentioned above, we generated $3,829.00 options income so far this month and we expect to generate more. I hope, the market would stay pressured for a while so I can keep buying cheaper stocks and making more money on options.

Last week we only rolled our positions and it was extremely profitable. I keep saying that these selloffs are great for investors. All they need to do is stop panicking, assess the situation (which means learning how to evaluate the stock market as a whole), and instead of panic selling engage in buying. We rolled our options trades and made over $3k in premiums, but this selloff also allowed us to buy more stock.

And when the market shot up on Thursday and Friday, we rolled some trades again and generated even more money.
 

You can watch all our trades in this spreadsheet. You can watch the spreadsheet and look for a “NEW” indication next to the trading date. When the indicator shows up, it is typically good for up to 3 days to follow that trade.
 

Expected Future Dividend Income

 
We received $90.00 in dividends last week. It is still slow that I would like to see but we are still in an accumulation phase so I do not care much about the total amount of dividends I am receiving today. I am building a portfolio with the expectation of getting large dividends in the future. And in the meantime, I learned how to trade options to generate consistent income today.

 
Our projected annual dividend income in 10 years is $16,336.97 but that is if we do absolutely nothing and let our positions grow on their own.

We are also set to receive a $4,053.22 annual dividend income. We are 23.27% of our 10 year goal.

 
Future Divi on YOC week 41
 

The chart above shows how our future dividend income is based on the future yield on cost and what dividend income we may expect in the future. The expected dividend growth depends on what stocks we are adding to our portfolio and the stocks’ 3 years average dividend growth rate. It is interesting to see what passive income we may enjoy 10, 20, 25, or 30 years from now.


Market value of our holdings

 
Our non-adjusted stock holdings market value increased from $111,297.56 to $115,926.73 last week.

However, we still expect the value of our holdings to grow and outperform the market long term. Many positions in our portfolio are new and “young” and they did not have enough time to show gains yet. We were building cash reserves to buy depressed stocks during selloffs and corrections as well as negative analysts reports (as long as the company is still good long term).

 
Stock holdings week 41
 

Our goal is to accumulate 100 shares of each stock of our interest and we are getting to that goal.
 

Investing and trading ROI


Our options trading delivered a 5.85% monthly ROI in October 2021, totaling a 50.73% ROI YTD. We again exceeded our 45% annual revenue selling options against dividend stocks target!

Our account grew by 333.89% beating our projections and the market.
 

Our options trading averaged $4,528.60 per month this year. If this trend continues, we are on track to make $54,343.20 trading options in 2021. As of today, we have made $45,286.00 trading options.
 

Old SPX trades repair


This week, we didn’t adjust any SPX trades. Our goal is to reach a level that we will be eligible for portfolio margin (PM). Once that happens, we plan on converting the existing SPX Iron Condors to strangles and trade these positions as strangles.

With RegT margin, the capital requirements would be approx. $66,586.06 and that is beyond our means. With PM the requirement for margin would drop to around $10k. That is doable in our account. Once we reach this level, we will start adjusting our SPX trades accordingly. Until then, we will just roll these trades around.


Accumulating Growth Stocks


Last week we have added shares of SSO and SPXL to our holdings according to our plan and rules. Our goal for the nearest future is to accumulate 25% of our net-liq in these shares and maintain the weight. If the weight goes above 25% we will start trimming the positions, and when the weight goes below 25% we will start accumulating the positions. Any leftovers will be reinvested to the dividend growth stocks, options trades, or reserves.


Accumulating Rules


Our rule is to buy shares of growth stocks using 20% of any BP value that is above the $3,000 limit. For example, if our BP ends at $3,900, we can buy shares using 20% of $900 or $180 to accumulate shares of any growth stocks.

Why such a rule? Up to today, I was scaling up my trades and portfolio. That resulted in rapid growth but also all our proceeds were constantly locked in the trades. If we want to live off of our dividends and options income, we cannot have them locked by new trades. We need to start accumulating “cash available to withdraw”. Therefore, I am shifting my trading to trade the same amount of contracts and invest only a certain excess of the accumulated cash.


Accumulating Dividend Growth Stocks


Last week, we added shares of VICI and accumulated 100 shares. That means we accomplished our accumulation goal in this stock and we will now move to accumulate a different stock (possibly The Toronto-Dominion Bank (TD) or Walgreens Boots Alliance, Inc. (WBA)).

Our goal is to reach 100 shares of high-quality dividend stocks and build a weekly dividend income as per this calendar, but we have made no changes to this goal last week:
 

Weekly dividends income calendar
 
You can see the entire spreadsheet here.


Market Outlook


In our previous post on this blog, we speculated whether selling was over and it was time to buy the dip again. We also indicated that the market started creating a new higher low (HL) and although it was still questionable, Friday’s follow-through confirmed the trend. This is what we posted before:


Abd this is what happened on Thursday and Friday:
 

SPX 2021 1016

 
We may see some bouncing around but it is my opinion that this market is heading to a new all-time high.

If you want to learn more about the stock market, events that moved the market last week and will likely impact it in the near future, I recommend you to subscribe to our weekly newsletter. Knowing where the market is heading and knowing when you should expect its reversal can benefit your trading and investing. Subscribe and you get one month free.


Investing and trading report in charts


Account Net-Liq


TW Account Net-Liq week 41


Account Stocks holding

 
TW Account holdings week 41
 

Last week, S&P 500 grew 54.57% since we opened our portfolio while our portfolio grew 26.84%. On YTD basis, the S&P 500 grew 24.73% and our portfolio 19.86%.

But the numbers above apply to our stock holdings in our account, not the overall account net-liq growth. Our overall account beats the market growing by 333.89%!
 

Stock holdings Growth YTD

 
TW Account holdings Growth YTD
 

I expect our stock holdings to start outperforming the market as they mature. However, these are just our stock holdings. The entire portfolio beats the market by far thanks to monetizing those positions.

Our 10-year goal is to grow this account to $1,000,000.00 value in ten years. We are in year two and we accomplished 8.93% of that goal.

Our 6-year goal is to reach $175,000 account value to be eligible for portfolio margin (PM) and today we accomplished 51.01% of that goal.

Our 2021 year goal is to grow this account to a $42,344.00. We already accomplished this goal.


Investing and Trading Report – Options Monthly Income

 
TW Options Income week 41
 

Investing and Trading Report – Options Annual Income


TW Options Annual Income week 41
 

Our dividend goal and future dividends


TW Received vs Projected Dividends week 41
 

We have accomplished our dividend income goal. We planned to make $1,071 of dividend income this year and we finished receiving $2,003.99. However, we accumulated enough shares to start making $4,053.22 a year.
 

TW Received vs Future Dividends week 41


Our account cumulative return


The chart below indicates our cumulative adjusted return. It shows how the last week’s selloff shook down our returns but we are recovering along with the market.
 

TW cumulative return wk 41
 

TW win ratio wk 41
 

As of today, our account cumulative return is 48.24% (note, data in this section are since March 13, 2021, only as that is the date we started tracking these metrics. Thus the results are skewed a bit and will show full picture next year.).


Conclusion of our investing and trading report


This week our options trading was within our expectations and I believe, the rest of the month will be even better.

We will continue accumulating the dividend growth stocks in our portfolio to reach 100 shares and continue building our cash reserves so we have enough cash to sustain any market corrections and be able to buy depressed stocks.

We will report our next week’s results next Saturday. Until then, good luck and good trading!


We all want to hear your opinion on the article above:
No Comments


Posted by Martin October 14, 2021
No Comments


Time to buy the dip again?


Is the market telling us to buy the dip again? If you are a subscriber to our newsletter, last week I posted my expectation about the market sliding further down due to technical damage to the chart. My expectation was to reach a 200-day moving average at a 4,150 level (or around it). My exact target was $4,230. But overall, I was still bullish about this market. I wrote:

“We still need to put this selling into perspective. This is just a pullback in the context of a secular bull market and that is completely normal behavior. To determine whether you should respect this selling or ignore it, you need to look at earnings estimates. And as you could see […], earnings estimate for the rest of the year and next year are still positive… We are still in a secular bull market and people tend to mix secular and cyclical markets together. They confuse a cyclical bear market with a secular bear market and predict catastrophic outcomes. But it takes time for the secular market to show its end and when it happens, we will be able to recognize it and adjust our portfolio accordingly.”

And here is the chart, I posted in our newsletter:

 
S&P 500 rebound
 

Today, we have received some economic reports that changed the narrative, significantly. The jobless claim came in indicating significant improvement in unemployment – 320,000 claims were expected but only 293,000 new claims were reported. On top of that, banks earnings reports topped expectations setting an exciting tone for market participants that the earnings are really still within expectations and beating those expectations (again, something I have been writing in my newsletter for weeks that no one was revising their earnings outlooks yet, only a handful of companies issued warnings due to supply chain issues, but overall, EPS estimates remained same).

This is what the market is displaying today:

 
S&P 500 buy the dip
 

After a series of lower lows (LL) and lower highs (LH), the market broke above the downward sloping trend creating its first higher low (HL). It still can fail but the candle is pretty much convincing that we are experiencing a reversal (market up +1.39%). And if more companies come out with better than expected earnings reports, this market will resume its rally. And that is a very high chance of it to happen as I wrote in my newsletter that:

“Heading into the end of the third quarter, 103 S&P 500 companies have issued [positive] EPS guidance for the quarter. This number is above the 5-year average of 100.”

If on Friday, we see a confirmation, it will be a good opportunity to return to the bullish case again and buy the dip.


We all want to hear your opinion on the article above:
No Comments


Posted by Martin October 09, 2021
No Comments


2021 Week 40 investing and trading report


October 2021 has started last week and it started on a good note. Our account has recovered fully and went on a growth mode again. Our net-liquidating value, as you will see in this investing and trading report jumped up significantly, our buying power also went up allowing us to open a few new trades, and we continued accumulating speculative stocks that we believe will ensure rapid portfolio growth over the long run.

There is still a lot of fear out there, people worrying about things that are either not important or exaggerating issues that are not a problem yet. As you will see, and if you are a subscriber to our newsletter, you will learn more details, that the US economy is still humming well and set on the growth track. It is stunning to see people being blinded by a fact that the economy is running in waves and you have small waves and big waves. We should be worried about the big waves and not the small ones and I strongly believe, that the September pullback is a small wave of a typical economic cycle. Even if we see it as an economic pullback, it will rebound and continue higher.

Study the market’s history, the last secular bull market took 20 years (1980 – 2000), we are in a secular market that has taken 12 years only. And it is pretty normal that you will see cyclical bears, pullbacks, and corrections in between. Don’t freak out where you do not need to.

And, in the meantime, please, enjoy our weekly investing and trading report.


Here is our investing and trading report:


Account Value: $85,025.27 $5,804.79 7.33%
Options trading results
Options Premiums Received: $1,396.00    
01 January 2021 Options: $4,209.00 +16.65%  
02 February 2021 Options: $4,884.00 +15.41%  
03 March 2021 Options: $5,258.00 +12.79%  
04 April 2021 Options: $2,336.00 +4.30%  
05 May 2021 Options: $6,346.00 +9.22%  
06 June 2021 Options: $4,677.00 +6.37%  
07 July 2021 Options: $3,865.00 +5.14%  
08 August 2021 Options: $6,133.00 +7.40%  
09 September 2021 Options: $2,353.00 +2.97%  
10 October 2021 Options: $1,396.00 +1.64%  
Options Premiums YTD: $41,457.00 +48.76%  
Dividend income results
Dividends Received: $65.14    
01 January 2021 Dividends: $53.04    
02 February 2021 Dividends: $63.00    
03 March 2021 Dividends: $30.31    
04 April 2021 Dividends: $139.70    
05 May 2021 Dividends: $167.45    
06 June 2021 Dividends: $168.56    
07 July 2021 Dividends: $228.62    
08 August 2021 Dividends: $780.09    
09 September 2021 Dividends: $176.60    
10 October 2021 Dividends: $65.14    
Dividends YTD: $1,913.99    
Portfolio metrics
Portfolio Yield: 4.18%    
Portfolio Dividend Growth: 8.13%    
Ann. Div Income & YOC in 10 yrs: $16,336.97 15.77%  
Ann. Div Income & YOC in 20 yrs: $124,089.30 119.82%  
Ann. Div Income & YOC in 25 yrs: $525,647.30 507.55%  
Ann. Div Income & YOC in 30 yrs: $3,436,221.65 3,317.94%  
Portfolio Alpha: 41.48%    
Portfolio Weighted Beta: 0.69    
CAGR: 635.14%    
AROC: 37.10%    
TROC: 16.78%    
Our 2021 Goal
2021 Dividend Goal: $1,071.42 178.64% Accomplished
2021 Portfolio Value Goal: $42,344.06 200.80% Accomplished
6-year Portfolio Value Goal: $175,000.00 48.59%  
10-year Portfolio Value Goal: $1,000,000.00 8.50%  


Dividend Investing and Trading Report

 
Last week, as the markets have shown some recovery, we grew our net-liq value by 7.33%. If the trend in S&P500 continues I expect rapid growth (mostly due to SSO and SPXL holdings) of our net liq in the coming weeks. If the current trend doesn’t hold (see our market outlook below or subscribe to our newsletter for a full market outlook analysis), our net-liq may drop again. But it will be a temporary drop. A good opportunity to buy more shares.

Our dividend income was steady, we have received $65.14 in dividends last week, making October at $65.14 dividend income.

Here are our holdings today:

 
Annual Dividend Payout week 40
 

Options Investing and Trading Report

 
Our options income started great in October. We generated $1,396.00 options income so far this month and we expect to generate more. I hope, the market would stay pressured for a while so I can keep buying cheaper stocks and making more money on options.

Last week our buying power (BP) went above the $2,000 limit we set for October and that allowed us to open new trades. We sold strangles against AAPL, WBA, KBE, and BAC stocks.

Other than that, we rolled our strangles against AAPL, KBE, MU, OXY, XOM, and we rolled our KBE covered call higher (for a credit).
 

You can watch all our trades in this spreadsheet. You can watch the spreadsheet and look for a “NEW” indication next to the trading date. When the indicator shows up, it is typically good for up to 3 days to follow that trade.
 

Expected Future Dividend Income

 
We received $65.14 in dividends last week. It is still slow that I would like to see but we are still in an accumulation phase so I do not care much about the total amount of dividends I am receiving today. I am building a portfolio with the expectation of getting large dividends in the future. And in the meantime, I learned how to trade option to generate consistent income today.

 
Our projected annual dividend income in 10 years is $16,336.97 but that is if we do absolutely nothing and let our positions grow on their own.

We are also set to receive a $3,940.36 annual dividend income. We are 24.12% of our 10 year goal.

 
Future Divi on YOC week 40
 

The chart above shows how our future dividend income is based on the future yield on cost and what dividend income we may expect in the future. The expected dividend growth depends on what stocks we are adding to our portfolio and the stocks’ 3 years average dividend growth rate. It is interesting to see what passive income we may enjoy 10, 20, 25, or 30 years from now.


Market value of our holdings

 
Our non-adjusted stock holdings market value increased from $108,138.05 to $111,297.56 last week.

However, we still expect the value of our holdings to grow and outperform the market long term. Many positions in our portfolio are new and “young” and they did not have enough time to show gains yet. We were building cash reserves to buy depressed stocks during selloffs and corrections as well as negative analysts reports (as long as the company is still good long term).

 
Stock holdings week 40
 

Our goal is to accumulate 100 shares of each stock of our interest and we are getting to that goal.
 

Investing and trading ROI


Our options trading delivered a 1.64% monthly ROI in October 2021, totaling a 48.76% ROI YTD. We again exceeded our 45% annual revenue selling options against dividend stocks target!

Our account grew by 313.30% beating our projections and the market.
 

Our options trading averaged $4,145.70 per month this year. If this trend continues, we are on track to make $49,748.40 trading options in 2021. As of today, we have made $41,457.00 trading options.
 

Old SPX trades repair


This week, we didn’t adjust any SPX trades. Our goal is to reach a level that we will be eligible for portfolio margin (PM). Once that happens, we plan on converting the existing SPX Iron Condors to strangles and trade these positions as strangles.

With RegT margin, the capital requirements would be approx. $66,586.06 and that is beyond our means. With PM the requirement for margin would drop to around $10k. That is doable in our account. Once we reach this level, we will start adjusting our SPX trades accordingly. Until then, we will just roll these trades around.


Accumulating Growth Stocks


Last week we have added 5 shares of SSO and 9 shares of SPXL to our holdings according to our plan and rules. Our goal for the nearest future is to accumulate 25% of our net-liq in these shares and maintain the weight. If the weight goes above 25% we will start trimming the positions, and when the weight goes below 25% we will start accumulating the positions. Any leftovers will be reinvested to the dividend growth stocks, options trades, or reserves.


Accumulating Rules


Our rule is to buy shares of growth stocks using 20% of any BP value that is above the $2,000 limit. For example, if our BP ends at $2,900, we can buy shares using 20% of $900 or $180 to accumulate shares of any growth stocks.

Why such a rule? Up to today, I was scaling up my trades and portfolio. That resulted in rapid growth but also all our proceeds were constantly locked in the trades. If we want to live off of our dividends and options income, we cannot have them locked by new trades. We need to start accumulating “cash available to withdraw”. Therefore, I am shifting my trading to trade the same amount of contracts and invest only a certain excess of the accumulated cash.


Accumulating Dividend Growth Stocks


Last week, we didn’t add any new dividend growth stocks.

Our goal is to reach 100 shares of high-quality dividend stocks and build a weekly dividend income as per this calendar, but we have made no changes to this goal last week:
 

Weekly dividends income calendar
 
You can see the entire spreadsheet here.


Market Outlook


The stock market rallied most of the last week and reached the upper trend line of a downward sloping channel. We need the market to break above that level and move higher. If it doesn’t, expect more selling. We are seeing the market creating lower highs and lower lows. From the TA perspective, it is a bearish trend. We need that trend to be broken.


Although anything can happen in the stock market at any time, I do not see this trend break but either continue going lower or wobbling sideways with the slight downward push. My expectation for the upcoming week is still down to the $4,230 level unless some good economic news (such as better job report, consumer index, PPI, or retail sales) comes that would push the market up. The market can also run on the ceiling debt optimism (rumors) and then pull back on the news on October 18th.

Definitely, we are at crossroads and have to wait. But, these lower prices are a great opportunity.
 

If you want to learn more about the stock market, events that moved the market last week and will likely impact it in the near future, I recommend you to subscribe to our weekly newsletter. Knowing where the market is heading and knowing when you should expect its reversal can benefit your trading and investing. Subscribe and you get one month free.


Investing and trading report in charts


Account Net-Liq


TW Account Net-Liq week 40


Account Stocks holding

 
TW Account holdings week 40
 

Our stock holdings still do not beat the market, although when I was preparing this report and updating our Watch list page, I noticed an interesting discrepancy (if I can call it that way) between the market’s return and our account stock holdings return.

I compared our stock holdings at the end of August (week 35 report) and saw that the market returned 56.79% since 04/01/2019 (it is the inception date of our portfolio) and our stock holdings returned 20.94% at that time.

Today, the market is returning 51.81% but our portfolio stock holdings returned 24.66%. Putting it together, the market return went down, while our stock holdings return went up.

Last week, S&P 500 grew 51.81% since we opened our portfolio while our portfolio grew 24.66%. On YTD basis, the S&P 500 grew 21.96% and our portfolio 17.67%.

But the numbers above apply to our stock holdings in our account, not the overall account net-liq growth. Our overall account beats the market growing by 313.30%!
 

Stock holdings Growth YTD

 
TW Account holdings Growth YTD
 

I expect our stock holdings to start outperforming the market as they mature. However, these are just our stock holdings. The entire portfolio beats the market by far thanks to monetizing those positions.

Our 10-year goal is to grow this account to $1,000,000.00 value in ten years. We are in year two and we accomplished 8.50% of that goal.

Our 6-year goal is to reach $175,000 account value to be eligible for portfolio margin (PM) and today we accomplished 48.59% of that goal.

Our 2021 year goal is to grow this account to a $42,344.00. We already accomplished this goal.


Investing and Trading Report – Options Monthly Income

 
TW Options Income week 40
 

Investing and Trading Report – Options Annual Income


TW Options Annual Income week 40
 

Our dividend goal and future dividends


TW Received vs Projected Dividends week 40
 

We have accomplished our dividend income goal. We planned to make $1,071 of dividend income this year and we finished receiving $1,913.99. However, we accumulated enough shares to start making $3,940.36 a year.
 

TW Received vs Future Dividends week 40


Our account cumulative return


The chart below indicates our cumulative adjusted return. It shows how the last week’s selloff shook down our returns but we are recovering along with the market.
 

TW cumulative return wk 40
 

TW win ratio wk 40
 

As of today, our account cumulative return is 41.20% (note, data in this section are since March 13, 2021, only as that is the date we started tracking these metrics. Thus the results are skewed a bit and will show full picture next year.).


Conclusion of our investing and trading report


This week our options trading was within our expectations and I believe, the rest of the month will be even better.

We will continue accumulating the dividend growth stocks in our portfolio to reach 100 shares and continue building our cash reserves so we have enough cash to sustain any market corrections and be able to buy depressed stocks.

We will report our next week’s results next Saturday. Until then, good luck and good trading!


We all want to hear your opinion on the article above:
No Comments


Posted by Martin October 09, 2021
No Comments


Dividend Growth Stocks to Accumulate in October 2021


October 2021 is starting and here is a list of stocks we would like to focus on accumulating. We have the entire watch list of stocks we like but in that watch list, not all stocks are a buy. They are just candidates. We then narrow that list down to stocks we want to trade options against and stocks we want to be buying.

But this time our accumulation program will be slightly different as we need to narrow our focus down a bit. This list became too broad and it was difficult to focus on the goal. On top of it, we imposed rules on when we can accumulate the stocks. We can use 20% of any cash above the $2,000 limit.


Dividend growth stocks to accumulate in October 2021


Here is the list we would like to focus on this month. It also contains our progress from previous months. We pick a stock in the list and keep buying until we reach 100 shares. This helps me to focus on the goal and not get distracted too much by other stocks and tips. Sometimes, when I have money available to invest, I get paralyzed asking myself, what am I going to buy now? This list helps me to buy stocks I previously selected as good stocks to buy.

But since the list is getting broad, we are narrowing it to accumulating SPXL and SSO stocks in October only. No other shares will be purchased until we accumulate 25% of the entire account net-liq.

 
October 2021 dividend growth stocks
 

If you are interested in knowing how we select stocks to our watch list, you need to subscribe to our challenge account program where we will be explaining the process.

Do your own due diligence if you decide to invest in these stocks. The information here is believed to be accurate but may have changed since publishing.
 

We will hold these stocks forever. We will sell them only when they no longer meet our dividend investing criteria (for example the company cuts the dividend) or the stock significantly underperform and better opportunities present themselves. If these companies keep paying dividends and increasing them, we will hold.

We will also sell options around these positions to offset our cost basis. During selloffs and recoveries, we may also buy call options to capture the recovery. If you are interested to see what we are buying and what options we are selling/buying, subscribe to our program.


We all want to hear your opinion on the article above:
No Comments


Posted by Martin October 03, 2021
No Comments


September 2021 $100 Challenge account review


September 2021 is over and we continue building our challenge account. We are currently tracking our goal, our metrics are slightly below the goal but we are moving higher.

As I mentioned before, building a small account is a slow process but as time goes by, it will speed up and you will be pleased with the results.

We started this program six months ago and it is intended for people who have a small account and very little money to invest. Every month we deposit $100 to our account and invest in stocks to generate income. That income is then used to trade options and generate even more income that can be reinvested.


Accumulation phase

 
The account is slightly underperforming our goal but it is on the path to success. We are now trading small trades (strangles) and we will continue accumulating shares for our next options trade. The strangle trades are consuming collateral buying power but as they near towards expiration we will see a jump in BP and net-liq.

We are trading strangles because they are easier to manage compared to Iron Condors, but they are also a bit more expensive as far as capital requirements go. That is why choosing good stocks to trade is crucial. Choose safe, stable stocks, providing enough premium and stability. And that is what we are doing.
 

September 2021 Challenge account review


MONTH GOAL $$ ACTUAL $$
June 2021: $203.00 $202.67
July 2021: $306.00 $334.75
August 2021: $409.00 $397.71
September 2021: $512.00 $476.91
October 2021: $615.00  
November 2021: $718.00  
December 2021: $821.00  
January 2022: $924.00  
February 2022: $1,027.00  
March 2022: $1,130.00  
April 2022: $1,233.00  
May 2022: $1,336.00  


$100 Challenge account review

 
From the chart above, the red dot (line) indicates the current account value, compared to the blue line (plan). Our account is trailing our goal. When trading naked options, expect volatility in your net-liq. That can be seen by some as a disadvantage. When trading spreads, your net-liq will be stabilized by neutralizing delta. With naked options, you would have to choose other instruments to do so, for example owning stocks to neutralize your call side. We do not have this yet as our account is small, but we are building our position.
 

September 2021 Overall Challenge account review

 
The chart below indicates our account value compared to the overall goal and plan to grow $100 investment into a $75,000 portfolio. As of today, we are at the beginning of our journey.

YEAR CONTRIBUTIONS $$ GOAL $$ ACTUAL $$
Year 0: $100.00 $100.00 $100.00
Year 1: $1,300.00 $1,336.00 $476.91
Year 2: $2,500.00 $3,016.96  
Year 3: $3,700.00 $5,303.07  
Year 4: $4,900.00 $8,412.17  
Year 5: $6,100.00 $12,640.55  
Year 6: $7,300.00 $18,391.15  
Year 7: $8,500.00 $26,211.96  
Year 8: $9,700.00 $36,848.27  
Year 9: $10,900.00 $51,313.64  
Year 10: $12,100.00 $70,986.56  


$100 Challenge account review goal


September 2021 Challenge account Income


Total Invested in Stocks $193.57
Total Unrealized Profit -$6.33
Total Realized Profit $2.21
Strangles Income $92.00
Dividends Income $6.46


August 2021 Cumulative return Challenge account review


As of today, our challenge account provided a -7.47% monthly cumulative return.
 

$100 Challenge account review goal

 
$100 Challenge account review goal


If you want to see what investments we take, what trades and strategies we will use to grow this small account join our program today and grow your money too. We engage in safe investments, select strategies to maximize winning trades, and grow our portfolio. And you can do it too, today! We do not provide quick rich promises, gambling, or reckless strategies. We want our portfolio to grow steadily and preserving our capital while maximizing returns.


We all want to hear your opinion on the article above:
No Comments


Posted by Martin October 02, 2021
No Comments


2021 Week 39 investing and trading report


September is over! What a month! We were used to sharp declines and even sharper recoveries but in September, this was a slow and dreadful decline. That’s why it possibly felt so painful. The market was literally declining the entire month. We only had a few green days that were sold off the very next day. The dip buyers simply refused to step in and buy the dip on all sorts of fears, bogus or real. In this investing and trading report, we will report our performance, investing and trading in stocks and options, and how we dealt with this market.


Here is our investing and trading report:


Account Value: $79,220.48 -$2,269.94 -2.79%
Options trading results
Options Premiums Received: $1,176.00    
01 January 2021 Options: $4,209.00 +16.65%  
02 February 2021 Options: $4,884.00 +15.41%  
03 March 2021 Options: $5,258.00 +12.79%  
04 April 2021 Options: $2,336.00 +4.30%  
05 May 2021 Options: $6,346.00 +9.22%  
06 June 2021 Options: $4,677.00 +6.37%  
07 July 2021 Options: $3,865.00 +5.14%  
08 August 2021 Options: $6,133.00 +7.40%  
09 September 2021 Options: $2,353.00 +2.97%  
Options Premiums YTD: $40,061.00 +50.57%  
Dividend income results
Dividends Received: $45.86    
01 January 2021 Dividends: $53.04    
02 February 2021 Dividends: $63.00    
03 March 2021 Dividends: $30.31    
04 April 2021 Dividends: $139.70    
05 May 2021 Dividends: $167.45    
06 June 2021 Dividends: $168.56    
07 July 2021 Dividends: $228.62    
08 August 2021 Dividends: $780.09    
09 September 2021 Dividends: $176.60    
Dividends YTD: $1,848.85    
Portfolio metrics
Portfolio Yield: 4.37%    
Portfolio Dividend Growth: 8.13%    
Ann. Div Income & YOC in 10 yrs: $17,185.57 16.86%  
Ann. Div Income & YOC in 20 yrs: $137,415.75 134.80%  
Ann. Div Income & YOC in 25 yrs: $606,843.94 595.28%  
Ann. Div Income & YOC in 30 yrs: $4,196,753.15 4,116.81%  
Portfolio Alpha: 43.24%    
Portfolio Weighted Beta: 0.70    
CAGR: 625.66%    
AROC: 50.85%    
TROC: 16.49%    
Our 2021 Goal
2021 Dividend Goal: $1,071.42 172.56% Accomplished
2021 Portfolio Value Goal: $42,344.06 187.09% Accomplished
6-year Portfolio Value Goal: $175,000.00 45.27%  
10-year Portfolio Value Goal: $1,000,000.00 7.92%  


Dividend Investing and Trading Report

 
Two weeks ago, the market started looking great as we were recovering from the prior selling. But then it all went down the hill last Monday. As is typical for the markets, what you see was an overreaction. The media was telling us that the markets are afraid of inflation, labor shortage, high-interest rates, a slowing economy, Powell, China, debt ceiling, and ghosts. But many of the fears are typically bogus or part of a typical economic cycle. Nothing goes up forever. Be happy if it just slows down.

Last week we lost our net-liq value by 2.79%. Overall, in September our account lost -4.41% which is less than the entire market. The S&P 500 lost -5.7%. In this perspective, our account beat the market.

Our dividend income was steady, we have received $45.86 in dividends last week, closing September at $176.60 dividend income. However, our dividend projections changed from last week. Our overall future annual dividend income dipped. The culprit was OMF which was showing $743 annual dividend income for many weeks and it suddenly dropped to $280 a year dividend income. I couldn’t find any reason, the dividend has not been cut, so I can guess that in the previous weeks, special dividends were included. I will investigate more.

Here is what our dividend income looked like in the previous weeks, and here are our holdings today:

 
Annual Dividend Payout week 39
 

Options Investing and Trading Report

 
Our options income was spectacular in September. We closed the month with $2,353.00 options income but that is after we purchased LEAPS options worth $5,000.00. If we haven’t bought those options, our September income would have been $7,353.00 making it the best month ever. But we had to take the opportunity of the market selloff.

That’s why I like these selloffs as they truly present a great opportunity. Great income opportunity and great chance to buy more positions cheap.

Last week we didn’t trade any new trades although we could open 2 trades that expired in the last expiration cycle. According to our rules, we can reopen expired trades only but only if the buying power is above $2,000 or more and the new trades won’t drop the BP below that limit.

The entire last week, our BP was below that limit the entire week. Thus we couldn’t open any new trades.

We only rolled a few existing trades that were slipping and lowering our BP. Rolling those trades helped to release that BP. We rolled AES, AXP, BA, DKNG, KBE, MO, O, PBCT, SPY, TSN, and WEN strangles and spreads. All trades delivered great premiums and helped to release our buying power.

We only opened one new protective butterfly against SPY as a hedge. If S&P500 drops to $4,100 a share and the trade will be close to expiration, we will bank a nice premium that should offset any portfolio unrealized losses.
 

You can watch all our trades in this spreadsheet. You can watch the spreadsheet and look for a “NEW” indication next to the trading date. When the indicator shows up, it is typically good for up to 3 days to follow that trade.
 

Expected Future Dividend Income

 
Our dividend income was slower last week. We received $45.86 only for dividends but I am still happy with it. We are in an accumulation phase so I do not care much about the total amount of dividends I am receiving. I am building the portfolio and I know it will bring fruits later.

 
Our projected annual dividend income in 10 years is $17,185.57 but that is if we do absolutely nothing and let our positions grow on their own.

We are also set to receive a $3,948.98 annual dividend income. We are 22.98% of our 10 year goal. This is however a drop from our previous weeks due to OMF dividend reporting.

 
Future Divi on YOC week 39
 

The chart above shows how our future dividend income is based on the future yield on cost and what dividend income we may expect in the future. The expected dividend growth depends on what stocks we are adding to our portfolio and the stocks’ 3 years average dividend growth rate. It is interesting to see what passive income we may enjoy 10, 20, 25, or 30 years from now.


Market value of our holdings

 
Our non-adjusted stock holdings market value decreased from $109,309.61 to $108,138.05 last week due to the market selloff.

However, we still expect the value of our holdings to grow and outperform the market long term. Many positions in our portfolio are new and “young” and they did not have enough time to show gains yet. We were building cash reserves to buy depressed stocks during selloffs and corrections as well as negative analysts reports (as long as the company is still good long term).

 
Stock holdings week 39
 

Our goal is to accumulate 100 shares of each stock of our interest and we are getting to that goal.
 

Investing and trading ROI


Our options trading delivered a 2.97% monthly ROI in September 2021, totaling a 50.57% ROI YTD. We again exceeded our 45% annual revenue selling options against dividend stocks target!

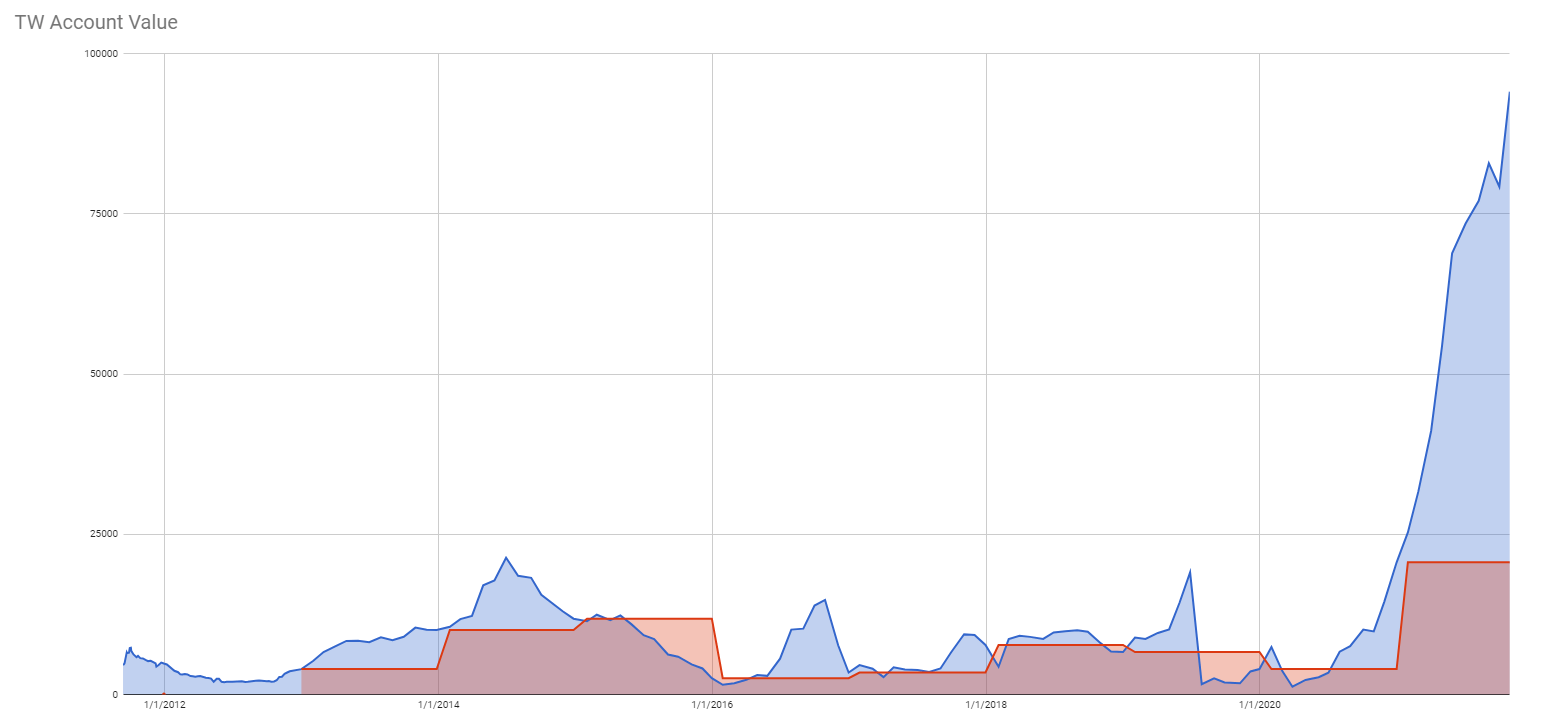
Our account grew by 285.08% beating our projections and the market.
 

Our options trading averaged $4,451.22 per month this year. If this trend continues, we are on track to make $53,414.67 trading options in 2021. As of today, we have made $40,061.00 trading options.
 

Old SPX trades repair


This week, we didn’t adjust any SPX trades. Our goal is to reach a level that we will be eligible for portfolio margin (PM). Once that happens, we plan on converting the existing SPX Iron Condors to strangles and trade these positions as strangles.

With RegT margin, the capital requirements would be approx. $66,586.06 and that is beyond our means. With PM the requirement for margin would drop to around $10k. That is doable in our account. Once we reach this level, we will start adjusting our SPX trades accordingly. Until then, we will just roll these trades around.


Accumulating Growth Stocks


Last week we have not bought any growth stocks because our BP value was below the $2,000 limit.


Accumulating Rules


Our rule is to buy shares of growth stocks using 20% of any BP value that is above the $2,000 limit. For example, if our BP ends at $2,900, we can buy shares using 20% of $900 or $180 to accumulate shares of any growth stocks.

Why such a rule? Up to today, I was scaling up my trades and portfolio. That resulted in rapid growth but also all our proceeds were constantly locked in the trades. If we want to live off of our dividends and options income, we cannot have them locked by new trades. We need to start accumulating “cash available to withdraw”. Therefore, I am shifting my trading to trade the same amount of contracts and invest only a certain excess of the accumulated cash.


Accumulating Dividend Growth Stocks


Last week, we didn’t add any new dividend growth stocks because our BP was below the limit the entire week. See our rules above.

Our goal is to reach 100 shares of high-quality dividend stocks and build a weekly dividend income as per this calendar, but we have made no changes to this goal last week:
 

Weekly dividends income calendar
 
You can see the entire spreadsheet here.


Market Outlook


The stock market sold off again last week reversing the previous recovery. The rest of the week was ugly. Historically, October is one of the best months, so if history repeats itself, we should see a nice EOY rally starting in October.

According to LPL Research, Octobers are not that bad and should initiate a rally well into November with some cool-off in December.
 

SPX prediction next week

 
But that doesn’t mean, the beginning of October can be ugly. Mainly when the market morphed into a short-term downtrend channel. This is significant technical damage. We are now creating lower lows and lower highs and that is not good. It would take a lot of effort to break this channel and move higher. There is still a good chance that this will happen. Even historically after very ugly downtrends in 1998, 2000, 2004, 2007, 2010, 2015, 2018, and 2020, the market printed very good performance after for 1 year, 3 years, and 5 years periods to come.


We briefly approach close to the $4,500 target but the market didn’t have the strength to reach it or exceed it. We broke below $4,300 support and as of today, it appears that we will be going lower towards the 200-day moving average.
 

If you want to learn more about the stock market, events that moved the market last week and will likely impact it in the near future, I recommend you to subscribe to our weekly newsletter. Knowing where the market is heading and knowing when you should expect its reversal can benefit your trading and investing. Subscribe and you get one month free.


Investing and trading report in charts


Account Net-Liq


TW Account Net-Liq week 39


Account Stocks holding

 
TW Account holdings week 39
 

Our stock holdings still do not beat the market but I am positive that the growth will pick up and exceeds the market. We just need time and continue reinvesting the proceeds. S&P 500 grew 50.62% since we opened our portfolio while our portfolio grew 22.30% only. On YTD basis, the S&P 500 grew 20.78% and our portfolio 15.32%.

But the numbers above apply to our stock holdings in our account, not the overall account net-liq growth. Our overall account beats the market growing by 285.08%!
 

Stock holdings Growth YTD

 
TW Account holdings Growth YTD
 

I expect our stock holdings to start outperforming the market as they mature. However, these are just our stock holdings. The entire portfolio beats the market by far thanks to monetizing those positions.

Our 10-year goal is to grow this account to $1,000,000.00 value in ten years. We are in year two and we accomplished 7.92% of that goal.

Our 6-year goal is to reach $175,000 account value to be eligible for portfolio margin (PM) and today we accomplished 45.27% of that goal.

Our 2021 year goal is to grow this account to a $42,344.00. We already accomplished this goal.


Investing and Trading Report – Options Monthly Income

 
TW Options Income week 39
 

Investing and Trading Report – Options Annual Income


TW Options Annual Income week 39
 

Our dividend goal and future dividends


TW Received vs Projected Dividends week 39
 

We have accomplished our dividend income goal. We planned to make $1,071 of dividend income this year and we finished receiving $1,848.85. However, we accumulated enough shares to start making $3,948.98 a year.
 

TW Received vs Future Dividends week 39


Our account cumulative return


The chart below indicates our cumulative adjusted return. It shows how the last week’s selloff shook down our returns but we are recovering along with the market.
 

TW cumulative return wk 39
 

TW win ratio wk 39
 

As of today, our account cumulative return is 38.06% (note, data in this section are since March 13, 2021, only as that is the date we started tracking these metrics. Thus the results are skewed a bit and will show full picture next year.).


Conclusion of our investing and trading report


This week our options trading was within our expectations and I believe, the rest of the month will be even better.

We will continue accumulating the dividend growth stocks in our portfolio to reach 100 shares and continue building our cash reserves so we have enough cash to sustain any market corrections and be able to buy depressed stocks.

We will report our next week’s results next Saturday. Until then, good luck and good trading!


We all want to hear your opinion on the article above:
No Comments


This site has been fine-tuned by 14 WordPress Tweaks