Two weeks of weakness and selling in September are behind us. It was interesting to see the indecisiveness of the markets and a constant battle between bears and bulls. But the bears-bulls war is not over yet. We need to see who will win the final battle. What we experienced was that all rallies were sold but shortly it turned around and all drops were bought, just to turn around again and see, once again, all rallies sold. In this investing and trading report, we will once again review our results and plans for the next upcoming weeks.
This week’s investing and trading was successful despite the selling in Wall Street and that the numbers in this report may not indicate it. Let’s look at the numbers first:
Here is our investing and trading report:
| Account Value: |
$81,642.81 |
$844.16 |
1.04% |
| Options trading results |
| Options Premiums Received: |
-$3,112.00 |
|
|
| 01 January 2021 Options: |
$4,209.00 |
+16.65% |
|
| 02 February 2021 Options: |
$4,884.00 |
+15.41% |
|
| 03 March 2021 Options: |
$5,258.00 |
+12.79% |
|
| 04 April 2021 Options: |
$2,336.00 |
+4.30% |
|
| 05 May 2021 Options: |
$6,346.00 |
+9.22% |
|
| 06 June 2021 Options: |
$4,677.00 |
+6.37% |
|
| 07 July 2021 Options: |
$3,865.00 |
+5.14% |
|
| 08 August 2021 Options: |
$6,133.00 |
+7.40% |
|
| 09 September 2021 Options: |
-$1,732.00 |
-2.12% |
|
| Options Premiums YTD: |
$35,976.00 |
+44.07% |
|
| Dividend income results |
| Dividends Received: |
$38.43 |
|
|
| 01 January 2021 Dividends: |
$53.04 |
|
|
| 02 February 2021 Dividends: |
$63.00 |
|
|
| 03 March 2021 Dividends: |
$30.31 |
|
|
| 04 April 2021 Dividends: |
$139.70 |
|
|
| 05 May 2021 Dividends: |
$167.45 |
|
|
| 06 June 2021 Dividends: |
$168.56 |
|
|
| 07 July 2021 Dividends: |
$228.62 |
|
|
| 08 August 2021 Dividends: |
$780.09 |
|
|
| 09 September 2021 Dividends: |
$81.74 |
|
|
| Dividends YTD: |
$1,753.99 |
|
|
| Portfolio metrics |
| Portfolio Yield: |
4.61% |
|
|
| Portfolio Dividend Growth: |
8.13% |
|
|
| Ann. Div Income & YOC in 10 yrs: |
$18,193.65 |
18.37% |
|
| Ann. Div Income & YOC in 20 yrs: |
$155,736.41 |
157.24% |
|
| Ann. Div Income & YOC in 25 yrs: |
$726,662.32 |
733.67% |
|
| Ann. Div Income & YOC in 30 yrs: |
$5,412,297.37 |
5,464.52% |
|
| Portfolio Alpha: |
36.59% |
|
|
| Portfolio Weighted Beta: |
0.72 |
|
|
| CAGR: |
657.65% |
|
|
| AROC: |
44.65% |
|
|
| TROC: |
15.13% |
|
|
| Our 2021 Goal |
| 2021 Dividend Goal: |
$1,071.42 |
163.71% |
Accomplished |
| 2021 Portfolio Value Goal: |
$42,344.06 |
192.81% |
Accomplished |
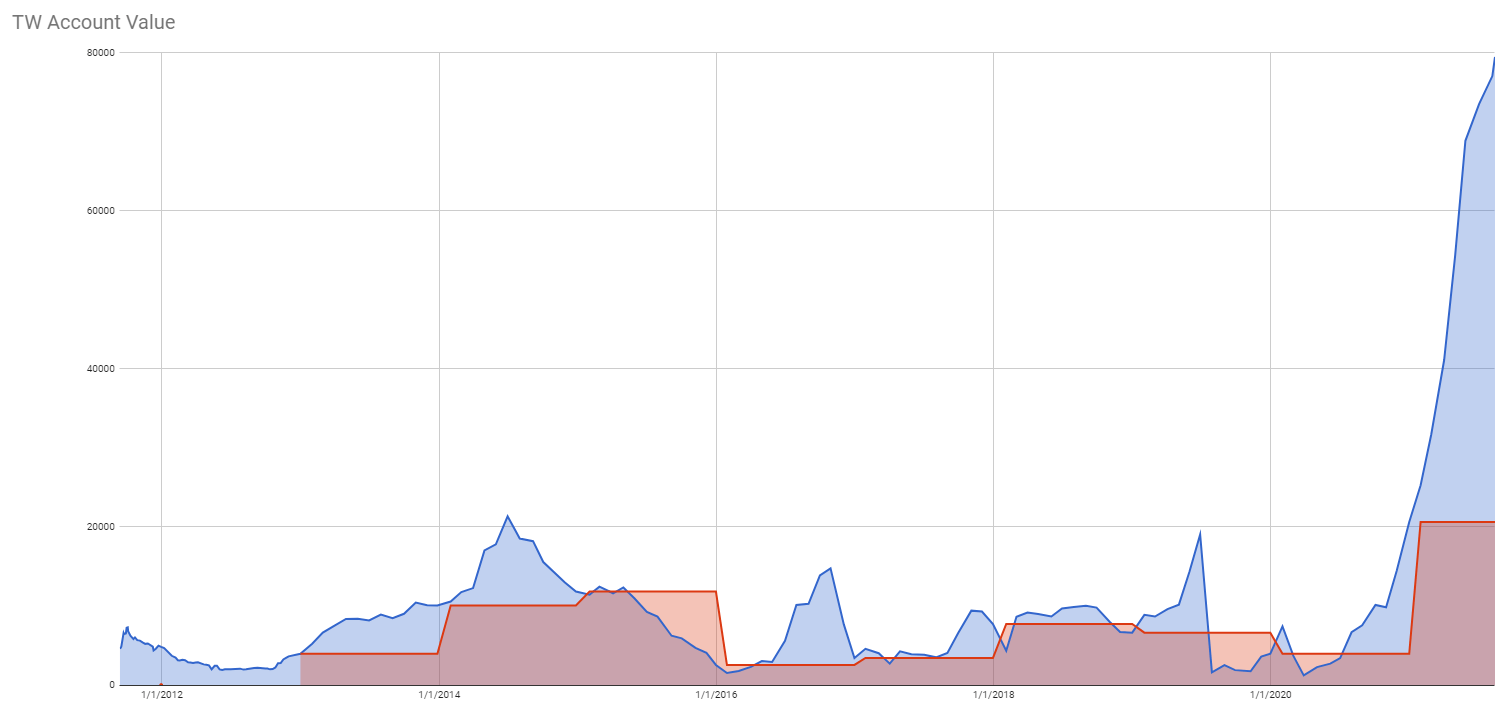
Our Net-Liq (net liquidating value) actually went up by 1.04% despite the markets selling and losing -1.16% last week.
Since I believe, this bull market is not over yet and soon we will see a year-end rally, we bought SPY LEAPS last week. That had an impact on our premiums income. Normally, we sell options for income, but from time to time we purchase options, LEAPS are one of them. In the table above, we see our options income be negative -$1,732.00 and that we lost -$3,112.00 this week. But that is skewed by the options purchase. SPY options are expensive. We bought LEAPS worth over $5,000 last week. Without SPY LEAPS purchase, our income would be +$1,956 this week landing overall September income at $3,336.
Dividend Investing and Trading Report
Our Net-Liq (net liquidating value) actually went up by 1.04% despite the markets selling and losing -1.16% last week.
Since I believe, this bull market is not over yet and soon we will see a year-end rally, we bought SPY LEAPS last week. That had an impact on our premiums income. Normally, we sell options for income, but from time to time we purchase options, LEAPS are one of them. In the table above, we see our options income be negative -$1,732.00 and that we lost -$3,112.00 this week. But that is skewed by the options purchase. SPY options are expensive. We bought LEAPS worth over $5,000 last week. Without SPY LEAPS purchase, our income would be +$1,956 this week landing overall September income at $3,336.
Our dividend income was consistent and as expected. We expect it to continue in the near future and actually grow.
Here are our stock holdings that contribute to our dividend income:

Options Investing and Trading Report
Last week we rolled CROX strangle. It was a great opportunity to roll it as the stock jumped up strong and premiums were inflated. We adjusted that trade slightly and received $1,447 in premiums. We also rolled WEN trade as the stock continued slipping down and our put option was at the money. We lowered the trade and centered the stock price in between our strikes.
The rest of the week we only closed old trades that were about to expire that week anyway.
We took an opportunity of the selling market and bought 853 DTE SPY LEAPS. I believe, this bull market is not over and that after this selling it will go up again. We just need to survive the September and October volatility and fear. If the market slips even more than what we experienced in the last two weeks, I am prepared to buy more LEAPS down the road.
We also sold short calls against the LEAPS to generate income and we plan to sell covered calls (converting our trade to a PMCC (poor man’s covered call).
You can watch all our trades in this spreadsheet. You can watch the spreadsheet and look for a “NEW” indication next to the trading date. When the indicator shows up, it is typically good for up to 3 days to follow that trade.
Expected Future Dividend Income
As the table at the beginning of this report indicates, our aggressive dividend growth stocks accumulation is showing significant progress in our current and future dividends income. Our portfolio dividend yield and dividend growth will be bringing us almost $155,736.41 in 20 years and $5,412,297.37 in 30 years. It looks a bit unrealistic, but I verified the formula behind calculating the future value several times and got the same results. Nevertheless, I wish, I had that $5.4 million income now. But that is the fate of dividend growth investing. It is not a quick rich scheme and building an account takes time.
We will keep aggressively accumulating dividend growth stocks to generate liveable income sooner than in 20 years. And the portfolio is starting to show this to be happening. In just 10 years, we will start receiving $18,193.65 in today’s dollars. It is not bad considering that in March 2021 it was only $3,202.52 in projected future dividends.
Our projected annual dividend income in 10 years is $18,193.65 but that is if we do absolutely nothing and let our positions grow on their own.
We are also set to receive a $4,402.62 annual dividend income. We are 24.20% of our 10 year goal!

The chart above shows how our future dividend income is based on the future yield on cost and what dividend income we may expect in the future. The expected dividend growth depends on what stocks we are adding to our portfolio and the stocks’ 3 years average dividend growth rate. It is interesting to see what passive income we may enjoy 10, 20, 25, or 30 years from now.
Market value of our holdings
We were not buying any new stock positions last week. We only re-allocated some of our holdings. We used ICSH to save money but later on, I realized that I was holding too much cash in that fund that makes no money, and long term, SPY investment will be a better cash holder than ICSH despite potential future market drops, selloffs, and recessions (remember, we have extremely friendly FED).
Therefore, I split our holdings between ICSH and SPY. We still will be saving cash in the ICSH fund but also in the SPY ETF.
Our non-adjusted stock holdings market value decreased from $115,443.70 to $106,589.22. This was caused by reallocating ICSH (a stock holding) into SPY LEAPS (options holding) plus market valuation decrease.
We still expect the value of our holdings to grow and outperform the market long term. Many positions in our portfolio are new and “young” and they did not have enough time to show gains yet. We were building cash reserves to buy depressed stocks during selloffs and corrections as well as negative analysts reports (as long as the company is still good long term). We used those reserves last week to buy LEAPS. If the market continues down in the next few weeks, we may use more reserves.

Our goal is to accumulate 100 shares of each stock of our interest and we are getting to that goal.
Investing and trading ROI
Our options trading delivered a -2.12% monthly ROI in September 2021, totaling a 44.07% ROI YTD. That dropped below our 45% annual revenue selling options against dividend stocks target!
Our account grew by 296.86% beating our projections and the market.
Our options trading averaged $3,997.33 per month this year. If this trend continues, we are on track to make $47,968.00 trading options in 2021. As of today, we have made $35,976.00 trading options. This was a decrease from previous weeks and months but again, that was due to options purchases.
Old SPX trades repair
This week, we didn’t adjust any SPX trades. Our goal is to reach a level that we will be eligible for portfolio margin (PM). Once that happens, we plan on converting the existing SPX Iron Condors to strangles and trade these positions as strangles.
With RegT margin, the capital requirements would be approx. $66,586.06 and that is beyond our means. With PM the requirement for margin would drop to around $10k. That is doable in our account. Once we reach this level, we will start adjusting our SPX trades accordingly. Until then, we will just roll these trades around.
Accumulating Growth Stocks
We started accumulating SPXL and SSO leveraged ETFs. We were stopped out last week but we bought back in when the stocks dropped further. So we are in these positions on a cheaper cost basis. We will continue purchasing these funds and we hope and plan to raise holdings in these stocks to 25% of our entire portfolio.
Once we reach that level, we will be trimming our position in SSO and SPXL if they exceed the 25% mark (price appreciation) or buy more when they drop below the 25% mark.
Accumulating Rules
I have two issues I need to focus on and improve. One is financial discipline. I tend to jump in buying new positions, accumulating stocks, despite not having enough buying power. Sometimes I get so enthusiastic that I simply go and buy. But then the market turns around and my positions start hurting me. Although I had cash reserves in the ICSH that I could sell and release the BP, I do not want that situation of receiving a maintenance call that has happened last week.
My second issue is that I am aspiring to start trading for a living. And at this point, all my income is tight to the open positions and cannot be withdrawn. That is not good if I want to live on that income. This is because I immediately reinvest and reopen the expired positions. This needs to be addressed in my trading so my income will be available to withdraw when I start trading for a living.
I have a plan for both dividend and growth stocks accumulation and options trading to address these two topics mentioned above. I also need to force myself to follow those rules strictly (I am violating them recently).
Stocks Accumulating Rules
The rule is to buy dividend or growth stocks using only 20% of any available BP that is above the minimum limit. The current minimum BP limit for September is $2,000. That is the amount which must be available at all times. I can buy stocks worth 20% of any amount above this limit.
Today, the BP is $1,324.00, $676 below the limit.
Options Trading Rules
Trading options will follow the same rules as accumulating stocks. But because trading options is our main income-generating strategy, this will actually be a strategy setting our BP limits.
We will be reopening trades that expire every month but only if the BP is above the limit and reopening new trades won’t drop the BP below the limit. If a new trade would cause the BP to drop below the limit, the trade can not be reopened and we will have to wait for the market or stocks appreciation or income from already opened trades to generate more income. We will be raising the limit every three months by $1,000 to build cash reserves.
Accumulating Dividend Growth Stocks
Last week, we didn’t add any new dividend growth stocks.
In the upcoming weeks, we will continue to accumulate the higher yield income stocks to boost our income and reinvest the proceeds but following our accumulation rules as described in the above section.
Our goal is to reach 100 shares of high-quality dividend stocks and build a weekly dividend income as per this calendar, but we have made no changes to this goal last week:

You can see the entire spreadsheet here.
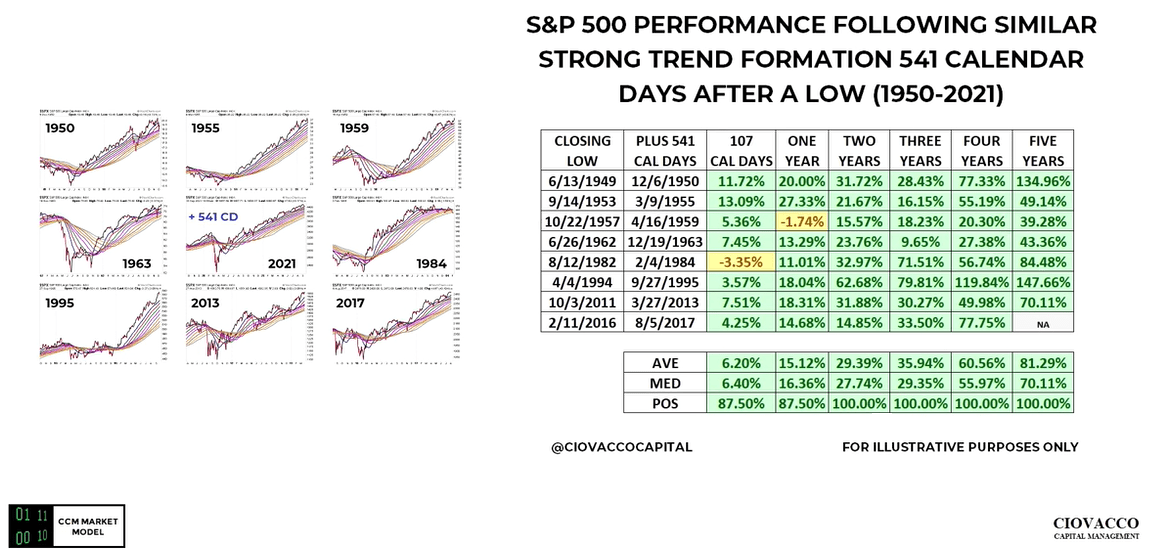
Market Outlook
The stock market sold off again last week. There is a lot of fear and uncertainty out there. Many people and analysts are suddenly bearish, while just two weeks ago they were bullish. But this fear and selling could be expected. Historically, we can see up to an 8% drop. On average, the markets drop just 3% though. The 6% and 8% were extremes that occurred only two times in the past in similar markets like today.
People and investors are worried about Covid, economic slowdown, FED tapering, and taxes increase. In my opinion, none is an issue but the markets sometimes freak out about nonissues. Today, it all seems to be an issue, tomorrow, it will be a nonissue.
In this market state of indecision, it is hard to say where the market will go next. We are still in an uptrend but we are starting to see some technical damage to the trend. It can be just a bear trap, but it may spill into more selling. The issue here is that many people who were buying the dips before are no longer buying the dips and waiting for a bigger drop, (source: Vanda Research). Well, we have to wait for the markets to calm down and big money to start buying again. Retails will follow.
My expectations are the same as in previous weeks. I do not think we will see a large drop. We do not have a reason for it. There is no fundamental economic catalyst for it (it may change though but it has not changed yet). Instead, I think, this market will drift. It could be adrift down, or sideways. My expectation for the week ahead is unclear. I see no clear path or conviction. We closed below the 50-day MA and that can spike more selling next week, or computers may jump in next week and start buying. We need to sit tight and wait for the market’s decision.

If you want to learn more about the stock market, events that moved the market last week and will likely impact it in the near future, I recommend you to subscribe to our weekly newsletter. Knowing where the market is heading and knowing when you should expect its reversal can benefit your trading and investing. Subscribe and you get one month free.
Investing and trading report in charts
Account Net-Liq

Account Stocks holding

Our stock holdings still do not beat the market but I am positive that the growth will pick up and exceeds the market. We just need time and continue reinvesting the proceeds. S&P 500 grew 53.25% since we opened our portfolio while our portfolio grew 21.98% only. On YTD basis, the S&P 500 grew 23.40% and our portfolio 15.00%. We actually did better this week than the market.
But the numbers above apply to our stock holdings in our account, not the overall account net-liq growth. Our overall account beats the market growing by 296.86%!
Stock holdings Growth YTD

I expect our stock holdings to start outperforming the market as they mature. However, these are just our stock holdings. The entire portfolio beats the market by far thanks to monetizing those positions.
Our goal is to grow this account to $1,000,000.00 value in ten years. We are in year two.
Investing and Trading Report – Options Monthly Income

The chart above shows September negative due to purchasing options LEAPS. We will gain more income when those LEAPS appreciate over time and we start rolling them.
Investing and Trading Report – Options Annual Income

Our dividend goal and future dividends
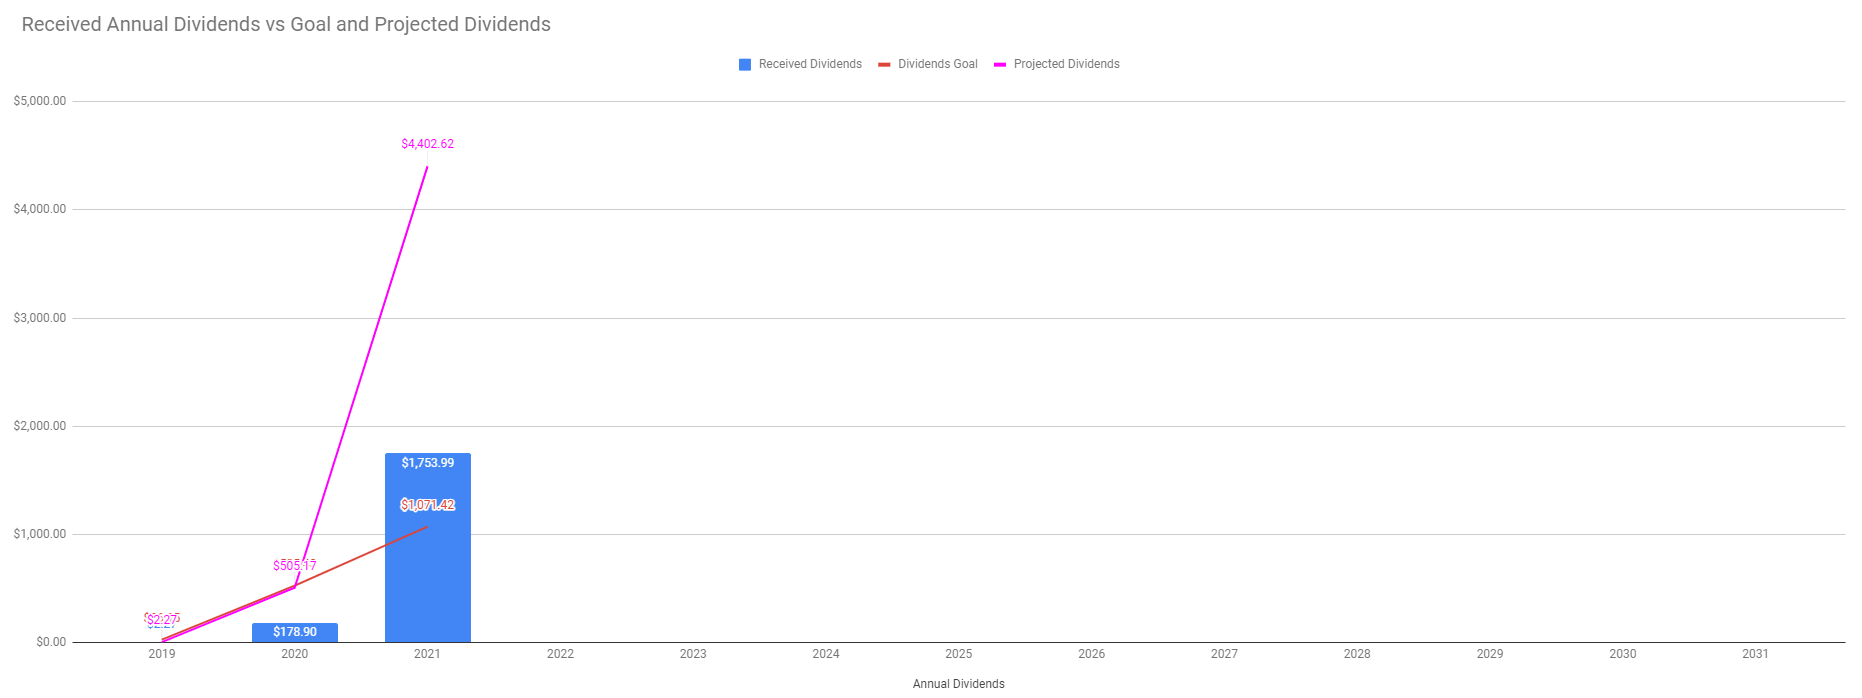
We have accomplished our dividend income goal. We planned to make $1,071 of dividend income this year and we finished receiving $1,753.99. However, we accumulated enough shares to start making $4,401.22 a year.

Our account cumulative return
The chart below indicates our cumulative adjusted return. It shows how the last week’s selloff shook down our returns but we are recovering along with the market.


As of today, our account cumulative return is 42.28% (note, data in this section are since March 13, 2021, only as that is the date we started tracking these metrics. Thus the results are skewed a bit and will show full picture next year.).
Conclusion of our investing and trading report
This week our options trading was within our expectations and I believe, the rest of the month will be even better.
We will continue accumulating the dividend growth stocks in our portfolio to reach 100 shares and continue building our cash reserves so we have enough cash to sustain any market corrections and be able to buy depressed stocks.
We will report our next week’s results next Saturday. Until then, good luck and good trading!
We all want to hear your opinion on the article above:
No Comments |


Recent Comments