The second week of August is behind us. In this investing and trading report, we will show that it was a successful week once again although our options income was smaller than in previous months. But it can still all change in the next two weeks.
The biggest achievement last week was our dividend income and net-liq growth. As you will see below, our dividend income met projections for the first time since we started building this account. We exceeded that income expectation a bit. We are on the path to receiving the entire $4,118 annual dividend income.
Our account net liquidating value also jumped more than expected. Partially due to more of our open options positions being set to expire (all look to become worthless so far), and some being rolled releasing a lot of buying power that also has an impact on our net-liq.
Here is our investing and trading report:
| Account Value: | $79,450.71 | $2,425.83 | 3.15% |
| Options trading results | |||
| Options Premiums Received: | $1,670.00 | ||
| 01 January 2021 Options: | $4,209.00 | +16.65% | |
| 02 February 2021 Options: | $4,884.00 | +15.41% | |
| 03 March 2021 Options: | $5,258.00 | +12.79% | |
| 04 April 2021 Options: | $2,336.00 | +4.30% | |
| 05 May 2021 Options: | $6,346.00 | +9.22% | |
| 06 June 2021 Options: | $4,677.00 | +6.37% | |
| 07 July 2021 Options: | $3,865.00 | +5.14% | |
| 08 August 2021 Options: | $2,197.00 | +2.77% | |
| Options Premiums YTD: | $33,772.00 | +42.51% | |
| Dividend income results | |||
| Dividends Received: | $460.13 | ||
| 01 January 2021 Dividends: | $53.04 | ||
| 02 February 2021 Dividends: | $63.00 | ||
| 03 March 2021 Dividends: | $30.31 | ||
| 04 April 2021 Dividends: | $139.70 | ||
| 05 May 2021 Dividends: | $167.45 | ||
| 06 June 2021 Dividends: | $168.56 | ||
| 07 July 2021 Dividends: | $228.62 | ||
| 08 August 2021 Dividends: | $467.41 | ||
| Dividends YTD: | $1,359.57 | ||
| Portfolio metrics | |||
| Portfolio Yield: | 4.67% | ||
| Portfolio Dividend Growth: | 8.13% | ||
| Ann. Div Income & YOC in 10 yrs: | $17,877.34 | 18.75% | |
| Ann. Div Income & YOC in 20 yrs: | $155,595.08 | 163.20% | |
| Ann. Div Income & YOC in 25 yrs: | $735,794.76 | 771.76% | |
| Ann. Div Income & YOC in 30 yrs: | $5,579,925.90 | 5,852.64% | |
| Portfolio Alpha: | 35.39% | ||
| Portfolio Weighted Beta: | 0.68 | ||
| CAGR: | 713.08% | ||
| AROC: | 32.31% | ||
| TROC: | 19.12% | ||
| Our 2021 Goal | |||
| 2021 Dividend Goal: | $1,071.42 | 126.89% | Accomplished |
| 2021 Portfolio Value Goal: | $42,344.06 | 187.63% | Accomplished |
Last week, we accomplished our dividend income goal for 2021. But our account is set for larger income for the rest of the year and next year.
Dividend Investing and Trading Report
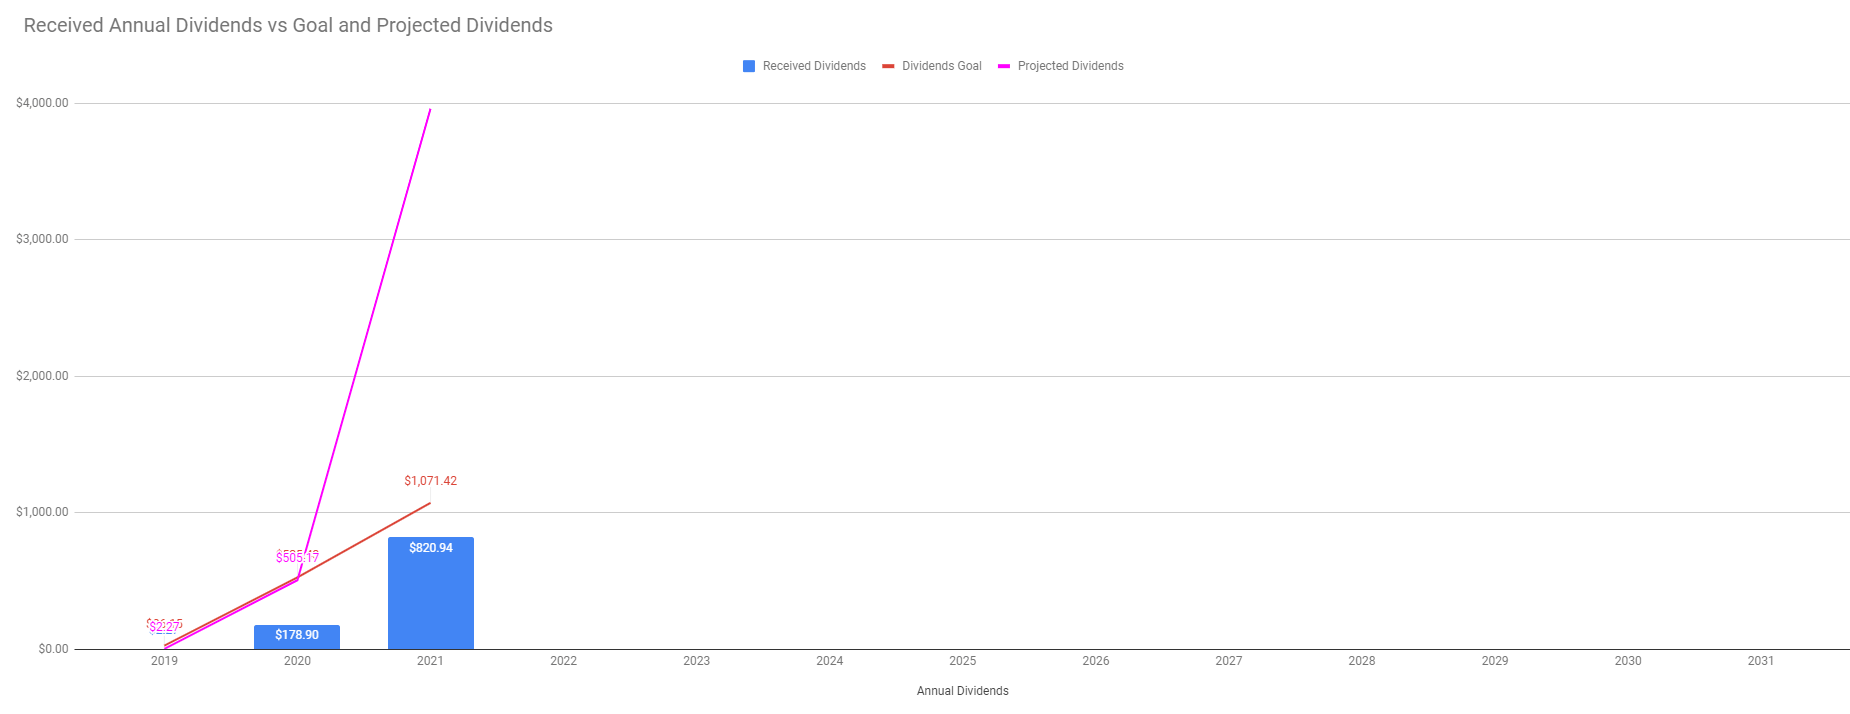
Last week, we have received a $460.13 dividends income. Our stock holdings and dividend income appear to be in sync as of today. We have enough stock holdings to generate $4,184.79 annual dividend income and our August dividend income projection was $439.75. Last week, we have received $467.41 total and we beat the projection. As this chart indicates, we should be in line with the projected income.
Last week, our dividend income reached 126.89% of our dividend income goal. We projected to receive $1,071 in dividends in 2021. Our growth was fast and we have received $1,359.57.
Here are our stock holdings that contribute to our dividend income:

Options Investing and Trading Report
Last week we again rolled options that got in trouble. The biggest trouble but also money maker was BABA. We rolled pre-emptively our strangles to lower our puts as it seems, BABA is on the way down to $100 a share. So we wanted to give our trade more room to absorb this downtrend.
We also rolled trades against MU, PMT, KBE, TSN, and SNOW. We rolled MU as it suddenly tanked by more than 7% on Morgan Stanley’s warning and price target reduction. In my opinion, the market over-reacted. But we had to adjust our strangles to keep them safe.
These rolls also released a significant amount of buying power and had a positive impact on our net-liq.
Our options positions now have 12 trades set to expire on August 20th. When those trades expire, we will re-enter new trades. We will only replace the expired trades and we will not be adding any new ones for the rest of the year to consolidate our gains and account.
We converted our call side against SNOW’s Iron Condor into a put spread as SNOW is rallying and constantly challenging our calls. Rolling call spreads is difficult and almost impossible for credit. That’s why I do not like spreads. Hard to manage and adjust them. So the best approach was to convert our SNOW call spread to another put spread. Now, both put spreads (the original one and the new one) are set to expire worthless.
You can watch all our trades in this spreadsheet. You can watch the spreadsheet and look for a “NEW” indication next to the trading date. When the indicator shows up, it is typically good for up to 3 days to follow that trade.
Expected Future Dividend Income
As the table at the beginning of this report indicates, our aggressive dividend growth stocks accumulation is starting to show significant progress in our current and future dividends income. Our portfolio dividend yield and dividend growth will be bringing us almost $155,595.08 in 20 years and $5,579,925.90 in 30 years. I wish, I had that $5.5 million income now. But that is the fate of dividend growth investing. It is not a quick rich scheme and building an account takes time.
We will keep aggressively accumulating dividend growth stocks to generate liveable income sooner than in 20 years. And the portfolio is starting to show this to be happening. In just 10 years, we will start receiving $17,877.34 in today’s dollars. It is not bad considering that in March 2021 it was only $3,202.52 in projected future dividends.
Our projected annual dividend income in 10 years is $17,877.34 but that is if we do absolutely nothing and let our positions grow on their own.
But as of today, thanks to our aggressive accumulation and dividend reinvesting, we are set to receive a $4,184.79 annual dividend income. We are 23% of our 10 year goal! True, we will need a bigger income than $17k in ten years, but this indicates that we have the potential of reaching our dividend income goal sooner than planned.

The chart above shows how our future dividend income is based on the future yield on cost and what dividend income we may expect in the future. The expected dividend growth depends on what stocks we are adding to our portfolio and the stocks’ 3 years average dividend growth rate. It is interesting to see what passive income we may enjoy 10, 20, 25, or 30 years from now.
Market value of our holdings
Our non-adjusted stock holdings market value increased from $100,173.83 to $103,867.40.
As the markets and businesses continue growing, we expect the value of our holdings to grow even more. We are also building cash reserves to buy depressed stocks during selloffs and corrections as well as negative analysts reports (as long as the company is still good long term).

We are accumulating the dividend growth stocks (and some income-only stocks) not only to build a strong dividend income but also to create a “rental property” in our portfolio that can be monetized and generate additional income. This strategy will also provide safety for our strangles and cover our call side.
Our goal is to accumulate 100 shares of each stock of our interest and we are getting to that goal.
Investing and trading ROI
Our options trading delivered a 2.77% monthly ROI in July 2021, totaling a 42.51% ROI YTD. We are getting close to our 45% annual revenue selling options against dividend stocks!
Our account grew by 286.20% beating our projections and the market.
Our options trading averaged $4,221.50 per month this year. If this trend continues, we are on track to make $50,658.00 trading options in 2021. As of today, we have made $33,772.00 trading options. We are over halfway of the projected annual income.
Old SPX trades repair
This week, we didn’t adjust any SPX trades. Our goal is to reach a level that we will be eligible for portfolio margin (PM). Once that happens, we plan on converting the existing SPX Iron Condors to strangles and trade these positions as strangles.
With RegT margin, the capital requirements would be approx. $66,586.06 and that is beyond our means. With PM the requirement for margin would drop to around $10k. That is doable in our account. Once we reach this level, we will start adjusting our SPX trades accordingly. Until then, we will just roll these trades around.
Accumulating Growth Stocks
Last week, we didn’t add any growth stocks to our holdings.
Our plan for the rest of the year is to accumulate cash. We only add dividend growth stocks when an opportunity shows up. Our rule for the rest of the year is to use 20% of our available buying power that is above $2,000 to buy new shares per week. The rest of the BP will be kept intact to grow our cash reserves.
Accumulating Dividend Growth Stocks
Last week, we added 6 shares of VICI, 15 shares of ICSH, 5 shares of MU, and 5 shares of CLX. The MU and CLX purchases were an opportunity to buy a depressed stock. MU’s fair value is $89.54, the current price $70.92; CLX’s fair value is $124.19 the current price is $168.45. The stock retreated strongly from the recent highs (as Covid fades away, the analysts think that there will no longer be a need for cleaning supplies).
In the upcoming weeks, we will continue to accumulate the higher yield income stocks to boost our income and reinvest the proceeds but within our share purchasing plan for the rest of the year (see above section).
Our goal is to reach 100 shares of high-quality dividend stocks and build a weekly dividend income as per this calendar, but we have made no changes to this goal last week:

You can see the entire spreadsheet here.
Market Outlook
The market has been in a fairly long (multi-month) consolidation with a slightly upward move. Last week, we started seeing breakouts. DJI broke above 35,000 level, finally, after several months of punching that level for the last four months. SPX had a consolidation too but it was not as obvious as with DJI.

As the chart above shows, the SPX is clearly in a solid uptrend. It then went to a month and a half long consolidation (from May to June 20), broke up, retested the former resistance, continued up and into a month-long consolidation. We are now heading higher again.

The DJI was in a four-month-long consolidation and it was more obvious. It broke up last Friday and we will also be heading higher. Why? Earnings.
We just finished a 2Q earnings season (91% of companies already reported), and 87% of companies reported positive earnings and earnings surprises. For 2Q, the earnings growth for S&P500 was 89.3%, the highest growth since 2009, and revenue growth was 24.9%. It is the earnings that drive the markets higher. Investors out there, mainly new ones, fail to understand this and put the S&P500 valuation into perspective.
The other day I have seen an investor on social media posting that he has bought puts against SPY and QQQ with a comment, that he: “hopes that the markets will drop next week.” When I told him that he appears to be trading hopes and wishes, he replied that he; “also trades technicals and that the markets are at all-time highs.” Yes, they are at ATH. And they will be there for some time, and they will be creating more ATH in the coming weeks. Why? Again. Earnings.
Market Valuation
In a bull market like the one we have, you need to understand that there will always be some extended valuation and that investors will pay some premiums. In the bear market, the prices will also tend to overshoot and show lower valuations than what the reality will be (offering great opportunities). Using P/E as a valuation metric without perspective is wrong. P/E is a lagging metrics and has zero, let me repeat, zero, predicting value. It takes into account past data and calculates P/E. But it all already happened and there is no guarantee that it will happen in the future.
Market Future Expectations
The markets are pricing in the future expectations. Yes, we can debate the methodology of deriving that expectation. We take the past data and project them into the future to come up with expectations.
If the expectations are higher than today, the markets go up.
If the companies beat those expectations, the markets will continue going even higher, as long as the expectations for the next season are higher than prior ones.
If the companies fail to meet or beat those expectations, expect a correction, usually accompanied by gloomy expectations for the next season.
And what are the economists’ expectations for 3Q?
For 3Q the earnings growth projection is 27.8%, revenue growth is 14.5%.
For 4Q the earnings growth projection is 21.3%, revenue growth is 11.0%.
For the entire 2021, the earnings growth projection is 41.9% and revenue growth is 14.5%.
If you are shorting this market, hoping that it will go down, you are ignoring reality and standing in front of a very fast-moving freight train.
Intrinsic value and price target of the market
Based on the earnings, momentum, and projections, I expect this market to go to $4,500 in the near term and $4,725 by the end of the year. Next year, I expect the market to finish at $5,000 to $5,145 level.
Will we see a correction? We may. It will not be economy driven correction though. We may see some outside events causing the market to correct. It may be the Delta variant of Covid, FED announcements, a sudden spike in interest rates as we saw a few weeks ago, or any other catalyst. But if the earnings projections and business performance remain intact, these corrections will be short-lived. And unpredictable.

Based on the earnings up to today, the market’s value should be at $4,040.24. But that is past. We need to look into the future. And the future is pricing in a $4,500+ market.
Investing and trading report in charts
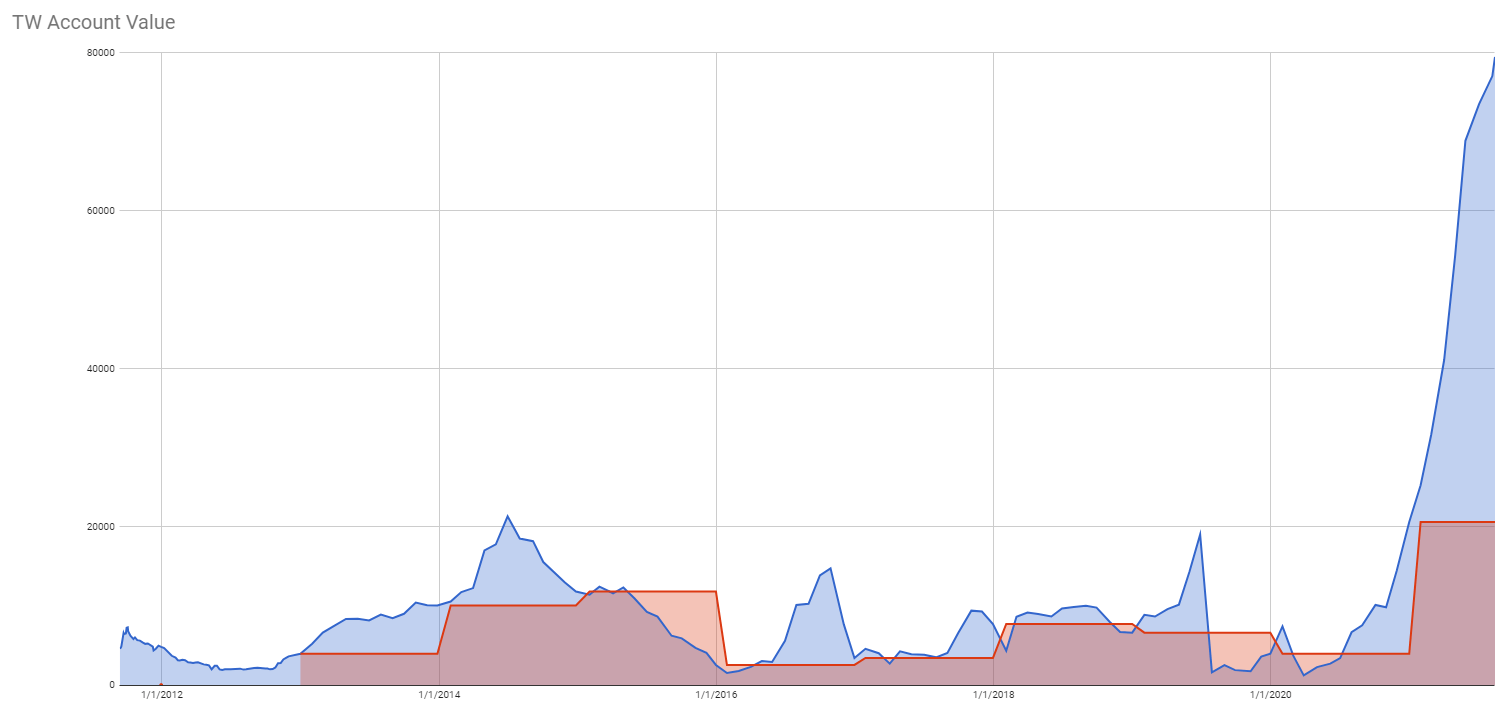
Account Net-Liq
Account Stocks holding

Our stock holdings still do not beat the market but I am positive that the growth will pick up and exceeds the market. We just need time and continue reinvesting the proceeds. S&P 500 grew 54.46% since we opened our portfolio while our portfolio grew 21.19% only. On YTD basis, the S&P 500 grew 24.61% and our portfolio 14.21%.
But the numbers above apply to our stock holdings in our account, not the overall account net-liq growth. Our overall account beats the market growing by 286.20%!
Stock holdings Growth YTD

I expect our stock holdings to start outperforming the market as they mature. However, these are just our stock holdings. The entire portfolio beats the market by far thanks to monetizing those positions.
Our goal is to grow this account to $1,000,000.00 value in ten years. We are in year two.
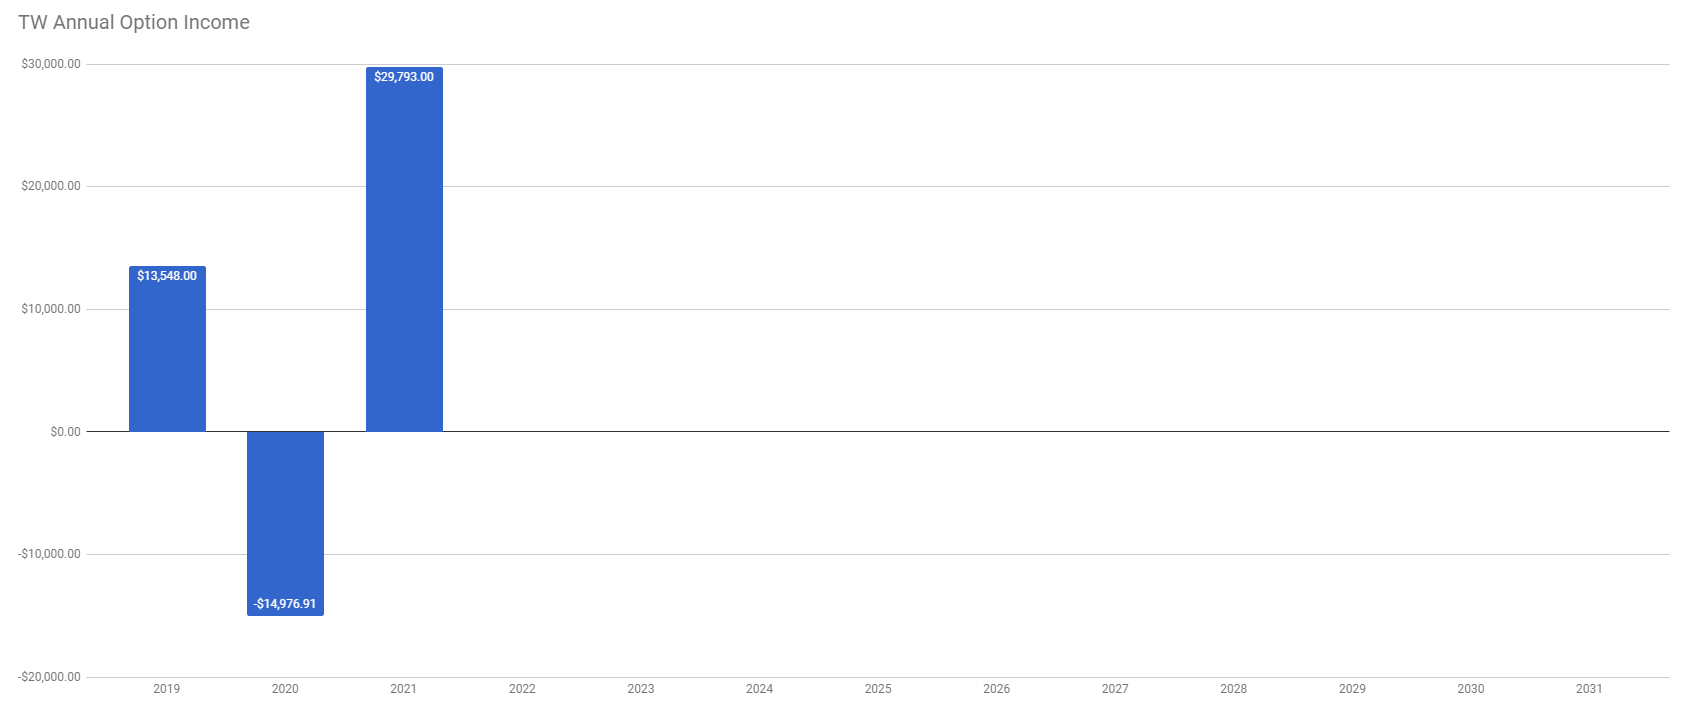
Investing and Trading Report – Options Monthly Income

Investing and Trading Report – Options Annual Income

Our dividend goal and future dividends

We have accomplished our dividend income goal. We planned to make $1,071 of dividend income this year and we finished receiving $1,359.57. However, we accumulated enough shares to start making $4,184.79 a year.

The chart above shows that our dividend holdings caught up with the dividend payout cycle and we started receiving monthly dividends as projected. For August 2021 the projection was $439.75 and we have received $467.41. For September, our projection is $399.63. If we receive this income (or more), it will confirm that we are now in line with projections.
Our account cumulative return
The chart below indicates our cumulative adjusted return. It shows how the last week’s selloff shook down our returns but we are recovering along with the market.


As of today, our account cumulative return is 38.46% (note, data in this section are since March 13, 2021, only as that is the date we started tracking these metrics. Thus the results are skewed a bit and will show full picture next year.).
Conclusion of our investing and trading report
This week our options trading was within our expectations and I believe, the rest of the month will be even better.
We will continue accumulating the dividend growth stocks in our portfolio to reach 100 shares and continue building our cash reserves so we have enough cash to sustain any market corrections and be able to buy depressed stocks.
We will report our next week’s results next Saturday. Until then, good luck and good trading!
|
We all want to hear your opinion on the article above: 2 Comments |


Recent Comments