Another week of May 2021 is over and here is our weekly investing and trading report. A lot happened last week. We made some good trades and adjustments to our portfolio, but the biggest news was AT&T announcing cutting the dividend. It is quite shocking that a dividend aristocrat with a history of 36 consecutive years of dividend increases cuts the dividend due to bad management. It seems AT&T has bad luck picking good CEOs.
Last week, we continued the aggressive accumulation of dividend and growth stocks and traded options around those positions. On one hand, quite boring stuff, on the other hand, it brings joy seeing how the portfolio grows to bring more income from dividends and premiums. It is a pleasure to write these investing and trading reports.
Let’s go and review this week’s investing and trading.
Here is our investing and trading report:
| Account Value: | $67,480.88 | +$10,221.69 | +17.85% |
| Options trading results | |||
| Options Premiums Received: | $783.00 | ||
| 01 January 2021 Options: | $4,209.00 | +16.65% | |
| 02 February 2021 Options: | $4,884.00 | +15.41% | |
| 03 March 2021 Options: | $5,258.00 | +12.79% | |
| 04 April 2021 Options: | $2,336.00 | +4.30% | |
| 05 May 2021 Options: | $4,960.00 | +7.29% | |
| Options Premiums YTD: | $21,647.00 | +32.08% | |
| Dividend income results | |||
| Dividends Received: | $27.75 | ||
| 01 January 2021 Dividends: | $53.04 | ||
| 02 February 2021 Dividends: | $63.00 | ||
| 03 March 2021 Dividends: | $30.31 | ||
| 04 April 2021 Dividends: | $139.70 | ||
| 05 May 2021 Dividends: | $167.45 | ||
| Dividends YTD: | $492.90 | ||
| Portfolio metrics | |||
| Portfolio Yield: | 4.80% | ||
| Portfolio Dividend Growth: | 8.47% | ||
| Ann. Div Income & YOC in 10 yrs: | $13,684.06 | 20.44% | |
| Ann. Div Income & YOC in 20 yrs: | $135,787.62 | 202.84% | |
| Ann. Div Income & YOC in 25 yrs: | $724,206.91 | 1081.81% | |
| Ann. Div Income & YOC in 30 yrs: | $6,569,736.96 | 9,813.77% | |
| Portfolio Alpha: | 22.03% | ||
| Portfolio Weighted Beta: | 1.01 | ||
| CAGR: | 844.17% | ||
| AROC: | 32.21% | ||
| TROC: | 21.73% | ||
| Our 2021 Goal | |||
| 2021 Dividend Goal: | $1,071.42 | 46.00% | |
| 2021 Portfolio Value Goal: | $42,344.06 | 159.36% | Accomplished |
Dividend Investing and Trading Report
Last week, we have received $27.75 in dividends. It was a bit slower income, but I expect to get more dividends as the new stocks acquisitions become eligible for payments.
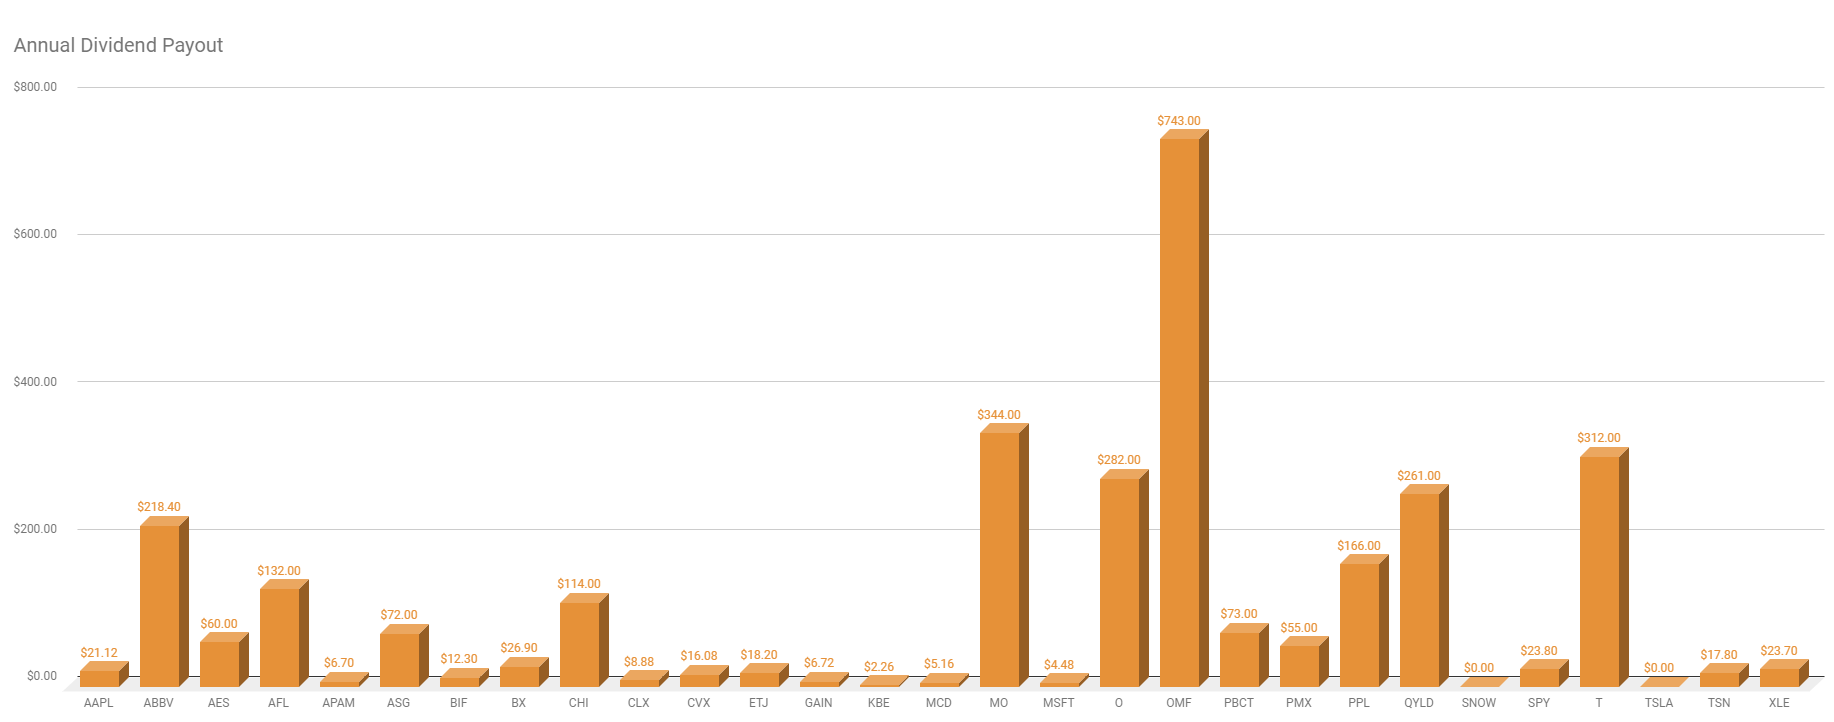
The chart below indicates our current annual dividend payout from our dividend stock holdings. A dividend growth investor needs to be aware of this payout from each stock. The chart indicates that some stocks contribute (or will be contributing to our income with large sums while others contribute very little. That can be a problem. If a company that contributes with large dividends suddenly cuts the dividend, it will have a very significant impact on our income (for example, if OMF cuts the dividend, or suspends it, the impact on our portfolio dividend income will be significant.
I am OK with this imbalance during the accumulation phase but plan to address it in the next phase of cultivating our portfolio. In other words, in the next phase, I will be accumulating stocks with lesser payout to match the stocks that pay more in dividends. If a company cuts the dividend, the impact of a lost income will be mitigated.
Last week, our dividend income reached 46.00% of our dividend income goal.

Options Investing and Trading Report
Last week we continued trading options against the stocks we either already own or plan to buy soon. We opened a new short strangles against KBE, MU, OMF, and rolled short strangles against SPCE. We also converted a BABA Iron Condor to a strangle. It is easier to manage a strangle than Iron Condor when a trade is challenged. Although, trading strangles require large capital I am moving away from spreads and will be slowly converting them to strangles.
The new trades and adjustments delivered $783.00 options premiums last week. Even though the options income was smaller last week, we are still poised for the best month in 2021.
You can watch all our trades in this spreadsheet and you can also subscribe to our newsletter for our trade alerts.
Investing and Trading Newsletter
We started (or better say re-started) our free newsletter. We will send to our subscribers a notification of our new trades when we open them, when we adjust them, and when we close them or let them expire. The newsletter will also explain the trade and our expectations. As of now, it is free but it will not be free forever. But all existing subscribers will be grandfathered and receiving the emails for free.
Expected Future Dividend Income
As the table above indicates, our aggressive dividend growth stocks accumulation is starting to show significant progress in our future dividends income. Our portfolio dividend yield and dividend growth will be bringing us almost $135,787.62 in 20 years and $6,569,736.96 in 30 years. We will keep aggressively accumulating dividend growth stocks to generate liveable income sooner than in 20 years. And the portfolio is starting to show this to be happening.
Market value of our holdings
Our non-adjusted stock holdings market value increased from $62,960.61 to $70,601.91. We added many new positions, such as TSLA, ABBV, AAPL, EIM, EVN, etc. last week, and these positions do not show any profit yet. This had a significant impact on the overall portfolio performance. We, however, expect this to change.

Our goal is to accumulate 100 shares of each stock of our interest and we are getting to that goal. However, as mentioned above, this harms our dividend payout and portfolio growth. Although, it is temporary. Therefore, once we reach this goal (which we set because of the ability to trade covered calls), we will start accumulating these shares to equalize our dividend income rather than have an equal amount of shares.
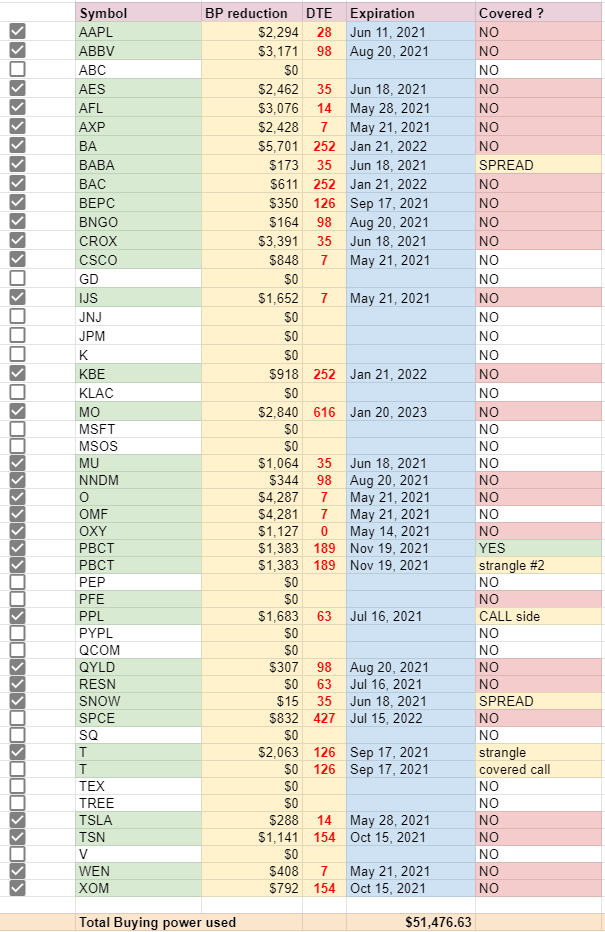
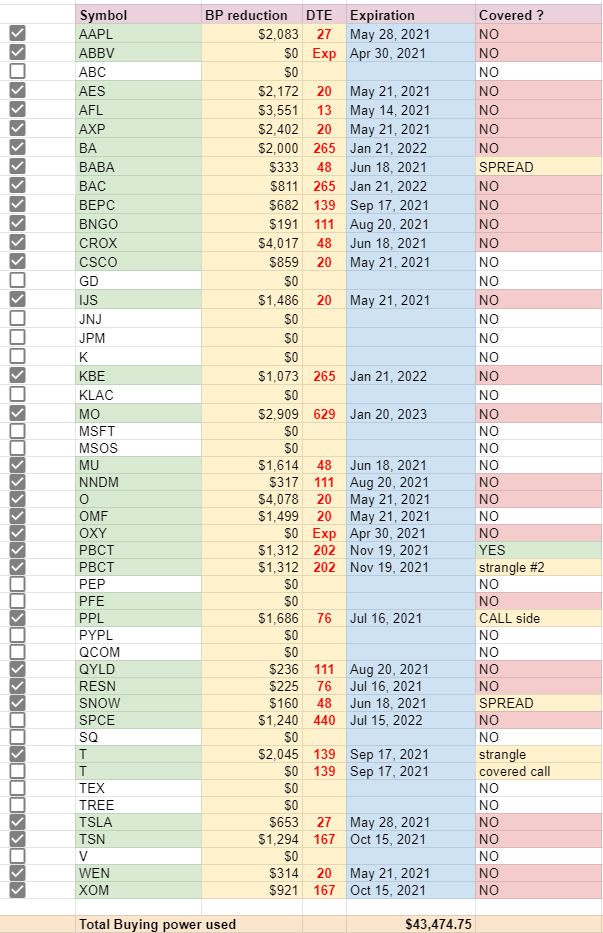
Open trades

The table above shows our open trades (in a simplified version) and the margin or buying power required for those trades. I keep track of this to see what trades I have open and when these trades are set to expire. It helps me to see all trades in one place and I can review them all at one glance rather than browsing through all positions in a brokerage account trying to figure out which trade needs my attention. You can follow more detailed trades in this spreadsheet.
A few of our trades expired last Friday that impacted our BP requirements. Our BP reduction dropped by 6.94% from $50,349.63 to $46,854.20 (-$3,495.43). We will reinvest this free BP next week.
Investing and trading ROI
Our options trading delivered a 7.35% monthly ROI in May 2021, totaling a 32.08% ROI YTD.
Our account grew by 228.02% this year.
Our options trading averaged $4,329.40 per month this year. If this trend continues, we are on track to make $51,952.80 trading options in 2021.
Old SPX trades repair
This week we have not done any adjustments to our old SPX trades. We are still sitting on those trades and waiting for the untouched side to close so we can roll the trades again. The goal will be to roll the trades until we will be able to close them for at least break even and release the buying power. We will keep doing this only if the resulting trade will be a credit trade or a very small debit. If adjusting these trades would require adding more new money, we would rather close these trades and move on.
Accumulating Growth Stocks
Last week, we took advantage of tech selloff and added 5 shares of SNOW and 1 share of TSLA to our positions. It is just a single share, but Tesla is an expensive stock and I can afford to accumulate these expensive stocks slowly. We still want to accumulate 100 shares of this stock and start selling covered calls. As of now, we trade Iron Condors against this stock, but once we accumulate shares, we will switch to a CC. I also plan to convert the Iron Condor into a strangle. That would require large capital (possibly around $8,000 of buying power), but I am OK with it. I plan on trading strangles against Tesla on weekly basis and hope to collect $600 a week premiums. Tesla is a very volatile stock so this trade will not be for everybody. It must be watched carefully and managed on daily basis.
Accumulating Dividend Growth Stocks
Our primary goal of our investing and trading strategy is to accumulate high-quality dividend growth stocks. Last week, we added 100 shares of EIM and EVN. We finished accumulating APAM and hold 100 shares of this stock. We sold AT&T (T) upon announcement of dividend cut and moved the cash to APAM. We accumulated a few shares of AAPL, and ABBV.
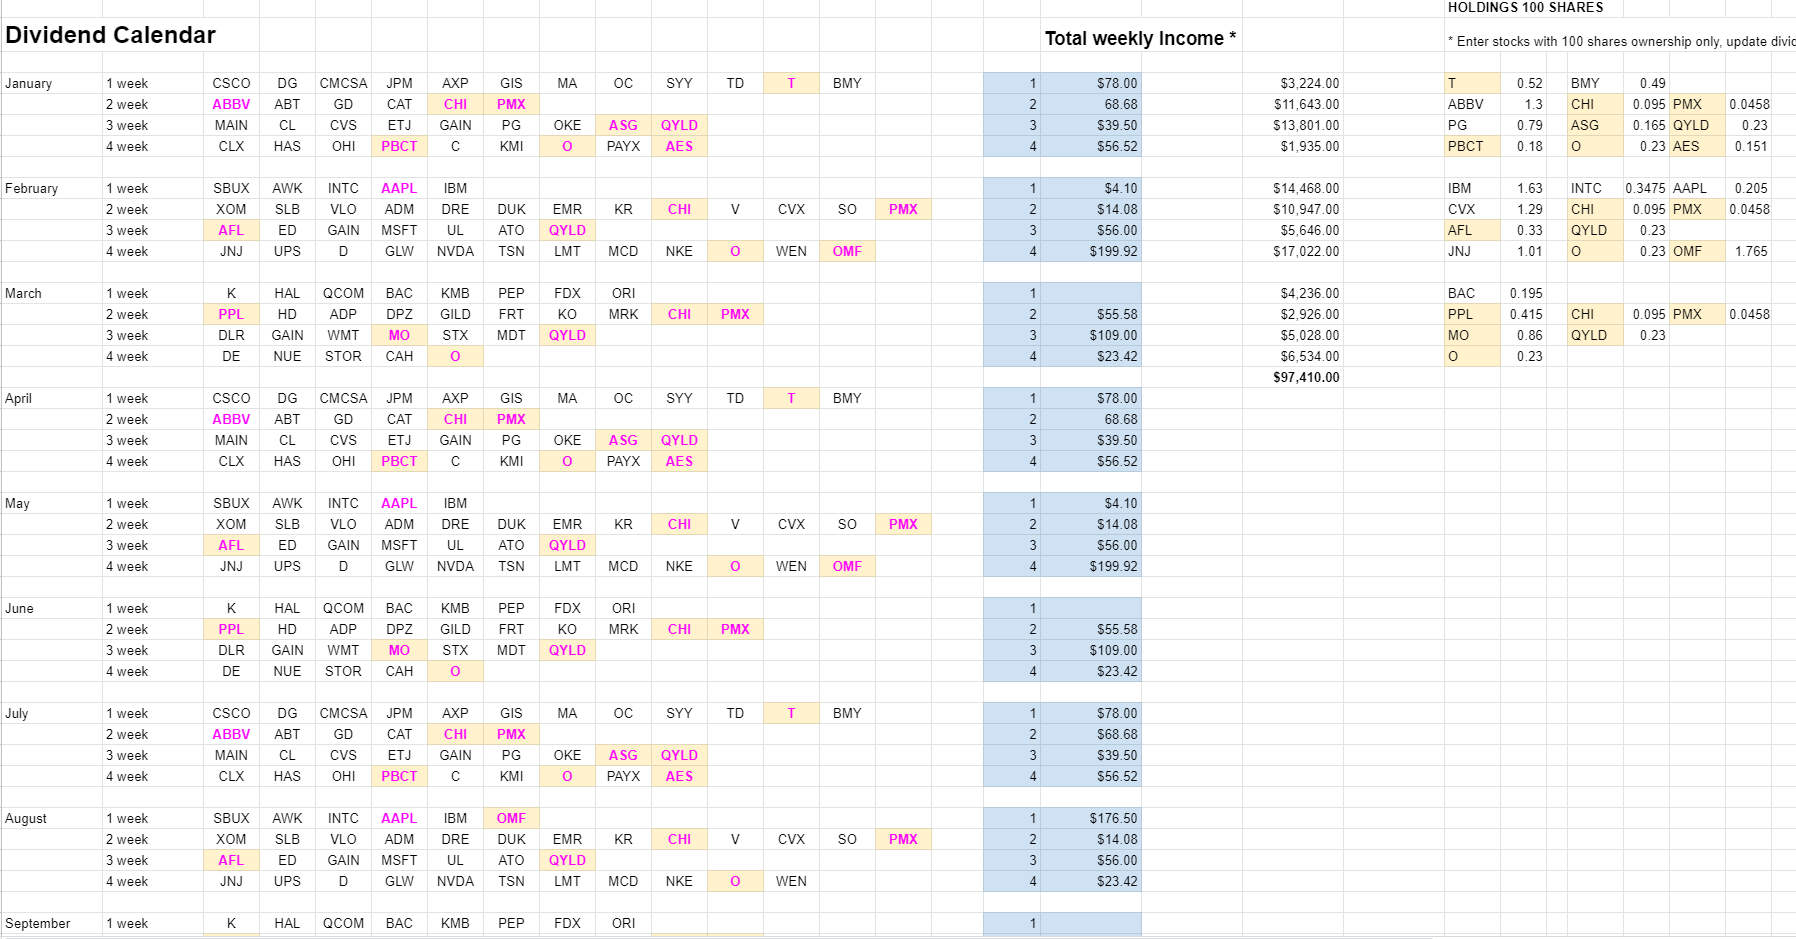
Our goal is to reach 100 shares of high-quality dividend stocks and build a weekly dividend income as per this calendar:

You can see the entire spreadsheet here.
We are reaching our weekly dividend income goal. The selling of AT&T derailed the goal a bit. We are replacing T with adding TD stock.
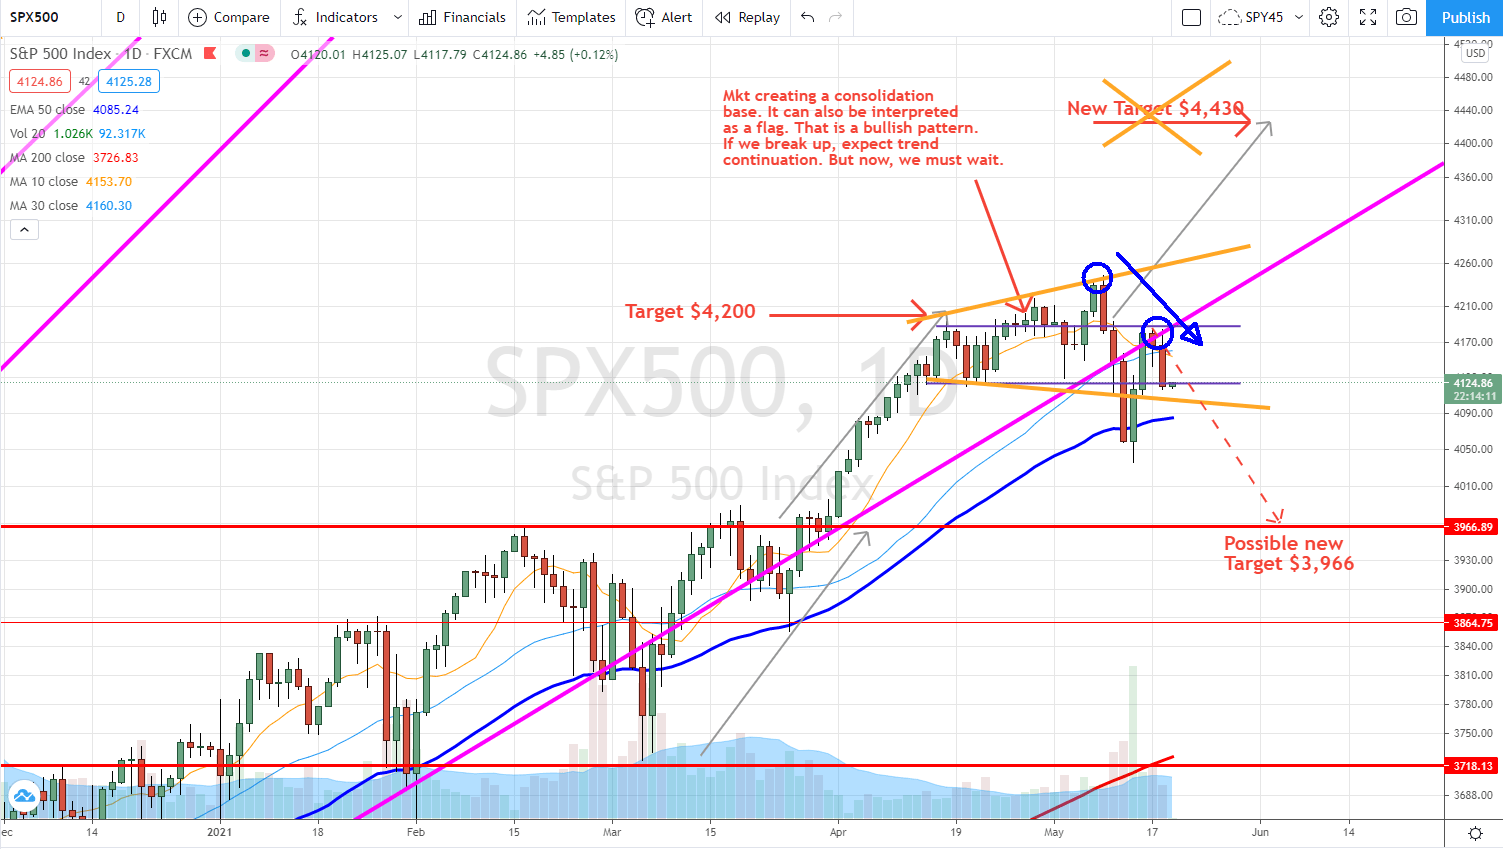
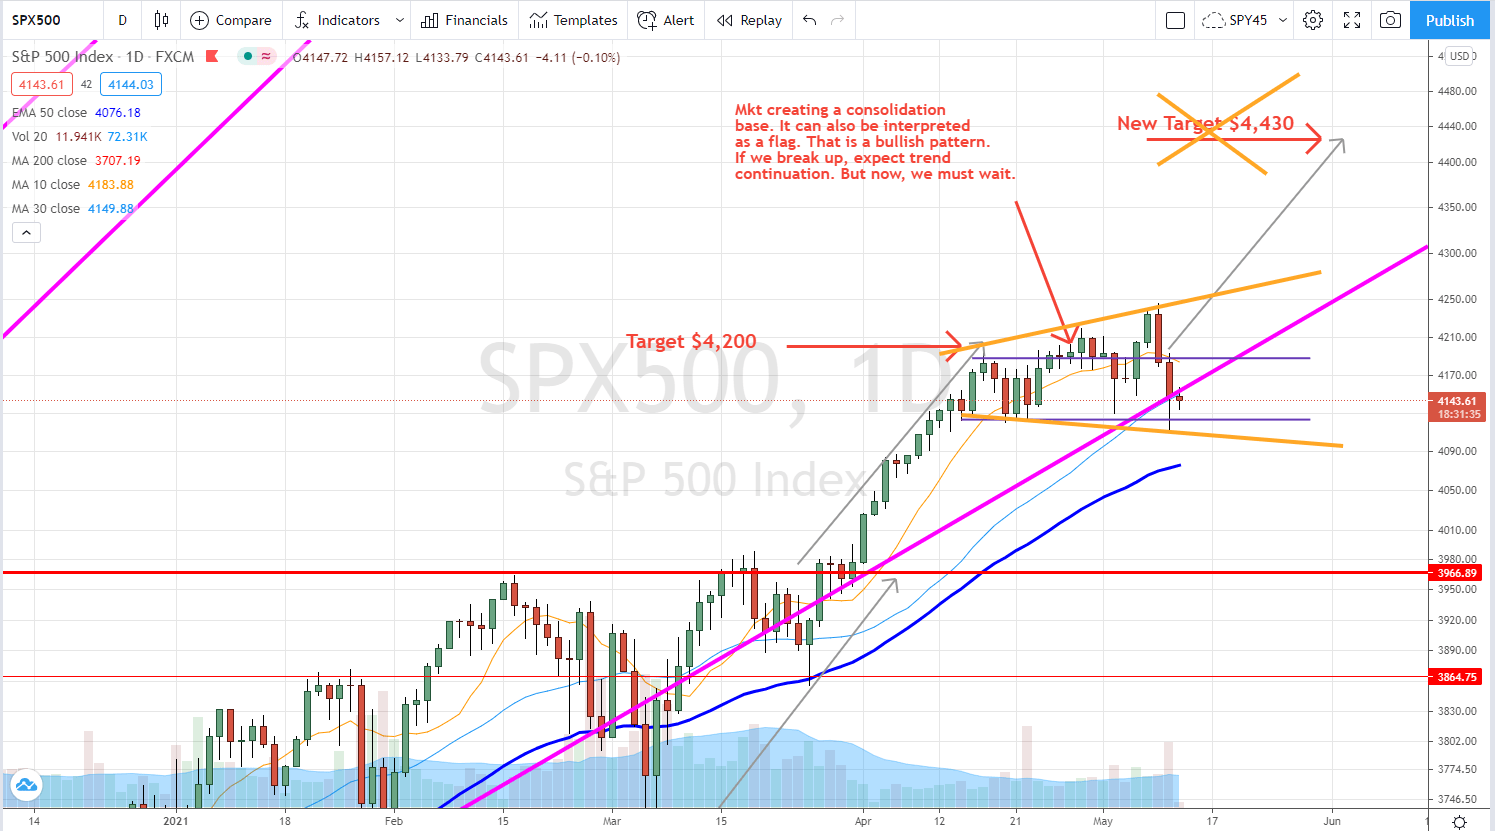
Market Outlook
The stock market is showing indecision. A few times last week, we saw a strong selloff two weeks ago and at the beginning of the last week, the market recovered the previous losses just to lose it all in mid-week. On Thursday, the market recovered it again, and on Friday the market rallied but lost all gains (showing a shooting star). This weakness still makes my expectation of going lower valid. If the market holds above the 50-day MA, we may see a renewed rally.

70% probability of going down
I give it a 70% chance that the $3,966 target will be met. The market is weak and indecisive and there are several factors that can be contributing to the correction. So far, we have seen 4.3% decline then recovery, and retest. But it is too soon to say whether it was a successful re-test or not.

This probability coincides with Ned Davis Research S&P 500 cycle composite market behavior indicating that we may be seeing a correction. The chart below doesn’t necessarily say that we will see a correction next week, the pattern is not indicative of when it happens. It just says that it will possibly happen but as of today, we do not know when. To add my say to it, I would suggest that we are near a correction (or at least a sideways movement).

Bullish and bearish cases
There are a few cases that speak to the bullish or bearish factors of this market. According to Fundstrat’s Tom Lee research, the institutional investors are sitting on $297 billion cash on the sidelines. That is a sum that can easily spike a bullish melt-up. That can be the last push-up before we see the correction.
On the other hand, we have fear of inflation, and Fed officials are starting to admitting that the inflation may be getting out of hand and a possible reaction from FED will be needed.
Investing and trading report in charts
Account Net-Liq

Account Stocks holding

The table above shows our current holdings and gains. The “Options Adjusted” columns indicate how options help to boost (or ruin) our stock holdings appreciation, or in other words, lowering the cost basis. Without options, our holdings would be up 5.46%. With options, our holdings are up 13.51% (from inception on 4/1/2019). The SPX is up 43.67% since inception.
Our options adjusted stock holdings underperform the overall market (up only 13.51% vs SPX 43.67%). On a YTD basis, the market gained 13.82% while our options-adjusted stock holdings grew 6.53%.
Account Growth YTD

The stock holdings growth slowed down because we added many new stock positions and these positions didn’t have time to grow yet, so I expect the growth trend to improve over time and beat the market.
Investing and Trading Report – Options Monthly Income

Investing and Trading Report – Options Annual Income

Our dividend goal and future dividends

Our portfolio still doesn’t represent the true dividend income potential, but we are already seeing the results of our accumulation effort. We are on track to accomplish our dividend income goal, currently, we are at 46.00% of the goal to reach $1,071 of dividend income this year.
However, the chart below indicates that our dividend income will possibly exceed this goal as we accumulated enough shares to receive $3,288.19 in dividends.

Our account cumulative return
The chart below indicates our cumulative adjusted return. It shows how the last week’s selloff shook down our returns but we are recovering along with the market.

As of today, our account cumulative return is 20.17% (since March 13, 2021).
Conclusion of our investing and trading report
This week our options trading exceeded our expectations. I hope, the rest of the month will be even better.
We will continue accumulating the dividend growth stocks in our portfolio to reach 100 shares. We will also replenish our cash reserves to bring them back to 25% of our current net-liq value.
We will report our next week’s results next Saturday. Until then, good luck and good trading!
|
We all want to hear your opinion on the article above: 5 Comments |


Recent Comments