Weekly Newsletter   Challenge account   Weekly Newsletter   


McKesson Juggling Series of Transactions as 1Q 2016 Earnings on Tap


McKesson Corp. (NYSE: MCK) is in the midst of key transactions that are intended to better position it to remain a leader in the healthcare services industry.

While its efforts are admirable, concerns have been raised about one of them.

Last week McKesson’s health solutions unit announced that it has expanded its
portfolio to include ClarityQx by acquiring HealthQX. ClarityQx offers a value-based payment technology.

Health plans use ClarityQx for analytics and for automation of retrospective bundled payment models. They also use McKesson’s Episode Management to support automation of prospective bundled payment, according to McKesson.
The collaboration is intended to enhance McKesson’s ability to help customers transition to value-based care by automating and scaling complex payment models.
 

 · Change Healthcare

 
The ClarityQx announcement came on the heels of the company announcing a complex deal to exit its IT business. Specifically, it said it was exploring strategic alternatives for its Enterprise Information Solutions (EIS) business, which provides core hospital information systems. EIS is reported as part of our McKesson Technology Solutions segment.

McKesson announced last month that it was forming a healthcare information technology company with Change Healthcare Holdings Inc. that will include the majority of the McKesson Technology Solutions businesses.

Change Healthcare is a healthcare software company owned by Blackstone and Hellman and Friedman. McKesson’s EIS business serves hospitals and health systems with software solutions, managed services, and infrastructure and hosting services.

These services help hospitals perform in the new healthcare reform environment.
The head of the EIS business said that while the company evaluates the best options, the overall priorities for EIS remain unchanged.

The concern over the EIS plan is that it could reduce McKesson’s financial flexibility. According to Moody’s Investors Service, the EIS development is credit negative because it will reduce McKesson’s diversification profile and its profitability.

While it did not change its rating for McKesson, Moody’s chimed in with its concerns. Diana Lee, a senior credit officer for Moody’s, stated in a recent ratings report:

“Moody’s estimates that McKesson’s pro-forma debt/EBITDA, excluding profits that will be contributed to the [joint venture], will be around 2.5 times.”
McKesson’s debt/EBITDA as of March 31 was about 2x, according to Moody’s.
 

 · Closing Rexall deal

 
The ratings agency, which affirmed its ratings for McKesson’s senior unsecured debt also pointed out some headwinds McKesson may have to confront.

Specifically, in the coming months, McKesson is closing its $2.2 billion deal to buy Rexall Pharmacy deal. Moody’s notes the deal is likely to result in additional borrowings.
 

 · Loss of Rite Aid

 
Moody’s also noted the possibility that McKesson will lose its Rite Aid contract if Walgreens Boots Alliance completes its merger with Rite Aid. However, McKesson has about $4 billion of cash and strong cash flow, which it could use to reduce its debt levels. In addition, the joint venture will dividend about $1.25 billion to McKesson at close, Moody’s noted.
 

 · Earnings on tap

 
Investors should get a better idea about how all of these transactions will affect McKesson next week. It is set to report its first quarter earnings for fiscal 2016 on July 27. The consensus estimate calls for it to report earnings per share of $3.39 on about $50 billion of revenue.

McKesson’s shares up roughly 9% over the past month, and about 14% over the past three months. It is also trading above its 50-day and 200-day moving averages by 8.62% and 12.07%, respectively. It has a relative strength index of 68.52, which indicates that it is not overbought.

At the end of June, McKesson announced that it was raising its previous guidance range of $13.30 to $13.80 per diluted share to a new range of $13.43 to $13.93 per diluted share. This updated outlook is driven by the early adoption of Accounting Standards Update 2016-09 as released by the Financial Accounting Standards Board.


We all want to hear your opinion on the article above:
No Comments


Calls to Break Up Big Banks Again Uncalled For


As Republicans gather for their National Convention this week, there is a brouhaha going on over the party considering resurrecting the infamous Glass-Steagall Act.

The thought of the conservative party bandying about this liberal idea has many perplexed.

Many are chalking up the Glass-Steagall Act talk as political fodder during this intensely charged election year.

No matter, this particular fodder puts banks, particularly big banks, back in the lime light. So let’s look at how they’ve fared since Glass-Steagall was put to bed years ago. We have to look no further than the earnings reports from banks for the second quarter. They began reporting them last week.
 

 · What is Glass-Steagall?

 
In 1933, the Glass-Steagall Act was signed in to law as an emergency response to the thousands of banks that were failing during the Great Recession. Specifically, the act broke up the banks’ businesses, separating the commercial and investments sides.

The law was eventually repealed in 1999 as part of a bill signed by then-President Bill Clinton. Taking its place was the Gramm-Leach-Bliley Act, which requires financial institutions that offer consumers financial products or services like loans, financial or investment advice, or insurance to explain their information-sharing practices to their customers and to safeguard sensitive data.

The thought of Glass-Steagall making a comeback does not sit well with banks. They dislike anything that seeks to break up their businesses because of the impact on their top and bottom lines. Glass-Steagall’s restrictions are seen by banking observers as having an overall negative effect on not only the banks, but also the economy.
 

 · The Big Banks

 
While lawmakers may think they know what’s best for the big banks, the leaders of these institutions think otherwise. Furthermore, their vast improvements from their financial lows of 2008 seem to be behind them.

Take their earnings reports that have been released so far this year. For the second quarter, Bank of America (NYSE: BAC) Citigroup (NYSE: C) and JPMorgan Chase (NYSE: JPM) have all posted better-than-expected results.

That does not mean they are out of the woods, as there are many overhangs that remain as concerns. There are concerns about growth in the global economy, especially in light of Brexit. There is also the question of when or if the Federal Reserve will raise interest rates. Oil price volatility only aggravates the situation.

Banks must also deal with mortgage banking fees that are not expected to improve marginally due to low mortgage rates.
 

 · Well positioned to deal with another crisis

 
We told you last month about how the big banks could withstand a financial crisis like the one that slammed the industry in 2008.

Specifically, we noted a scenario entailing global recession in which the unemployment rate soared five percentage points, and there was a heightened period of financial stress, and negative yields for short-term U.S. Treasury securities. Even in such a calamity, the big banks survive.

This was determined by the Federal Reserve through the 2016 bank stress tests. The Fed noted that the above “severely adverse” scenario projected that loan losses at the 33 participating bank holding companies would total $385 billion during the nine quarters tested, and that would be sustainable.

The tests marked the sixth round of stress tests led by the Federal Reserve since 2009 and the fourth round required by the Dodd-Frank Act.

The act, and its facets such as the stress tests, is sufficient enough to monitor banks’ management of their finances.

Banks may continue to be challenged by the current operating environment, but they have proven their resilience. Their improved finance controls help to mitigate the need to break them up.


We all want to hear your opinion on the article above:
No Comments


Just When We Thought Ackman, Herbalife Tango Was Over


If you are still scratching your head as to whether or not Herbalife (NYSE: HLF) is a pyramid scheme, join the club.

The Federal Trade Commission seemed to have reached a conclusion on the matter last Friday when Herbalife agreed to ante up $200 million as part of a settlement agreement with the agency.

However, now that the speed reading through the FTC’s report on Herbalife has waned, slower, more comprehensive reading of the report reveals that there are still issues that remain for Herbalife to resolve.

As the details of these revelations were exposed, the short-interest in the nutritional supplement’s stock picked up. Investors seemed to be questioning whether billionaire hedge fund manager Bill Ackman was correct in his multi-year long allegation that Herbalife is a pyramid scheme.

In fact, S3 Partners, which is a financial analytics, technology and services firm, found that the short-selling of the stock that slowed ahead of the report, has picked up again.
 

 · So what gives?

 
As rumors spread last Friday that the FTC would be releasing a statement that it found Herbalife to not be a pyramid scheme, the company’s stock began to soar. That stopped when the commission of the FTC stated:

“[Herbalife was] not determined not to have been a pyramid.”

Confused? Yes, we all were by that odd statement, including renowned hedge fund manager Carl Icahn who released his own statement that same morning saying the FTC settlement’s concluded that Herbalife is not a pyramid scheme.
 

 · Not so fast

 
The FTC quieted everyone that Friday morning with its official statement Herbalife “rewards recruiting at the expense of retail sales,” which is problematic for Herbalife and the entire direct selling industry.

Upon that news, Herbalife’s stock slid almost $6 from its opening price spike, closing at $64.26, notes to Howard Sugarman, a managing director for S3 Partners.

The question became, “Is this going to make this business model an issue for other direct sellers?” The model is also referred to as multilevel marketing. Other companies that have similar business models include Avon (NYSE: AVP), Nu Skin (NYSE: NUS) and USANA Health Sciences (NYSE: USNA).

Unsure what to make of the FTC’s news, many joined Ackman and began shorting Herbalife. However, they did not short it to the tune of Ackman’s $1 billion gander that Herbalife’s stock would fall to $0.

Herbalife’s amount of float that has been shorted is the highest among these three, at roughly 26%. Avon’s is just 6.4%, while USANA’s is 17.9%.

The increase in Herbalife’s short float is interesting. Sugarman found that short interest in Herbalife, which had dipped below $1 billion in the first quarter for the first time since January 2015, had been climbing in anticipation of the FTC declaring that Herbalife was primarily a pyramid scheme.

Since its mid-February lows, Herbalife’s short interest had raised almost $300 million, or 30%, even as its stock price rose 31% over that same time period, according to Sugarman.
 

 · Who’ll have the last laugh?

 
As noted above, Ackman has a $1 billion short position in Herbalife. Furthermore, despite the $200 million settlement, and the determination that Herbalife is not a pyramid scheme, Ackman won’t back down.

In fact, the manager of the Pershing Square Capital Management is “maintaining his bet against, according to Bloomberg Markets.

“Ackman plans to maintain it and will push regulators outside of the U.S. to investigate the company,” according to Bloomberg Markets.

Tired of defending itself, Herbalife released the following statement Wednesday:

“After more than two years of working with the FTC, I think we understand the terms of the settlement agreement very well. We would not have settled unless we had the greatest confidence in our ability to comply with the agreement and grow our business and we believe this will be proven out over time.”


We all want to hear your opinion on the article above:
No Comments


Selling naked puts and calls – managing an ugly trade into a winner


Predicting the stock market
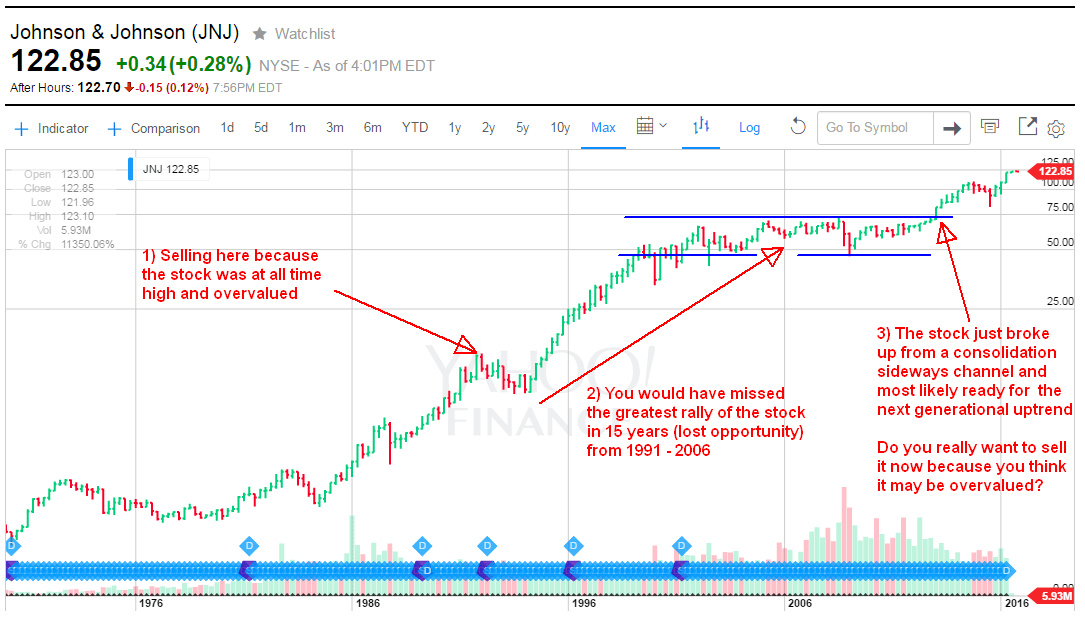
This is a chart a user named KubaW created and posted on StockTwits. I asked him based on what he believed that what he drew would rally happen and that his drawing was just a coloring book for kids and had no predictive value. My comment sparked rage from him and his ass-lickers who typically patted him on his shoulder what a nice chart he created.He called me an uneducated ignorant loser and never provided an answer.


Recently, I encountered a fiery discussion on StockTwits website with a few market predictors and weather casters (as I call them). If you follow me on this blog or in our trading Facebook group you know that I no longer try to predict the market or stock movement as I consider it foolish and ineffective.

You can read my opinion about market forecasting in a Strategy section. No matter what the market or your stock did in the past will not guarantee nor predict what it will do in the future. All those predictors do is just guessing. And they always have only 50% chance of being right. So why bother with an extensive charting analysis to just achieve 50% chance of being, right?


Let me share a story with you:

The semiretired chairman of the board of the brokerage firm was a long time trader with nearly 40 years of experience in the grain pits of the Chicago Board of Trade. He didn’t know much about technical analysis, because he never needed it to make money on the floor. But he no longer traded on the floor and found the transition to trading from a screen difficult and somewhat mysterious. So he asked the firm’s newly acquired star technical analyst to sit with him during the trading day and teach him technical trading. The new hire jumped at the opportunity to show off his abilities to such an experienced and successful trader.

The analyst was using a method called “point and line” developed by Charlie Drummond. (Among other things, point and line can accurately define support and resistance.) One day, as the two of them were watching the soybean market together, the analyst had projected major support and resistance points and the market happened to be trading between these two points. As the technical analyst was explaining to the chairman the significance of these two points, he stated in very emphatic, almost absolute terms that if the market goes up to resistance, it will stop and reverse; and if the market goes down to support, it will stop and reverse. Then he explained that if the market went down to the price level he calculated as support, his calculations indicated that would also be the low of the day.

As they sat there, the bean market was slowly trending down to the price the analyst said would be the support, or low of the day. When it finally got there, the chairman looked over to the analyst and said, “This is where the market is supposed to stop and go higher, right?” The analyst responded, “Absolutely! This is the low of the day.” “That’s bullshit!” the chairman retorted. “Watch this.” He picked up the phone, called one of the clerks handling orders for the soybean pit, and said, “Sell two million beans (bushels) at the market.” Within thirty seconds after he placed the order, the soybean market dropped ten cents a bushel. The chairman turned to look at the horrified expression on the analyst’s face. Calmly, he asked, “Now, where did you say the market was going to stop?…

Trading in the zone: Master the market with confidence, Mark Douglas, p. 76 – 77


The goal is not to predict where the market will go or what your stock will do, but always know what you will do.

And that was the deal with a few predictors on StockTwits when I told them that all they were doing with all their charting was just creating comic books.

Whining Baby And this caused them to steam like an old locomotive, calling me names, calling me ignorant, stupid, and of course blocking me. There was even one user with a username @Nickvee14 who went into a rage of hysteria, calling me a fraud and liar when he saw my trading results.

This guy has in his profile that he was a: “Former Owner of a Stock Brokerage firm 17 years on Wall St Managed High Net worth clients primarily . Now just trading for myself my comments are not advice , it is just my opinions”.

Read his description again. He reveals who he really was. He just managed wealthy clients. So all he did he was just a seller of lukewarm water. But being an owner or manger of a brokerage firm will not make you a good trader. And his rage confirms it.

Here is how he reacted to my trading results which you can see in My Trades & Income section of this blog.

Yes, all the trades on that page in the table are winners, all show green and positive outcome. And that caused our so called “former broker” going on a rage that I was a fraud and liar. Here is his raging:

 
Nickvee Raging
Click to enlarge and enjoy a furious reading.
 

Honestly, I have never seen such anger, rage, and hysteria so far and it was surprising to me.

What this person evidently failed to understand is that what you see in my results table is the result of my trade management. My goal with every trade is to manage every losing trade into a winner. This person was boasting about his trading, being a CEO, and predicting skills, but he was also revealing that he wasn’t a good, consistent trader at all.

Does it mean that since I had 100% winners shown in that table that I have always picked winners?

Far from true!

Many of the trades actually turned into losers right after I opened them! Many of those trades gave me a hard time and headache.

But as I said at the beginning of this post, it is not important to know what your stock will do, but what you will do when the stock goes against you. I no longer have to spend hours creating predictions, beautiful charts, constructing reasons, or forecasting next move, to trade successfully.

Successful traders know this. Losers spend hours convincing themselves about the next stock or market move.

When I was learning trading options, my mentor, a successful trader, taught me that it was important to make money even when you had a losing trade and everybody around you was losing money and panicking.

So how do you turn a loser into a winner?

I would like to share with you a history of one of my trades which went bust the next day and that there are strategies how you can play with your position to turn it into a winner. I used Seagate Technology (STX) as my underlying and it all started as a simple put selling trade. Was I predicting the next move of the stock? Absolutely not! It would have been worthless anyway as the stock later moved the way no one would had predicted unless you knew before hand what the company would report.


 · Initial trade – sell naked put


In April I sold a naked put with 33 strike. It looks all good and great. The stock was at the support and about to kick up again. Look at the chart at the time of opening the trade:

 
STX 01
 

However, the next day the stock plummeted to 27.11 a share. Ouch. What a blow.

 
STX 02
 

What do you do when something like that happens to you?


 · Trade repair #1 – collecting more premiums by selling naked calls


First of all, stay calm. This is not the end of the world. Unless the company is going out of the business, which STX didn’t, there is no need to panic. When your position plummets, you want to start collecting more premiums to offset your paper loss so you can get out eventually with a smaller loss.

But you can do this only if you have enough cash in your account so you do not get hit by a margin call when rolling more trades. So your next steps must take into account your size, risk level where you feel comfortable.

I immediately sold a naked call with 30 strike.

People, brokers, investors, and even some brokers will tell you that naked calls are extremely dangerous and risky. Don’t believe them. The have no clue what they are talking about. A naked call is dangerous only to an amateur trader or broker who is just selling some product to his clients and have no clue how they can be played safely. It is the same as claiming that the guns are extremely dangerous. Yes they are. They are dangerous in hands of idiots. Same goes with naked calls.

Why: This allowed me to collect more premium in case the stock stayed lower for longer time. I was now playing a downside of the stock.


 · Trade repair #2 – roll busted puts


At the same time when I was selling my naked calls I rolled my exiting 33 strike put down to 32 strike. It was simple. I bought back my old 33 strike put and sold a new 32 strike with longer expiration day. And it doing so, I collected another nice premium (it was another 0.80 cents or $80 dollars on top of the premium I collected on my original trade).

Why: By rolling I was lowering my strike so now the stock doesn’t have to recover all the way up to 33 a share but only to 32 a share. Today, as of this writing, we are almost there. We almost recovered. But if we do not recover, I am prepared to roll again when times come. I have a plenty of time and I can wait. The new trade has expiration in December 2016 and if we do not recover by December I will roll down and away in time again. I may roll down to 31 or even 30 strike. We will see.

The next benefit of this move was that I collected another premium to offset any potential losses. But there will not be any losses at the end.

You may ask why I was rolling into December blocking my margin for so long. Well when the stock plummets like this you want to avoid early assignment. Moving your trade 250 days away will do the job as no one sane would early assign such long trade unless they know something such as company going to bankruptcy for example.


 · Trade repair #3 – protect your naked calls


Unfortunately, the stock started recovering from the fall. It went up from $25.59 a share all the way up to $27.34. This started to be dangerous to my naked call with 30 strike. So, I was thinking what are my options. I could let it run and roll the calls higher and away in time, or buy 100 shares covering my calls and making it a covered call trade.

I decided to buy 100 shares at 27.29 a share.

Why: At the time it seemed as a good move. The stock was recovering very fast and if it managed to expire in the money I would collect a very nice profit on the stock and on the calls.

Yet the market had different plans.


 · Trade repair #4 – collect more premiums


As the stock was recovering I sold another naked put at 26 strike to collect even more premium.

Why: I wanted to reach a position when you can play this trade with house money if it went even worse. But it went great, the stock was recovering and I had all my trades covered.

But then an earnings report came out and the stock plummeted again. This time from $27.40 down to $20 and a few days later to $18.42. That wasn’t great. But again I wasn’t panicking or freaking out. I take these trades as another opportunity although it blocks your money and slows down your future earnings. But I take this game that I want to be a consistent winner and not a racer. If it happens and I have to wait for my money 200 days instead of 19 days I am fine with it. It happens.

 
STX 03


 · Trade repair #5 – grab profits, short more, and collect more premiums


As the stock plummeted more, I could close my 30 strike calls for 50% credit and immediately sold new calls at 28 strike. These new calls expired the very next day for a full profit.

Since the new calls expired the very next day (I was in this trade for only 1 day, 469.29% annualized return), on Monday I could sell a new covered call at 23 strike. At the very same time I rolled my 26 strike put down to 24 strike and collect more premiums.

When the stock reached $18.40 a share and started reversing I sold a new naked put with 18 strike. The $18.42 seemed to be the bottom and the stock continued marching higher again.

This allowed me to close my 18 strike puts for 50% credit profit and open a new naked put trade with 19 strike to collect more premiums. I could close 19 strike puts later for 50% credit.

As of now I collected $1,763.00 dollars in premiums and had the following open trades:

 
– (1) short naked put 32 strike (the rollover of the original 33 strike put) and still ITM
– (1) short naked put 24 strike (the rollover of the original 26 strike put) and still ITM
– (100) shares of STX at $27.29 a share and still in a loss
– (1) covered call at 23 strike


 · Trade repair #6 – manage your calls when under water


When you get assigned to a stock and you start selling covered calls against it when your stock is deep under, like in my trade when I bought shares at $27.29 and stock was trading at 20 or 21, you will not be able to sell a call at 28 strike for example to get out of your shares with profit. So you have to sell closer to the money (as I did and sold 23 strike).

But doing so, you are taking a risk that if you get your calls assigned you will be selling your stock at 23 a share while you have bought it at $27.29 a share. That would be a huge loss which you do not want.

When you are in a such situation you have to manage actively your calls to avoid it. It may happen if you get assigned early (that’s why you want to be selling longer term calls so assignment is unlikely), and it would be unfortunate if it happened, but that’s the part of the game.

So when the stock started approaching my 23 strike and it even exceeded it in some days, I rolled my 23 strike calls higher to 25 strike. This got me higher to my original stock purchase price and I was ready to do it again as long as I got the strike price above $27, ideally to 28 strike at which level I would let my stock be called away.


 · Trade repair #7 – rolling and new trades to improve the trade


Mr. Market had a different opinion and didn’t want to give in so easy. These days the company issued a preliminary earnings results which exceeded Wall Street’s expectations. The stock jumped 13% overnight and finished almost 20% by the end of the next trading session. It had a few positives and one negative.

My 24 strike naked put was no longer in the money.

But my 25 strike covered call was in the money and at the level I didn’t want assignment.

I took a look at the option chain to again evaluate my options to fix this. Obviously I didn’t have to do anything with my puts, but I needed to do something with my calls. I didn’t want assignment at 25 a share while I bought the stock at $27.29 a share although I collected more than $2,000 dollars in premiums so I could afford taking a loss on the stock. But why taking a loss when you do not have to.


 · Trade repair #8 – converting calls into puts and selling more calls


In situation like this when you get your calls ITM it is sometimes helpful to convert them into puts than keep rolling them higher. I reviewed what could have been done and I saw I could convert my 25 strike ITM calls into 32 strike puts and I moved them far away in time to collect better premiums and also get more time. I simply didn’t want to deal with those puts now, so I literally put them aside for later time to either roll them lower or let them expire if the stock moves higher by expiration.

Once I converted my calls into put I immediately sold already ITM 28 strike calls. These calls were above my stock purchase price of 27.29 a share so I could let them get assigned and close my trade for a profit.

My calls were assigned this weekend and I could sell my 100 shares for profit as well as profit on the covered calls.

During this time I managed my trades to finish as winners. Overtime I collected $2,615 dollars in premiums and I also collected $63 in dividends while waiting for assignment.

I ended up with the following positions:

 
– (1) short naked put 32 strike (the rollover of the original 33 strike put) and still ITM
– (1) short naked put 24 strike (the rollover of the original 26 strike put) now OTM and possibly set to expire worthless or be bought back for 50% credit profit
– (1) short naked put 32 strike (the conversion of the original 25 strike call) and ITM
 

So there are still trades which need my attention but I am confident that before they end I will be able to manage them into a winning trade. Lately, I also opened more new trades against STX and collected even more premiums and no matter what happens with the stock, I will manage it into a winning trade.

As you can see, I do not have to predict what the stock or the market will do. I do not have to be creating comic books of nice technical analysis charts and forecast the next move and misleading myself by false expectations and predictions which may not happen.

All I do is a simplistic method of determining a trend and then trading that trend. And if the trend changes use all tools available to respond to a new situation. It is a beauty of options that you have that flexibility that you can be rolling or reversing your trades to make it work. It is all about knowing what you would do instead of knowing what your stock or market would do.

And yes, there will be people out there who would be calling you names and spit their envy and anger on you when you tell them that what they do is futile and that you can do better without it like that whiny poor trader I showed you above.

Of course, you may doubt all I wrote above about the trade and my steps to fix it. But all my trades are posted live in our trading Facebook group and joining the group is free. You can follow my trades in the group and see for yourself that it really is possible to be a consistently winning trader. There are other traders too, posting their trades and you can follow them too.


“Truth is like poetry.
…and most people hate poetry.”
unknown author, somewhere in a Washington D.C. bar


We all want to hear your opinion on the article above:
7 Comments


Interest Rate Hike Still Not Expected Any Time Soon


Last week’s jobs report for June was unexpectedly high, leading to record highs for some stocks. While the economic indicator is important in measuring, investors should not bank on it being the sole reason to invest as a bear or bull, for that matter.

There are particular sectors that could make for solid investments, including retail, health care and food services. These sectors have added jobs on a month-over-month, and year-over-year basis, which bodes well for them being considered as long-terms investment plays.

However, in the short-term, investors should be pragmatic in making their investment decisions.
 

 · Consumer confidence

 
Many investors took solace in the report as being an indicator that the economy is thriving and expanding. Furthermore, some market observers think it would be foolish to not see the strong jobs report as a reason to invest.

Erik Davidson, chief investment officer at Wells Fargo Private Bank, believes this is a golden age to be a consumer in the U.S., and he notes the jobs report as showing solid jobs growth. The relatively strong dollar and low interest rates that make borrowing cheap, as reasons investors should consider investing in the consumer discretionary and technology sectors.
 

 · Making lemonade of lemons

 
Friday’s stock market rally was expected, and many investors hailed it as being a reason the Federal Reserve Board would increase interest rates this year.

When it is raised, the general effect is a lessening of the amount of money in circulation, which works to keep inflation low. It also makes borrowing money more expensive, which affects how consumers and businesses spend their money; this increases expenses for companies, lowering earnings somewhat for those with debt to pay. Finally, it tends to make the stock market a slightly less attractive place to investment.

This put back at the forefront the main headwind investors must keep in mind about the stock market – when and if the Federal Reserve will raise interest rates.
 

 · No foreseeable interest rate hike

 
As investors search for reasons to invest in the stock market, the low interest rate environment continues to give many pause and angst.

The importance of strong job growth is part of the Federal Reserve’s analysis process in determining if they should raise interest rates from their historic lows.

Investors had been exuberant prior to the release of the May jobs report over the real possibility of the Federal Reserve raising interest rates last month. Those hopes were dashed when those May numbers came in surprisingly, and terribly low at under 40,000. When Federal Reserve chair Janet spoke to members of Congress in June, she noted those weak numbers as reasons as to why the fed would continue to watch job growth numbers before raising rates.

Investors should be clear in understanding that the better-than-expected numbers posted in June will not likely be the catalyst for the reserve board to raise rates in the foreseeable future. What is needed are increasing month-over-month job growth numbers, or at least steady numbers.

This type of thought is further bolstered by the thought that the Federal Reserve isn’t going to raise rates in the immediate future, such as July, when the board meets again.

Investors are searching for reasons to believe that the economy is on path for continuing improvement. The jobs report provided some solace; we’ll get a better idea of how the Fed may move in regards to the interest rate through the second half of the year.


We all want to hear your opinion on the article above:
1 Comment


Why dividend investors are selling and why they will regret it


Trader worried
 
A few last months I noticed that dividend growth investors are selling their stocks and they say it is because of valuation. This post was inspired by them and the latest post by my friend Ferdis publishing at his blog DivGro and his latest post.

The argument goes that the stock market is too high, valuation of the dividend stocks is also too high and by trimming or selling their positions they will be able to buy back later for a lot better price.

Maybe they will be able to do so. Maybe the market will crash in the next few months and they will be able to buy back at a better price.

But this means that you have to go into a business of predicting the market. And predicting the market is a fools game.


 · Why predicting the market will not work


When I started investing into dividend stocks and trading options I believed that I needed a strategy which would help me to predict the market or stocks move and potential trend reversals. I wanted that miraculous trading software, system, or strategy which would predict the trend reversal and I would always, or almost always, be on the right side of the market. I hoped I would be always trading with the trend and spot any reversal on time. Or end of a bull market or bear market respectively.

It doesn’t work.

The longer I am in the market the more I am convinced that you will never be able to correctly and consistently predict the market or end of the trend no matter how much you are going to rationalize your predictions.

If we cannot predict the market correctly how do you know then that your stocks will go down and you may be able to buy cheaper later?

Predicting the market does two damages to you:

1) Psychological damage

By predicting the market you are setting yourself up for a big disappointment. You spend a lot of time calculating your fair value, predicting future sales, revenue, expectations, or goals of the company management. You are even going to defy and ignore political pressure which is strong these days and drive this market higher just to build your bearish case.

Yet, when your expectation goes bust, you will be disappointed or even angry at the market that it didn’t do what you expected, or FED that it rigged this market, or high frequency trading which ruined your gains, or other traders who over-reacted or who traded at unreasonable euphoria and greed.

Everybody will be at fault but you just because you were foolishly setting up your expectations without knowing all variables of the market out there which can change the game at a dime.

Just look at the latest Brexit event.

When the market tanked the first day after the vote, bears were congratulating themselves for the perfect timing of the drop they have been predicting for weeks. Five days later the market was where it has been before Brexit and bears were shocked in unbelief blaming central banks for stepping in. But otherwise, if it wasn’t for the central bankers the market would for sure crashed. What fools!

Unfulfilled expectations and disappointment are a huge emotional blow to your mind which will impact your future confidence. Do you really want to do that?

2) A lost opportunity damage

Besides the psychological and emotional damage you are defying the entire purpose of investing into dividend stocks.

What is the rule or premise of dividend investing? Why did you choose dividend investing in the first place? Did you choose dividend investing for trading the stocks? Because what you are doing now is trading.

I picked dividend investing because I didn’t have to trade those stocks. If I was investing into growth stocks or wanted to be a swing trader (which at some point I wanted to be but failed), trimming of the gains and relocating them to different stocks or better opportunities would have its merit. Dividend stocks are not in that category. You do not trade the dividend stock because of valuation.

In fact, I do not care what the valuation of dividend stocks is after I purchase them. Yes, prior to my initial purchase I try to see if I can buy cheaper or what the fair value is, but once I buy, I leave it. I do not care what the valuation is. If the stock is going down, I am buying more shares, if the stock is going up I am buying fewer shares. But I am not selling because the stocks went up. Not the dividend stocks and not in my dividend growth portfolio.

I learned my lesson on this the hard way.

 
Markets in Panic
 

The chart indicates that investors are mostly in bearish mood close to panic. Historically this has been a bullish sign and markets rallied. When you compare this to the sentiment on other websites tracking investors’ sentiment you will find the same results of investors being extremely bearish.

“Ironically, history shows that fear of a crash has a poor track record of predicting crashes. Conversely, some of history’s worst crashes came when no was expecting one.”

“We continue to note that the sentiment backdrop is far from extreme optimism and instead quickly shifts to gloom and doom during market downturns,” Oppenheimer’s Ari Wald wrote in a note to clients. “We saw this again last week as shown by a spike in the number of news stories referencing the words ‘Stock Market Crash’ to its highest level in years. For comparison purposes, there were significantly fewer occurrences of this through the topping process in 2007.”
 

A couple of years ago I bought shares of Johnson & Johnson (JNJ) stock when it was trading at $58 a share. When the stock moved to $78 a share I decided to trim my position expecting that when the stock falls back down to ~60-ish level I will buy back in.

It never happened. The stock now trades at $122.80 a share. I regret I ever sold my JNJ shares.

Realty Income (O) is another stock I purchased when it was trading at $37 a share. When the stock moved to $52 a share I sold because Realty Income was so overvalued that it was obvious that it would have to go down.

Well, yes it went down to $47 a share. But I never bought back because I expected this stock to go lower. Investors were talking about buying Realty income when it gets below $40. And I foolishly agreed with them.

The stock never reached $40. Today, it is trading at $69.91 a share.

Why selling your winners which are making you money just because you think it is maybe overvalued so it must go down? And even if it does go down, how low would it go? When? And how do you recognize whether a decline is a beginning of something more dramatic or just a breather before the next move up?

If the Realty Income stock drops by 20% on Monday, it would only fall to $55 a share! The stock would have to fall by whopping 47% in order to get to the same price I bought originally. And yet this wouldn’t justify selling this golden goose. If the stock drops by 47% I would still keep my original shares, and buy more even if I had to borrow money to do that.

It took me years to build my portfolio and build my yield on cost and I would ruing it by selling? No way!


 · When do you really sell?


When I started with dividend investing in 2006 the first thing I learned was to pick a good, high quality dividend growth stock, buy it, and never sell. The only reason to sell would be if the company doesn’t rise the dividend, cuts it, or suspends it whatsoever. This would be the only prediction I would agree to do: will the dividend be suspended, cut, or is it in danger? If yes, then maybe sell your stock or buy puts as a protection, just in case.


 · Is valuation a reason for selling?


As I said above I consider valuation important only when buying the stock and opening an initial position. Adding to the stock then can be tricky, but I do not cry over a growing stock. It is good when it is growing, so why bother selling it? I like to be sitting on a large gain built over years. I do not need the money.

But selling because it went up? I gave you two examples when by doing so I lost great opportunity.

The dividend stocks will always tend to be overvalued. Realty Income (O) for example is a stock which will always trade overvalued. Waiting for it to drop to its fair value you will never buy.

Or you might be able to buy only when the market crashes like it happened in 2008. But waiting for such crash may take another five or more years. And yet many investors, even the dividend ones, do not buy because they are scared and run to safety by selling the rest of their positions to preserve cash.

So now you are selling because the stock is overvalued and when the valuation crashes you are scared to death to buy and never get in or too late.

This is emotions!

 
JNJ trend
 

If you are investing following this pattern you are dooming yourself to mediocre results never beating the market. Don’t believe me? Then pull out old data from 2008 – 2009 and study them. It happened.

And I must admit it happened to me too! I too was scared to be buying in the beginning of 2009 because I refused to believe that the market really reversed.

And again in 2010.

And again in 2012.

And still I was nervous in 2015 and 2016 when the markets dropped. But fortunately already educated enough not to panic and start selling. At least I had my DRIPping on and reinvesting all my dividends.

Today? I would never sell just because the stock went up. And I would buy more than usual if it goes down.

That’s why I am creating my sub-account named “a great opportunity fund” where I place a couple of thousands of dollars which I won’t use to buy shares on a regular basis but only if any of my stocks crashes and I can buy more than usual.

Many times on this blog I said that I do not care what the value of my stock or entire portfolio is as long as my dividend income is intact. Many stocks in my portfolio actually grew and increased their dividends during selloffs and crashes. JNJ increased dividends twice during 2008 and 2009 when everybody was freaking and selling (from 0.41 to 0.46 in 2008 and 0.46 to 0.49 in 2009).

Of course, I ended up holding a few bags of crap in my portfolio (mostly energy stocks, and prior to them mREITs) which cut their dividends and I didn’t respond to it.

But, nobody is perfect, right?


 · The only valuation that matters is time value


Selling stocks in your portfolio may have its purpose based on in which phase of your portfolio you are.

Are you in an accumulation phase? Or are you a few years prior to retirement?

If I have more than 20 years until retirement selling stocks in my portfolio because the S&P 500 is at 2129 value and that is too high is laughable. What is too high?

When S&P 500 was at 100 in 1969 people thought this couldn’t go higher. When we stalled under 500 during 1993 – 1994 people thought “this is it” we are at all time highs, the market is overvalued. It traded just below 500 for two years before it finally jumped over 500 level and moved higher.

And same happened when we approached 1500 level. Yes we had two major corrections at that level. It took 10 years before we were finally able to move higher, but today we are higher than we were in 2008.

And if you were in this game in 2008 as I was, did you predict correctly the market’s crash? And its recovery?

I wasn’t able to do that. The best approach was to stay through, reinvest the dividends, and eventually buy more shares.

I again have a great example:

I had my ROTH IRA and my 401k accounts riding them through 2007 – 2009 (until today).

In my ROTH IRA I was paralyzed by the events. I tried to trim some of my positions to protect my portfolio and failed to buy back in disbelief of a recovery. The result?

A loss. I sold low and bought high.

In my 401k I continued investing a portion of my salary (with the employer match) and reinvesting all proceeds. The result?

I quadrupled my account (it went from $15k to $73k). Because my ROTH IRA was an experiment to prove that a self directed retirement account investing into individual stocks is better than a mutual fund based 401k I contributed the same amount of money to both accounts to have same starting conditions. Yet, thanks to consistency and sticking to the plan, 401k beat me. ROTH lost money.

This lesson contributed to my final realization, that my dividend investing is like a mutual fund. Consistently invest, reinvest, and never sell. Since then My ROTH kicked in and it is speeding up surprisingly well.

And in the next 20 years, the S&P 500 might be at 6000 value (not a prediction, just a number for the sake of an example), so why freaking today that 2129 is too high?


We all want to hear your opinion on the article above:
5 Comments


Rosey Job Numbers Hide Some Disturbing Issues


Stocks surged on Friday after the better-than-expected jobs report came in for the month of May. However, in light of the dismal report released the month before in May, investors may be a little skittish in making sound investment decisions based on these reports.

The number of jobs created during the month of June increased by 287,000. However, a closer examination of the entire jobs reports must be reviewed before being convinced that the important jobs numbers give signs that we are not completely out of the woods.

The unemployment rate ticked up to 4.9% reported for the month of May, when it was 4.7%.

Economists had forecast that nonfarm payrolls in May grew by 160,000, which would have been on pace with the numbers posted for April.

Here’s the issue. As the June numbers showed shockingly higher numbers over those reported just a month before, it must be taken into account the figures that show all is not as grand as those widely reported numbers on Friday.

The number of unemployed rose to 7.8 million, which was an increase of 347,000.
Then there is the issue of the number of people who are not looking for work because they believe no jobs are available for them. Those people make up a group referred to as “discouraged workers.”

The number of people who fall into this category did decline in June by 151,000 to 502,000 people compared to the same period last year.

The decline in the number of people in this group is a positive, but the number of long-term unemployed must also be factored; and that’s when the rosy 287,000 figure becomes less rosy.

Improvement in the outlook for discouraged workers must be acknowledged as a factor that impacts improvement in the overall economy.

At two million, the number of long-term unemployed, which are those who have been jobless for 27 weeks or more, changed little in June and accounted for 25.8% of the unemployed.

Then there is the labor participation rate, which was 62.7% for the month of June, which was just a tad bit higher than the 38-year low of 62.4% reported in September of last year.

As noted above, the May Jobs report was too meager to ignore. A mere 38,000 jobs were created, leading the Fed Reserve Chair Janet Yellen to immediately voice her concerns about job growth and the overall health of the economy.

Another reason investors should view these jobs numbers with caution is how off they are from previous reports.

In The Wall Street Journal last week, this was stated. “Consensus [estimates haven’t] been this off for two straight months in nearly 10 years.”

The Journal noted that this is the biggest gap since 2009. Furthermore, The Journal described the two-month miss as exceedingly rare.

“Combined with last month’s sizable miss, the recent job numbers have now accomplished something we haven’t seen in nearly 10 years,” Instinet’s Frank Cappelleri told The Journal. “The last time we saw the actual number beat by more than 100,000 after missing by greater than 100,000 the month before was in late October 2006.”

While the numbers show that June added a surprisingly strong number of jobs, these other stats throw water on the notion that the economy is moving along full speed ahead. Some observers say the strong jobs report in June helps alleviate fears that the economy was weakening.

Look no further than the surge in the markets after the release of the June report on Friday. Even the downtrodden 10-year Treasury yield reacted strongly, moving above 1.4%.

Be cautious in using the jobs report as your main gauge in deciding to invest. Look for a trend that shows increasing monthly numbers, or at least steady numbers.

Follow the Federal Reserve’s actions over interest rates. Note that increasing the rates may impact consumer spending, especially on big ticket purchases.


We all want to hear your opinion on the article above:
No Comments


Posted by Martin July 06, 2016
No Comments


TRADING RULES – RULE #2 – Trade often


Trade often means that you are trading as often as possible. You want to be soaked into the market and feel its pulse. You want to be always focused.

But how do you do that to trade often and not to break the rule #1 “Stay small?

This can be a tricky part. First you use the rule #1 to determine what you can afford to trade without over trading or opening too large positions. For example, according to the rule #1 you can risk (or commit) a certain cash amount in your account (maybe representing 20% of all your available cash).

Then, when you choose a few stocks you want to trade options against and find out that you can trade for example total of 20 contracts per each selected stock and you plan on trading options against 3 stocks.

Instead of opening one trade of 20 options contracts, you split the number and open one week (or day, or month) one trade with 3 contracts, next week another trade with 3 contracts, next week another trade with 3 contracts, and so on. And you do it again and again as long as you decide to choose a different stock or add more contracts or run out of money.

Wait, did I just say “run out of money”?

Well, yes, sometimes you may experience a situation that your position gets in the money, you will have to roll, and such rolling trade would continue blocking your money so you won’t be able to open a new trade. You ran out of money.

And then you repeat this process like a Merry-go-round. When the old contracts expire or get closed (bought back) you commit that cash in the next trade. And you rotate the trades forever.

Do not compound your trades. Maybe you want to stay at the same level for the entire year although in November you will be able to trade 30 contracts in lieu of 20 as of January, for example.

Why? Why do you want to keep the exact amount of contracts for the entire year or longer (the period depends on you)?

It is psychological. As your account continues growing it may be very tempting to start compounding your trades by adding new contracts because now you can afford it. It will be very easy to over trade and ruin your confidence. One unfortunate blow and you would ruin months of hard work. With the original size of the contracts, the pain will not be as big and you still would survive.


 · Why do you want to trade often?


It’s like practicing trading. You want to be exposed all the time (or as much as possible as I understand that if you trade a small account it will be difficult to be exposed all the time).

It is like if you tell me, a lazy, couch potato person, to go out and run 5 mile marathon. I would die after 100 yards of a heart attack. Before I would be able to run 5 mile run I would have to practice. I would have to run a few yards every day, do it regularly, and slowly increasing the load and run more and more. But you also do not increase the load on a daily basis. First few months you run 50 yards, then after 6 months you start running 100 yards, then 500 yards and so on until you get to 1760 yards (1 mile).
Same goes with trading. If you want to be a successful trader and have consistent winning results, you have to be like me the practicing runner or you can die of a heart attack.
Start small, small trades, even one contract per trade, but trade as often as possible. Increase the load (number of contracts) only after you master the smaller trades and have enough cushion in your account to do that.


We all want to hear your opinion on the article above:
No Comments


Posted by Martin July 04, 2016
No Comments


TRADING RULES – RULE #1 – Stay small


It is easy said than done. What is it “stay small”?

Stay small refers to opening only as many trades and as big so you stay comfortable with it even when the trade turns against you.

You may say that it is obvious but it can be very tempting to break this rule. Let’s say you open a trade which is withing this rule and everything goes great, the market goes up, your trade performs well and you are in euphoria. So you open another trade. What can go wrong here. You will be out of both trades in a no time for a big win.

But the very next day the market crashes and both trades go against you. Your buying power shrinks by 70% and your net-liq by 50% in a day!

How would you feel? Terrible, mad, angry, frustrated, scared? You will feel pain and fear because you know that at some point if the market doesn’t reverse, you will be forced to close your losing positions upon a margin call and you will be helpless. That’s how losses come.

Believe me, I have my own experience and I still fight with my own temptations breaking this rule and then being mad at myself. Don’t repeat my mistakes!

To avoid pain, open only one contract, if you have to, to stay in your comfort zone and wait until its end before you open a new one. That’s the rule #1.


We all want to hear your opinion on the article above:
No Comments


NASCAR Track Owner Earnings On Tap; Declining Attendance Remains a Headwind

NASCAR Track Owner Earnings On Tap; Declining Attendance Remains a Headwind

The world got the chance to see NASCAR’s Sprint Cup drivers race at Daytona this July 4th weekend. On tomorrow, investors get to see how well the company that operates the renowned Daytona track performed financially over the last quarter.

The Daytona track is owned by International Speedway Corp. (NASDAQ: ISCA). It reports its second quarter earnings for 2016 on Tuesday before the opening bell.

While investing in a race track may seem odd to some, track operators like International Speedway benefit from a wide array of revenue growth opportunities that contribute to their top and bottom lines. Furthermore, they pay dividends, which can be attractive in low yield environments like we are currently in.
 

 · What makes International Speedway attractive

 
Like all tracks, International Speedway’s tracks benefit from many revenue growth opportunities. Attendance at the NASCAR races may be the crown jewel, but the tracks’ revenues benefit from many other opportunities as well.

With a market cap of roughly $1.6 billion, International Speedway is the largest among its peers, which include Dover Motor Sports (NYSE: DVD) and Speedway Motorsports (NYSE: TRK). Their market caps are $79 million and $737 million, respectively.

Dover Motor Sports and Speedway Motorsports report Q2 2016 earnings by Aug. 1.
International Speedway boasts being the owner and operator of some of the most popular tracks in the NASCAR circuit, including the flagship Sprint Cup series. The tracks include Daytona International Speedway, Talladega Superspeedway, Darlington Raceway in South Carolina, and Watkins Glen International in New York. Also, it promotes more than 100 racing events a year.

Owning and operating these popular tracks contributes to International Speedway’s strong financials. For example, in addition to the revenue generated through admission sales, track owners and operators like International Speedway also derive revenue from hospitality rentals, souvenir and food concession services, royalties from trademark licensing, and sponsorship fees.

International Speedway also reaps the financial benefits of owning and operating 13 motorsports entertainment facilities, International Speedway also owns and operates Motor Racing Network, which it notes as being the nation’s largest independent sports radio network. It also owns Americrown Service Corporation, a subsidiary that provides catering services, and food and beverage concessions.
 

 · Financial performance

 
Analyst estimates show International Speedway’s reporting earnings per share of $.37 on $163 million of revenue for Q2 2016 on tomorrow. The reported EPS for the same quarter last year was $0.35.

The company has seen its revenues grow quarterly and annually over the last several years. Total revenues for Q1 2016 were roughly $143 million compared to revenues of about $137 million in Q1 2015.

Operating income was approximately $31 million during that period compared to approximately $22 million in Q1 2015.

During the first quarter of the year, International Speedway boosted its dividend. It pays $.41 a share, yielding 1.2%. For fiscal 2016, it plans to buy back $50 million of shares.

International Speedway is maintaining its market share. According to Capital Cube, the company’s revenue change during Q1 2016 is in line with the earnings reported for Q1 2015. Also, it is about average among its peer group.

The company’s earnings growth was influenced by year-on-year improvement in gross margins from 38.96% to 40.93% as well as better cost controls, notes Capital Cube. This resulted in an increase in its operating margins, which rose to just over 40% from 35% compared toQ1 2015 the same period last year. Gross margins increased to 39.59% from 36%.
 

 · Sponsorships

 
Crucial to the operators of these race tracks are their marketing partnerships, or event entitlement platforms. Examples include Coca Cola, which was the sponsor of the Daytona 400 over the weekend.

Race track operators tout these platforms as delivering solid returns on investments for the event partners by allowing them to extend their brands.

For fiscal 2016, International Speedway has agreements in place for approximately 92% of its gross marketing partnership revenue target, which is projected to increase approximately 11% compared to 2015.
 

 · Trickle down effects from NASCAR

 
After this 2016 season ends in December, Sprint will no longer be NASCAR’s flagship title sponsor. About eight to 10 companies are reportedly being considered. An announcement is expected in the fall.

For its secondary series, NASCAR signed on Comcast Xfinity to replace Nationwide. It signed a 10-year contract with the high-speed Internet provider in 2014.

According to Sports Business Journal, NASCAR is seeking a sponsor for its top-tier series for as much as $1 billion. That would cover 10 years, in which the sponsor would pay $45 million to $50 million annually in rights fees. That would be 33% more than the deal inked with Sprint (formerly Nationwide).
 

 · Elephant in the room

 
Trip Wheeler, president of Speedway Benefits, acknowledged the “elephant in the room” for NASCAR. He told Sports Business Journal that NASCAR needs to take a long-term view when weighing money versus what would be the right fit. He noted the conglomerate should worry more about getting ratings up and should even consider many of the changes it has made that has limited fan attendance growth.

This will indeed be key considering sponsorships have declined over the years. Not only has attendance at races been in decline, but so have television ratings as fans are tuning out. NASCAR has several initiatives under way to curb this trend, including those aimed at diversity to widen the fan base.

Companies are naturally unwilling to part with millions of dollars for sponsorships in the face of declining audiences.
 

 · Moving forward

 
As NASCAR works through these issues, tracks like International Speedway must be diligent in making sure there tracks remain profitable from other revenue sources.

I have little reason to think that the company’s momentum slowed over the last quarter. However, NASCAR’s attendance challenges are headwinds that cannot be ignored.


We all want to hear your opinion on the article above:
No Comments


This site has been fine-tuned by 14 WordPress Tweaks