Weekly Newsletter   Challenge account   Weekly Newsletter   


Posted by Martin August 18, 2018
No Comments


WEEKLY RESULTS, August 18, 2018


Last week was a good week. It was a bit choppy as Wall Street was worried abut Turkey, then wasn’t worried about Turkey, and on Wednesday it was worried about Turkey again.

No matter what, Turkey became just an excuse for a shake out to get rid of weak hands and move on without them. It is exactly what has happened next week.

 
Trading Results
 

The market created nice bottoming tail when everybody was panicking about Turkey. The very next day the candle got confirmation and we could load our accounts with new trades – and make money.

 
Trading Results
 

It is more apparent on the daily chart:

 
Trading Results
 

Choppy markets are great for income, they can make you nice cash. They are not as good for your net-liq (net liquidation value) of your account as zig-zags of volatility spiking or drying up within hours can impact the account. One day, our net-liq was at $95,000 and the very next day we dropped to $87,000 just to recover a bit by Friday.

Since we had the bottoming tail confirmed we may see more uptrend in the coming week and reach the January highs which are now a resistance. At the resistance we may see some downward push which will be good to enter more bullish trades.


Last week our screener provided a few stocks good to buy.

Here are the dividend growth stocks we purchased in August using 50% of our options trading proceeds:

 
Trading Results
(click to enlarge)


We all want to hear your opinion on the article above:
No Comments


Posted by Martin August 06, 2018
No Comments


Ignorance of media


It is truly stunning how ignorant people are when it comes to stock market and investing.

In many human activities and jobs people usually go and educate themselves before they participate in that activity. If one wants to become a dentist, he or she goes to school and spends 10 years educating herself. If another person wants to be a lawyer, it is the same, he goes to school and spends a lot of time in school before he becomes a lawyer. And same goes with a surgeon, and engineer, and even a machinist or operator in a factory.

But when it comes to investing you can be as dumb as a log and participate in the stock market, lose all your money, blame the government and other participants for it, and then publish your own opinions and present it as a fact.

Everybody is now worried that this market is over. That this market pushes itself to the end. This is what was published in media recently:

 
Media
 

All it takes is a perspective. In my previous post I said that all data point to a high probability of this market being at the beginning of something big. Of course, it may change any day and we need to watch this market on a day to day basis to see if anything is changing or not. As of today, we have no indication of the market changing but rather be at the beginning of a new strong rally from a recent breakout.

Here is a picture I posted in my previous post:

 
Weekly Results
 

Let’s zoom into the most recent period of time.

 
Recency bias
 

When people look back, 23 years into history, all they see is a market which failed them a lot in the past. They saw a new high and a large selloff, then recovery and selloff again, and again. No wonder that today, they say: “We have seen this before!”

And media are propagating this also as you could see above. Same young inexperienced people are now looking back 10 years behind and think that they know everything. Yet they are missing the big picture.

It is true, we have been in this before! But not in a way as others and media think.

We have seen this market rallying up, then consolidating the gains, rallying again, and so forth. When the markets broke from previous consolidations people too were scared and predicted the market to crash. All they remembered was a short term picture of long consolidations and when the market broke, they screamed: “We are doomed!”

But then, the markets made new highs and delivered new gains. and many doomsayers stayed aside because they didn’t believe what was developing in front of their eyes.

 
Recency bias
 

The gains listed in the chart above and time frame (18 years and 205% gains, and 17 years and 998% gains) do not include time and gains the market provided from the bottom of the consolidations. The last 10 years, from the last consolidation low is not included:

 
Recency bias
 

Of course there will be corrections and selloffs on the way up into the new highs but these will be just a great opportunity to buy stocks from weak hands. This is not a prediction of what is going to happen. But there is a high probability of this development in the markets in the next decade or more.

Recently, I purchased my brand new crystal ball to predict the market.

This is what has arrived:

 
Recency bias
 

With this crystal ball I will only be 50% correct in predicting the market! So be careful!


We all want to hear your opinion on the article above:
No Comments


Posted by Martin August 03, 2018
No Comments


July 2018 trading, investing, results


S&P 500  2,840.35 +13.13(+0.46%)  Dow 30  25,462.58 +136.42(+0.54%)  Nasdaq  7,812.01 +9.33(+0.12%)
 

May resultsJuly market was volatile and hectic to our trading and investing. Trump’s trade war, although archaic news, still rattle the markets and spook the investors. there is however no need to be spooked and be afraid of the market.

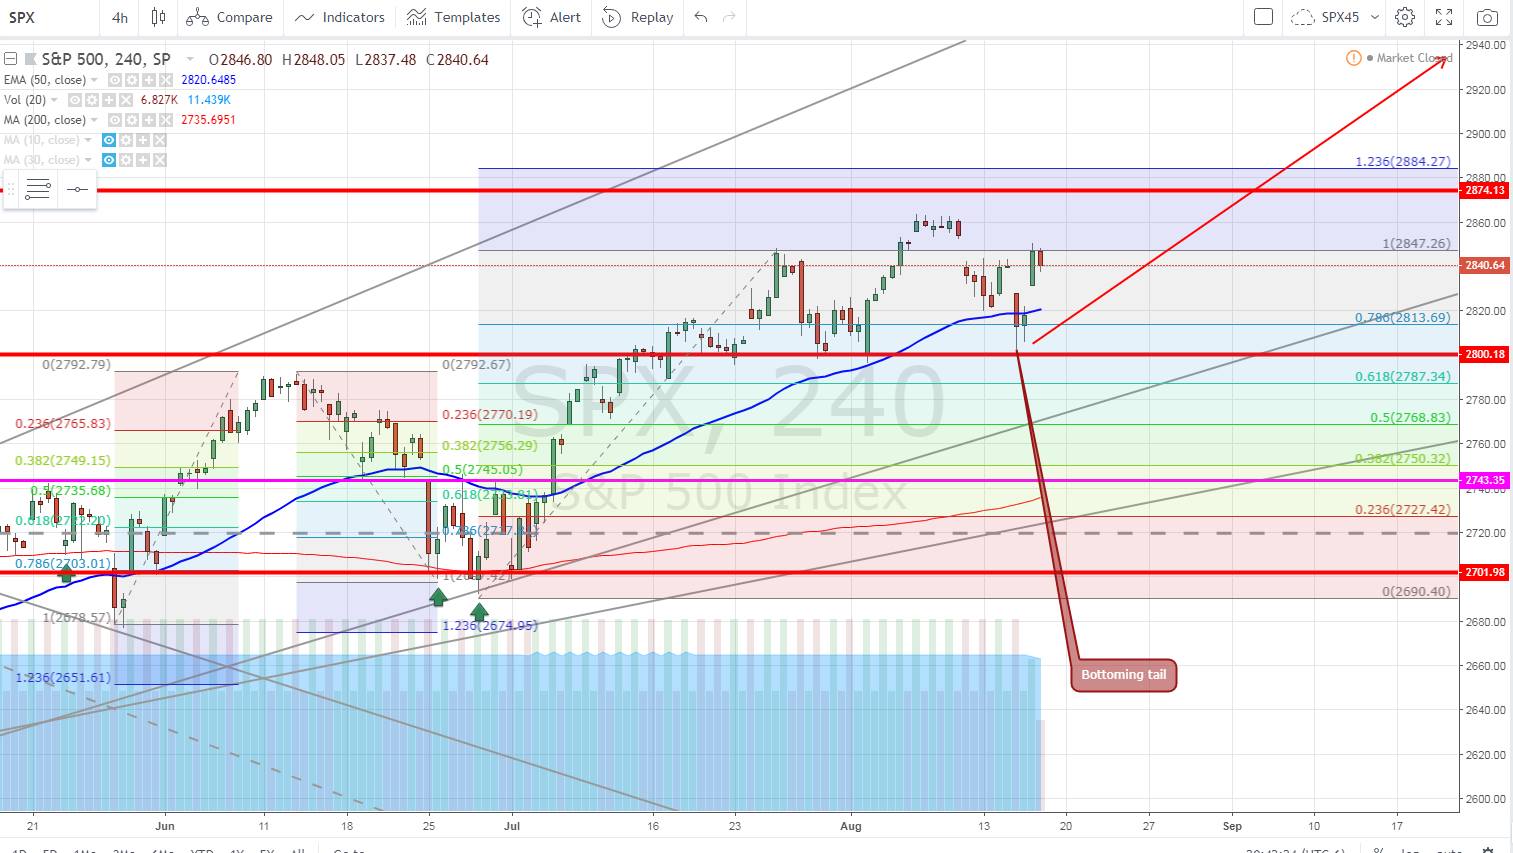
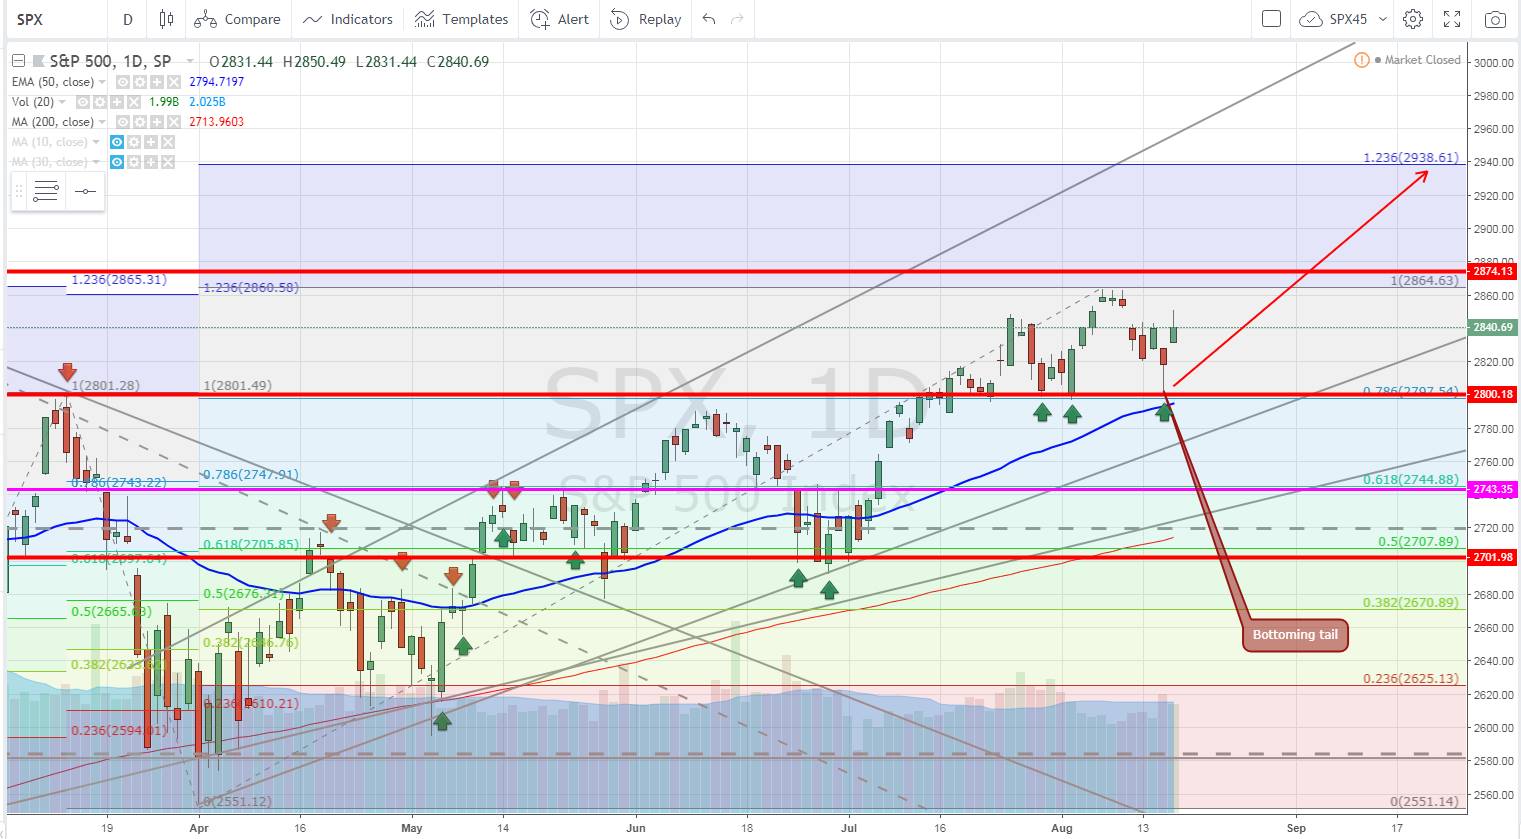
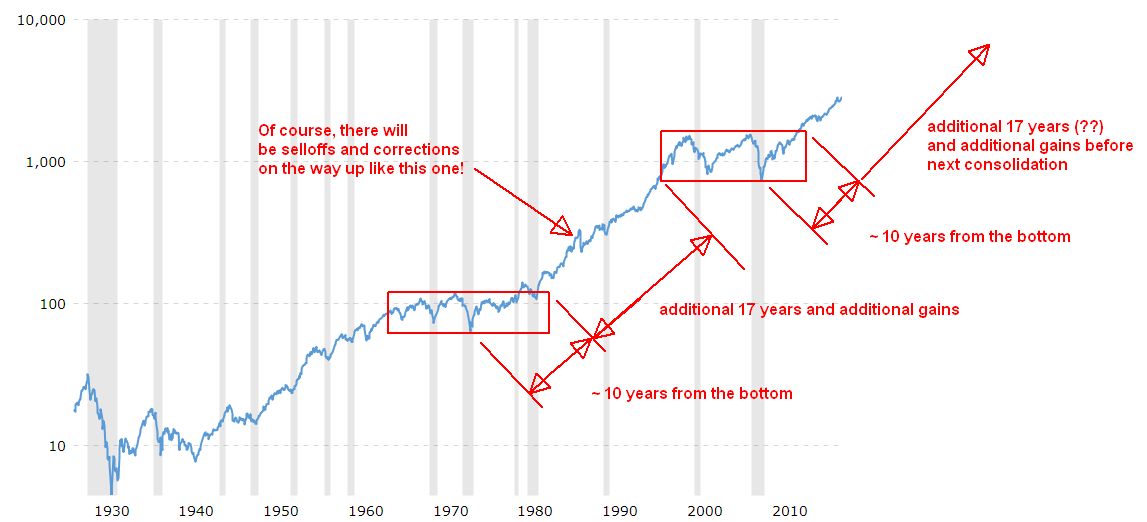
The price action of the current market points to a lot higher and better days to come. Although some time ago I was cautious and expecting this market to turn bearish at the end of 2018 or beginning of 2019 the recent charts proved me wrong. We may see pullbacks and corrections but overall we are heading higher. A lot more higher.

Of course, this is not a prediction but a probabilistic view and the market needs to be reviewed on a day to day basis to look for clues of change. We do not have any clues that this market is heading down.

July trading and investing was somewhat mixed and for most of the month our trading was slow with a lot of pullbacks. Our accounts made nice highs just to lose them the very next day.

The end of the month improved and it again became easy to trade.

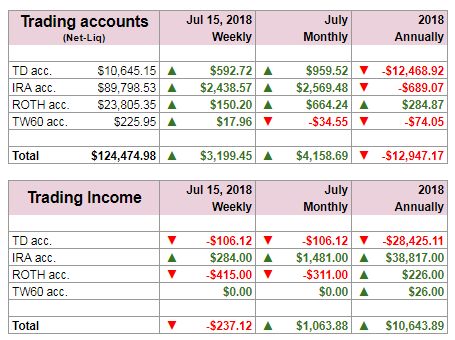
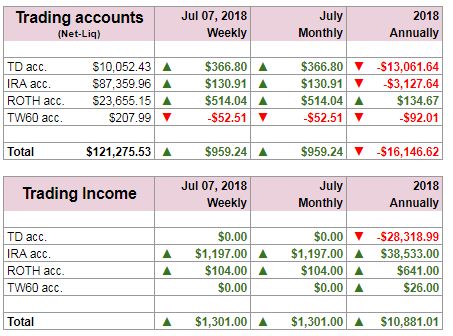
In July 2018 our combined accounts delivered nice $4,417.54 cash in premiums. Not the best month but acceptable. Our net-liq grew by $8,870.20 in July which is a good growth (given we had a lot of volatility).

 
Trading Results
 

July ended well yet we need to focus on our business account more and bring it back up to speed. This year we suffered large losses due to mistakes I made trading unsecured (naked) options against volatile non-dividend stocks such as LULU, X, WYNN, etc., and over-trading a relatively small account. I still have a few bad trades which I am thinking how to best manage them. They are now all secured and with plenty of time to adjust them when needed. So no rush.

I sinned the same in our ROTH IRA account over-trading it. Thus I am now trading that account less and mostly manage open trades only. Most of the growth in the ROTH is cause by dividend stocks. However, I plan on changing it as soon as possible by trading only small trades and depositing more money.


Here are the entire 2018 year trading results:

 
Trading Results


 · Dividend stock investing


Dividend investing is doing great on both accounts – ROTH and IRA. I keep using 50% of all options income and buy dividend stocks. IRA account keeps growing fast with new stocks being purchased every month. ROTH is more or less stagnant. We do not buy new shares as of now as I am focusing on increasing trading capital and then adopt the same strategy used in IRA.


Here is a review of our accounts stock holdings:

 
Traditional IRA
Trading Results
 

ROTH IRA
Trading Results
 

TD account
TBD
 

As of now, I do not track dividend stocks in TD account. We have a few positions in dividend stocks but our focus in this account would again bringing it up to speed, grow the capital and then adopt the same strategy as in IRA.
 

In July we purchased the following shares:

 
Dividend growth stocks
 

In one of the Facebook groups, where we post our trades and purchases, one member asked me why I only buy small amounts of shares, such as 4 shares of a stock, etc. His argument was that spending small amount would be offset significantly by brokerages fees.

Our reasoning is that we want to be buying only smaller amounts and rather more often to eventually dollar cost average the price. The table above indicates that we could purchase 7 shares of ABBV for $89.20 a share and when the stock dropped even lower, we could buy another 7 shares, this time for $86.90. If we have spent all our available money on the first purchase, we would not be able to buy more shares cheaper.

The next rule we have is to purchase shares for minimum $600 purchase or more, not less. With a $5 fee per trade, a 0.83% fee rate is acceptable. As you can see in the table above, this strategy helped us to buy shares of ABBV with over 4% dividend yield at that time and in 14 days we are already sitting on 11.08% capital gain for that particular purchase. If we spent all the money we would only see 8.22% gain.

As a dividend growth investor, capital gain is not important. It is a different mentality you need to adopt as a dividend investor. It is not a capital gain but stream of income what matter. However, even with that, our secondary goal besides the stream of income, is capital appreciation. And if there is a chance to grow the portfolio why not taking that option into account, right?


 · Dividend Income


ROTH IRA dividend income
Trading Results
 

IRA dividend income
Trading Results


We all want to hear your opinion on the article above:
No Comments


Posted by Martin July 30, 2018
No Comments


We are at the beginning of a prosperous stock market rally


People are worried about today’s market and they think we are heading towards a recession.

But their view is most likely obstructed by a short term bias and previous pain experience.

They remember 2003 crash, they may remember 2008 crash, only a few experienced 1980 – 2001 rally, or 1950 to 1960, and all only heard of 1930 crash. Those who remember 2008 crash tend to compare everything to what was happening during those days. They are comparing metrics of the market and economy of those days. But their view is obfuscated by a short term bias.

So let’s step out and let’s take a look at the markets from a bit farther distance.

That distance will help you see different patterns and different perspective.

We know that mostly the markets move up, then sideways and up again. The sideways moves called consolidations may take very long time. The last one, from 2001 took more than a decade before we finally broke up. That period was called a “lost decade” but recently we broke up from that pattern, re-tested it and turned up. We never returned back into the box.

Our previous rallies were in the range of 800% to 100% before the market entered a consolidation phase. Thus we may expect another period of 800% to 1000% growth over a period of several years (10 to 20 years +/-) before the market enters another consolidation phase.

Of course, there will be bumps on the road but it is very unlikely that we will see any major correction and crash in the next decade or two. Patterns repeat so we give 80% chance that this pattern will repeat again.

When evaluating the market and deciding to listen to all doom and gloom predictors it pays to step out and gain some distance to see the whole picture. Of course, we should review the long time frame as well as short term frames as we do not invest for the next 100 years but next 10 to 30 years only. But reviewing the entire pattern may help you in recognizing in which phase your life span will be in regards to the market and then select a proper investing strategy. If you lived and saved money during the “lost decade” owning 100% stocks could hurt you. If you are just starting, you will experience a golden age of investing in the next 10 to 20 years.

To identify a proper market phase from a bit bigger perspective, let’s see the chart below.

 
Weekly Results
 

Many people are scared of today’s market. Many predict it to crash again. They are trapped in a recency bias.

Here is a picture of one of the Facebook member who was saying “what if we see the following”:

 
recency bias
 

This is a perfect example of a recency bias.

Compare distances, compare averages back then and today. We are not in any slowdown nor reversal. We just broke from the pattern in 2015. If the previous runs were 20 years in average and consolidation phases about 20 years in average too, we may expect 20 years uptrend before the market goes to another consolidation. We are only 3 years out of the previous “difficult” market phase.

Also, people say that the last “bear market” was ten years ago in 2008 so it is time to crash again. The definition of a bear market is that it must go down by 20%. In 2012 the market went down by 19.98% and stayed there for six months. Was it a bear market? And why not? Because it missed the definition by 0.02%?

Of course there will be corrections and secondary bear markets (like the one in 2012) on the road but not a primary bear nor crash.

Our problem is that I would say all of us (with a very little exceptions) we are all bound in a short term bias when looking at the markets. Almost all of us have our charts set to what? YTD time frame? 9 months? 12 months? And how many look at the older data? 5 years? 10 years? And when we look at the older data, we still use our 12 month bias to evaluate the market and missing completely the entire big picture.

To evaluate whether the market is in a healthy state or sick state we really need to be able to step far far away and look at the market from 100 year bias. Then you will start seeing a completely different picture.

All data I could see myself so far point to a high probability that we are at the beginning of an expansion which may last up to 30 years.

Here is Ciovacco channel:


I strongly recommend you to watch this video if you suffer from recency bias and think this market is doomed to crash.

He does a good job to look at the market from a distance (as a long term investor) and provides in my opinion excellent ways to compare different market periods to determine whether we are repeating 2007/2008 pattern or not. I strongly recommend seeing it. His videos are not for every day investing or trading but establishing healthiness of the market and trend. Are we heading into a trouble or are we good? Are we in reversal or at the beginning of something bigger? Are we in a “difficult market” or “easy market”? This helps you to establish the bias and select a proper strategy – should you go bullish or be hedging, or bearish?


We all want to hear your opinion on the article above:
No Comments


Posted by Martin July 28, 2018
2 Comments


STOCK REVIEW (ABBV)


ABBV reported earnings and beat estimates, however, the sales of Humira disappointed, according to Wall Street.

It is not easy to satisfy Wall Street young analysts, many of them so young that they even haven’t experienced 2008 recession, some old that they see doom and gloom at every corner.

All they do is that they take old numbers from previous earnings and sales, extrapolate them into the future (meaning next quarter), and then are disappointed when the company miss their extrapolation or overly cheering when the company exceeds their extrapolation.

So Humira disappointed Wall Street extrapolations and the stock sold off 5% on Friday. Should we be worried?

The price action, it all started with Citron.

Weekly Results

I remember Citron shorting ABBV twice in the last ten years (they may have done that more but two noticeable shorts I still remember) the last one happened in 2015. It was a great opportunity. They tanked the stock from $70 down to $50. We went to $120 since then.

Even with Humira patent risks, the managers are not idiots and they hedge. ABBV was around for 150 years (as a part of ABT and spun off in 2013). So, if you think ABBV is at the end of their life, going bankrupt, then sell, run, scream, and go hiding. I am buying.

A quick note, people had similar talks about JNJ a few years ago when JNJ had a massive recall of one of their product. People predicted end of JNJ, spinoffs, and bankruptcy. The stock tanked from 80’s to 40’s… I still hold shares I purchased back then.

ABBV kept sliding down on Citron short call and all sorts of Humira patent news. History repeats itself. We witnessed this behavior twice in the past.

Small investors are in panic mode and selling while I bet Citron is buying.

I see this selling as a good buy opportunity. We added a few more shares of ABBV to our portfolio.

ABBV is a wild ride so ignore all noise and follow the company’s fundamentals rather than news. At this level, the stock pays over 4% dividend.

 
BTO 7 ABBV @ 86.90
 

Later during the week the stock dropped below $90 a share sharply.

This posed another great buy opportunity. We bought a few shares adding to our existing position:

 
BTO 7 ABBV @ 89.20
 

As soon as we purchased more shares at $89.20 the stock briefly dropped to $87.76 but then recovered back above $90 a share.

The $90 a share is a strong support level and it needs to hold for the stock not to fall further. It seems the level is holding as of now.

After earnings 5% drop the stock recovered some losses and we expect more recovery to come next week


We all want to hear your opinion on the article above:
2 Comments


Posted by Martin July 28, 2018
No Comments


WEEKLY RESULTS July 28, 2018


Weekly Results

You can also follow our Facebook page where we post our trades and results.


We all want to hear your opinion on the article above:
No Comments


Posted by Martin July 15, 2018
No Comments


WEEKLY RESULTS July 15, 2018


Weekly Results

You can also follow our Facebook page where we post our trades and results.


We all want to hear your opinion on the article above:
No Comments


Posted by Martin July 07, 2018
No Comments


WEEKLY RESULTS July 07, 2018


Weekly Results

You can also follow our Facebook page where we post our trades and results.


We all want to hear your opinion on the article above:
No Comments


Posted by Martin July 03, 2018
4 Comments


June 2018 trading, investing, results


S&P 500  2,713.22 -13.49 (-0.49%)  Dow 30  24,174.82 -132.36 (-0.54%)  Nasdaq  7,502.67 -65.01 (-0.86%)
 

May resultsJune is over and I battle with myself to keep up posting my trades and results. It is hard to do so. I work full time and manage a few accounts at the same time. I trade many trades and it is difficult to post them all.

Just in June itself, I made 666 trades in one account – the IRA account alone. Overall, I made 2593 trades.

 
Trading Results
 

With so much trading, it became more and more difficult for me to keep up posting all my trades and their adjustments. I wish I could post more to be able to help others to learn trading but as of now I do not know how to do that without being consumed by it.

I do download my csv file from my brokerage account which I upload to the spreadsheet which then calculates everything else for me, such as premium income, number of trades, net liquidation value, and other portfolio metrics but I still couldn’t figure out how to record my individual trades so you can benefit from it. As of now, I am not able to do it and must stop doing it as it is very time consuming.

I still will be posting some of the trades on our Facebook Page where you can follow those trades.


I trade options to create income. Income, I can use to invest into dividend growth stocks and to pay for the bills and other expenses.

As of today, I manage three accounts:

1) A business account
2) An IRA account
3) A ROTH IRA account
4) A personal margin account

Over time, I finally came to realization that a trading capital is important. I am under-capitalized in my business account. And I struggle in that account very much. I get beaten hard and losing money no matter how much I try not to.

Same thing is happening with my ROTH account. Not enough capital. Troubles to trade. And… losing.

But the IRA account has enough capital and trading it is easy and not stressful. When a trade goes against me I feel no fear as I have enough capital to adjust the trade and move on. I don’t have such comfort in the business account and in the ROTH account. Unfortunately.

Thus, I decided to adjust my strategy. I will mute trading in the business and ROTH accounts and will start saving money. I will take only small trades, small enough to take stock assignment should it happen or have enough capital to adjust a trade. This means no trading in those two accounts and be saving only to raise enough capital.

 
Here is the June 2018 trading and dividend investing results. The results are mixed. Mixed with great income in IRA account but terrible losses in the business account.

 
Trading Results
 

As you can see above, the IRA account performed great while other accounts suffered losses. For example, I got assigned to JNJ stock but I didn’t have enough capital to take the assignment. So I had to liquidate the position at a loss. Or another position – STX going against me (volatility raising) and the account couldn’t bear it, so I had to close at a loss. Over-trading and little capital is a killer.

There fore, I need to adjust and start saving.


Here is the entire year results so far:

 
Trading Results


 · Dividend stock investing


Dividend investing is doing great. I keep using 50% of all options income and buy dividend stocks.

Since the death of David Fish, who maintained the great dividend champions list I had to create my own list to keep the selection of stocks running as no one seems to be updating the David Fish’s list anymore.

As of now, my list is semi automated so I do not have to do all updates manually myself but it doesn’t include all stocks, only those I invest in. And I keep buying.


Here is a review of our accounts stock holdings:

 
Traditional IRA
Trading Results
 

ROTH IRA
Trading Results
 

TD account
TBD
 

In June we purchased the following shares:

 
Dividend growth stocks


 · Dividend Income


ROTH IRA dividend income
Trading Results
 

IRA dividend income
Trading Results


We all want to hear your opinion on the article above:
4 Comments


Posted by Martin June 21, 2018
No Comments


We all want to hear your opinion on the article above:
No Comments


This site has been fine-tuned by 14 WordPress Tweaks