
If you watch markets regularly you may feel its pulse time to time and feel whether it has steam to push prices higher or whether it is weak and prone to further selling.
We have seen nice recovery recently from 2000 support back up to 2040 level. But if you look under the hood, the recovery isn’t that impressive. The whole day looked like lazy day and volume was slightly drying up hour after hour.
Only the end of the day saw some activity and we dropped hard and recovered it sharply almost at the same time.
Will this be enough? are we seeing Santa finally coming? Or was that it? As holidays are coming my guts are telling me that we are about to stall and we will not see much this week. We only have one and a half day left to the end of trading this week and the market may not move anywhere. Everybody will be gone for Christmas.
However, this low volume/activity environment can actually be violent both sides and we may see sharp moves tomorrow or on Thursday. And the moves can go both ways. Yet I am bearish.
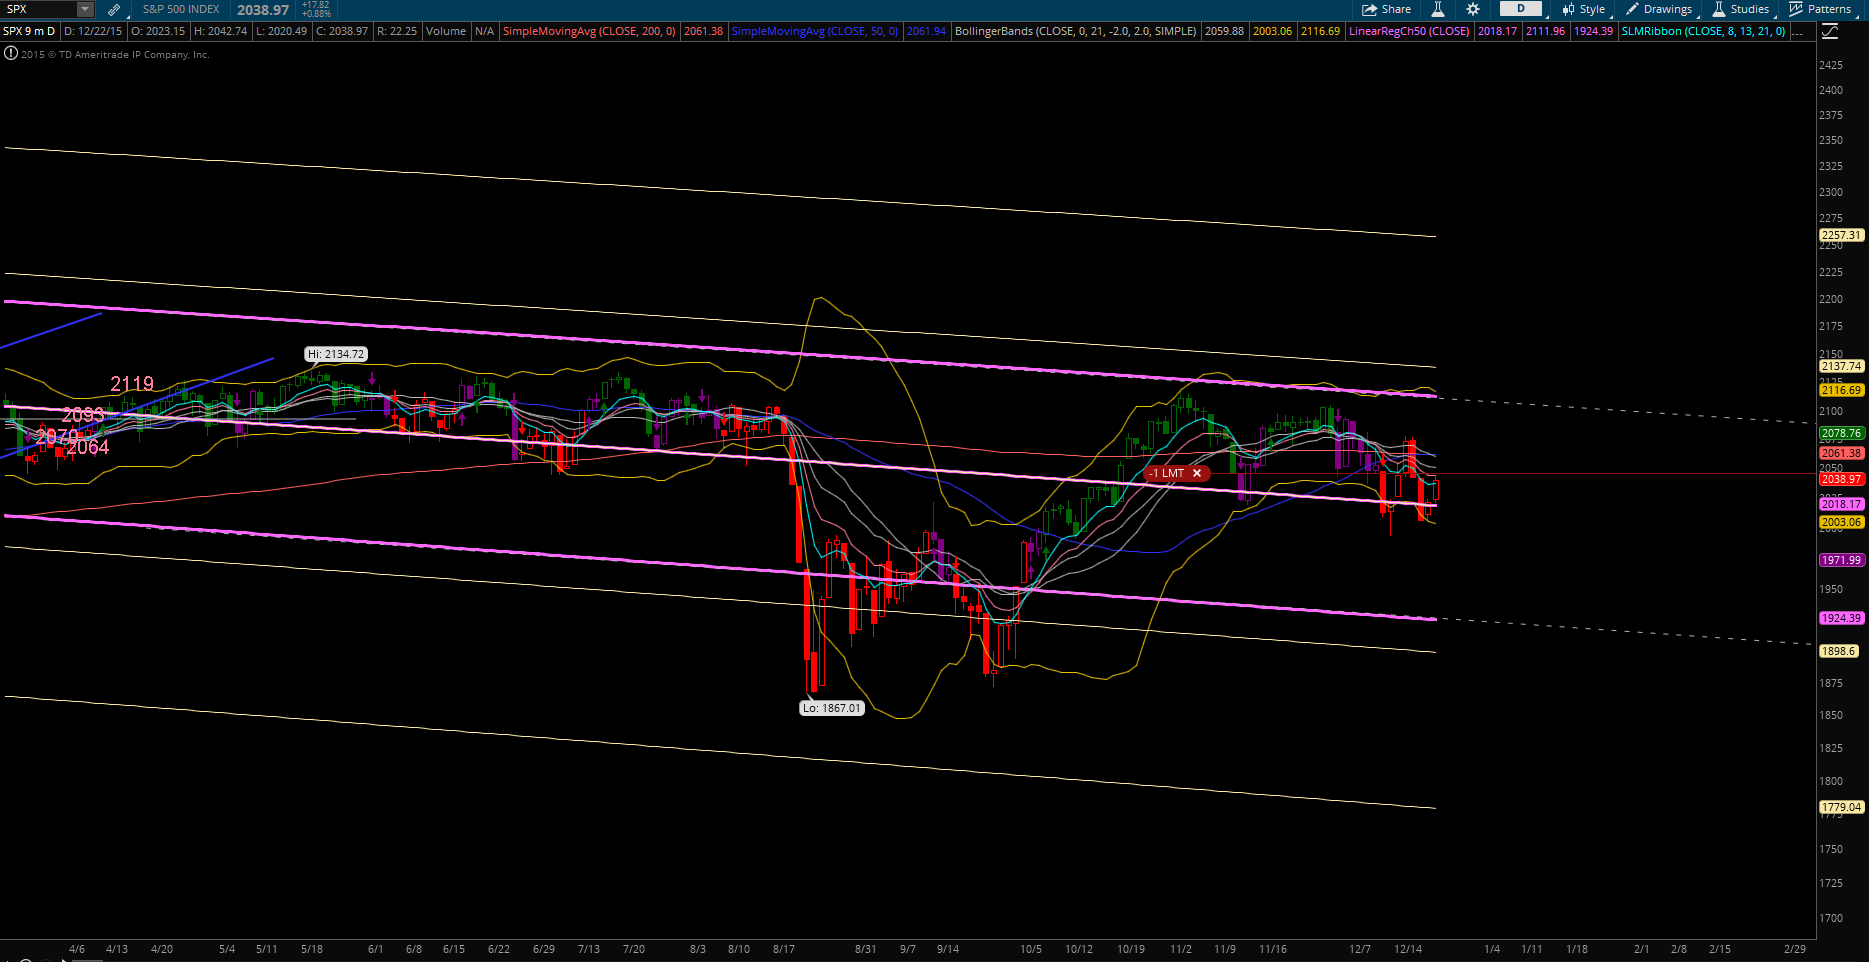
Below is a chart indicating why. I am bearish both time frames – long and short time. The market is below 21 day MA, 50 day MA and 200 day MA which is bearish and also a strong resistance. Will the market have enough strength to overcome that resistance? We will see tomorrow or on Thursday if so. As of now, I do not think the market will have that strength.
What worries me more however is the entire market direction. I use linear regression channel for the overall market trend (magenta lines in the chart below). In August 2015 when we saw the dramatic decline in prices the damage has been done to the trend and since then we are sloping down. What’s even worse is the dashed white projection lines. I draw them manually above the entire channel and extend them further to the right. On the chart, they are on top of the magenta lines although it may not be visible at the first glance. These lines help me to see how is the market changing. Is the channel sloping down more or slowly turning back up? The dashed projection lines help me to see the change.
And that’s the issue. As you can see, there is no change! The dashed lines are still on top of the magenta lines and every day the new portions of the channel are added and they follow exactly those dashed lines! What does that mean? That we are heading down and there is no indication of changing this trend.
That’s why I am bearish overall and unless anything happens, this bull market is over for now. It may change, and I will notice that change when the magenta lines start rising off of the dashed lines.
But now? Now we are heading down.


Leave a Reply