Weekly Newsletter   Challenge account   Weekly Newsletter   


Posted by Martin March 29, 2023
No Comments


Technical view: Amazon (AMZN)


Technical view
 

AMZN is in stage #1. There is still a buy signal for this stock, but the trend stalled. At least we are not going down anymore, again, at least not now. But the weekly chart just flashed a strong buy signal. Let’s see if it holds. The trend may soon morph into stage #2.

 
Technical view weekly
 

AMZN’s revenue growth is impressive, and it is growing at an 8.58% annual growth rate. Its 10-year growth is 21.51%:

 
Technical view weekly
 

Amazon’s cash flow was a bit wacky and in 2021 it was even negative. But the reason for it was that the company was heavily investing in its infrastructure – building new distribution centers, new delivery ways, etc. These heavy investments in transportation and distribution centers will pay off in the future.

 
Technical view weekly
 

These expenditures had an impact on the company’s EPS which was negative last few quarters. But again, I think this is a temporary setback caused by investments.

 
Technical view weekly
 

Shares outstanding are quite high indicating dilution to shareholders. The company has been diluting constantly since 1999 but the rate of increase is fairly small. The 10-years dilution ratio is 1.16% only.

 
Technical view weekly
 

The company has enough cash on hand to eliminate all its debt:

 
Technical view weekly
 

The company is still overvalued in the short term, but it is trading below its 2025 fair value. Unless it changes, it is trading at a level where it is worth buying.

 
Technical view weekly
 

Technical view weekly
 

The stock is now AGGRESSIVE BUY
 

This post was published in our newsletter to our subscribers on Saturday, March 25th, 2023. If you want to learn more about our stock technical analysis subscribe to our weekly newsletter.


We all want to hear your opinion on the article above:
No Comments


Posted by Martin March 23, 2023
No Comments


03.22.2023 – WEDNESDAY MARKET OUTLOOK


Market Outlook
 

So the FED did exactly what everyone expected, yet the market sold off hard (over 1.5%) at the end of the session. The whole day was flat until Powell spoke and revealed to be less hawkish. But then he mentioned that the fight to mute inflation is not over (wishful thinking as banks will force him to abandon this reckless policy) and the market sold off. In my opinion, it was just an overreaction to something everyone knew anyway and in that case, this may be just a dip that may recover tomorrow. But we need to wait and see whether this bearishness is going to continue or not.

 
Market Outlook
 

Despite the selloff, the market is still upward-sloping and all we did was just erasing yesterday’s gains. Normally, with only a 0.25% rate hike the markets would rally to the moon, so there is something fishy here.
Daily Ichimoku charts starting to improve and the price got above the red line yesterday, but today’s sell-off returned the chart back to a full-blown bearish look:

 
Market Outlook
 

However, the weekly chart improved a nod. We now have the green line above the price so the chart continues improving but given that it is actually moving sideways, I do not expect much. We are range bound and it seems it will stay like that for some time.

 
Market Outlook
 

The forecast for tomorrow is to recover today’s losses, but if the bearishness continues expect more selling to come. Let’s see if this plays out.

 
Market Outlook
 

This is a delayed outlook. If you want to learn more about our SPX weekly analysis, subscribe to our weekly newsletter.


We all want to hear your opinion on the article above:
No Comments


Posted by Martin March 22, 2023
No Comments


Technical view: Ares Capital Corporation (ARCC)


Technical view
 

ARCC is in stage #4. The stock appears to be consolidating and it could eventually bounce but the trend is weak, and we still have a strong sell signal. The weekly chart is trendless with no signal, but it indicates that there may be no more selling, at least for now.

 
Technical view weekly
 

The company recently saw a significant reduction in revenue, so the price decline may have been justified. However, in the Q4 of 2022 revenue started to increase again:

 
Technical view weekly
 

Free cash flow is a bit erratic and not the way I would like to see:

 
Technical view weekly
 

Another significant concern is rising debt and not enough cash on hand to pay it off. This can eventually backfire and the company will have to address it in some way:

 
Technical view weekly
 

The dividend growth is also irregular but growing. If this metric worsen, I may take this position off of my portfolio:

 
Technical view weekly
 

It is typical for a REIT to issue new shares to provide financing to obtain new properties, but here we see rising shares outstanding and the debt hand in hand. Honestly, I do not like it.

 
Technical view weekly
 

Fundamentally, the stock is undervalued and trading way below its fair value and normal P/E, providing a margin of safety making this investment relatively safe. However, in the next 2 years, Wall Street expects revenue declining by 5% in 2024 and 14% in 2025. This may impact the stock price. It may be moving sideways or keep declining.

 
Technical view weekly
 

The AFFO data are scarce for this company but it appears that it has enough cash flow to make the stock price undervalued.

 
Technical view weekly
 

The stock is not a grower so do not expect capital appreciation, rather this stock should be bought for dividend income only. Thus, the strategy should be set to buy when the stock is selling low and hold during high prices. Currently, any price below $17.50 can be considered a good entry price.

 
Technical view weekly
 

The stock is now MODERATE BUY
 

This post was published in our newsletter to our subscribers on Saturday, March 19th, 2023. If you want to learn more about our stock technical analysis subscribe to our weekly newsletter.


We all want to hear your opinion on the article above:
No Comments


Posted by Martin March 21, 2023
No Comments


03.20.2023 – MONDAY MARKET OUTLOOK


Market Outlook
 

The banking crisis seems to be calming down. FED may potentially pause the interest hikes so as not to cause further damage because for years the FED was telling everybody that the interest rates will stay low for a long time… so buying long-term Treasuries didn’t look like a risky idea. Everybody did it, not just banks. Imagine pension funds, they may be next. And then after 10 years of ultra-low to negative interest yields the FED rockets the rate to 5% within a few months. Of course, no one can sustain such a rapid hike if you suddenly need cash and the 10-year Treasuries which looked like a safe haven are suddenly worthless!
And the market may be now looking forward to some stability. After some bearish start, the index finished green.

 
Market Outlook
 

Daily Ichimoku charts starting to improve and show some recovery. But still, long time to go to fully recover from the damage. And if the FED screws it up again tomorrow, we may not recover at all and instead head lower.

 
Market Outlook
 

The weekly Ichimoku chart holds well so far and it is even attempting to break into the cloud. The cloud is strong resistance and we still may bounce down from it. It would be a good signal for the markets if we break into it and above.

 
Market Outlook
 

The forecasting chart shows a potential down day tomorrow and if the FED doesn’t cooperate it may very well happen. If however, the FED shows a bit dovish stance, the market may continue higher. Note that forecasting is a purely mathematical model based on past data. It may capture the momentum of the trend but may not work well if influenced by sudden news or black swans that disrupt it. There fore the chart below needs to be confirmed. Unfortunately, we do not have that confirmation on any other chart, though there is an improvement that may help push the markets up and invalidate the recent forecasting series.

 
Market Outlook
 

This is a delayed outlook. If you want to learn more about our SPX weekly analysis, subscribe to our weekly newsletter.


We all want to hear your opinion on the article above:
No Comments


Posted by Martin March 18, 2023
No Comments


Technical view: Trinity Capital Inc. (TRIN)


Technical view
 

TRIN is in stage #2, but the recent SVB trouble may be spilling into this stock as well. That may send this stock into a further downward spiral and change the stage back to #4. TRIN invests in startups too and may be in financial stress the same way as SVB is. If the issue stays contained to SVB only, this will be a great blip (dip) to buy. As of now, it is more of a “wait and see” status.

 
Technical view weekly
 

The company is relatively new so there is not much data available, so when investing in his company, caution is needed. The company’s revenue was growing in the 3rd and 4th quarters last year after a sharp decline at the beginning of 2022. If the trend continues, it will help the stock to move higher. This can also be behind the recent rally:

 
Technical view weekly
 

Trinity’s free cash flow data indicate that the company is burning cash. Not good:

 
Technical view weekly
 

What can be seen positively however is that the company eliminated its recent debt and has cash in hand to sustain operations and dividends:

 
Technical view weekly
 

The company is also reducing shares outstanding which economically illiterate politicians see as a bad thing which in fact is a good thing:

 
Technical view weekly
 

The stock is fundamentally undervalued, and it offers a nice cushion of safety right now (unless something changes). There is a risk when investing in this type of company but as we see new “risk on” from the investors pouring money into startups again, TRIN will benefit from it. The company recently originated over $239 million in new loans. This indicates that the management is confident that the economy will continue growing. Of course, they may be wrong.

 
Technical view weekly
 

Technical view weekly
 

The stock is now MODERATE BUY
 

This post was published in our newsletter to our subscribers on Saturday, March 11th, 2023. If you want to learn more about our stock technical analysis subscribe to our weekly newsletter.


We all want to hear your opinion on the article above:
No Comments


Posted by Martin March 16, 2023
No Comments


03.15.2023 – WEDNESDAY MARKET OUTLOOK


Market Outlook
 

What was good yesterday turned sour today. The browny (shit) show continues. This time send your thanks to Credit Suisse… The VIX futures term is turning negative, which means more and more investors are hedging for more selloffs.
The markets sold off hard today. It was down over 1.5% the entire day, and it erased some of the losses by the end of the day but still finished down by 0.70%. Overreaction? Most likely, but that is what we have to endure until spooked investors calm down and start using their brains again.

 
Market Outlook
 

Daily Ichimoku is still bearish, and there is no sign of any changes coming, so based on the chart below, I expect more volatility and downward pressure.

 
Market Outlook
 

The daily Ichimoku chart is helplessly bearish with no hope on the horizon. The proverbial light at the end of the tunnel is just another freight train speeding toward us. It is time to become defensive. The weekly chart doesn’t offer much hope, either. It is still bearish, and the market has a hard time breaching the cloud.

 
Market Outlook
 

The weekly chart started improving at the beginning of the year, but that is gone too. The price is attacking the red-line support. If it breaks, the chart will be more bearish.

For tomorrow, expect more selling and a bearish trend with choppiness.

 
Market Outlook
 

This is a delayed outlook. If you want to learn more about our SPX weekly analysis, subscribe to our weekly newsletter.


We all want to hear your opinion on the article above:
No Comments


Posted by Martin March 15, 2023
No Comments


03.14.2023 – TUESDAY MARKET OUTLOOK


Market Outlook
 

All is good…
Inflation went down well, sort of. It went up but at the slowest pace since January 2021…
The government bailed out the crumbling banks…
People got pissed off that the irresponsible managers got away with it again…
The FED may actually start cutting the rates now…
And the pastures are green again…
Until the recession hits us at full speed and strength. Why would it hit us? Because in all cases in the entire 100-year history of the stock market, when the FED starts cutting rates, inflation comes in the next 6 to 18 months… Unless “this time is different.” Which it usually is not.

 
Market Outlook
 

After some volatility, the markets finished up by a significant number erasing Friday’s losses. But overall, we still have a lot of work to repair the damage the crumbling banking did to the market. There is no sign of change from bearish to bullish in the Ichimoku chart as of yet.

 
Market Outlook
 

The daily Ichimoku chart is helplessly bearish with no hope on the horizon. The proverbial light at the end of the tunnel is just another freight train speeding toward us. It is time to become defensive. The weekly chart doesn’t offer much hope, either. It is still bearish, and the market has a hard time breaching the cloud.

 
Market Outlook
 

And the same can be said about the weekly Ichimoku chart – no improvement.

Tomorrow’s prediction is a choppy market, but since the FED appears to be done with hiking the rates, at least for now, and the inflation is down, the market may gain more momentum and recover the losses from last week. Today, the prediction was false, and I have reasons to think that tomorrow’s prediction will be wrong too, and we will see another strong up day.

 
Market Outlook
 

This is a delayed outlook. If you want to learn more about our SPX weekly analysis, subscribe to our weekly newsletter.


We all want to hear your opinion on the article above:
No Comments


Posted by Martin March 14, 2023
No Comments


03.13.2023 – MONDAY MARKET OUTLOOK


Market Outlook
 

Wow, what a week. The FED was playing with fire and broke the toy. Something economists like Warton professor Jeremy Siegel have been warning about since half of 2022, saying that the FED is wrong and tightening too much looking at the wrong data, which will backfire. Fast forward, and the banking system, the very backbone of the US economy, is crumbling. And now, the same morons who recklessly destroyed it are scrambling to fix it. When I was a child, I remember my parents went shopping and asked me if I wanted to go with them. I said no. And when they left, I was crying because they left me at home alone. The FED is like that child I once was.

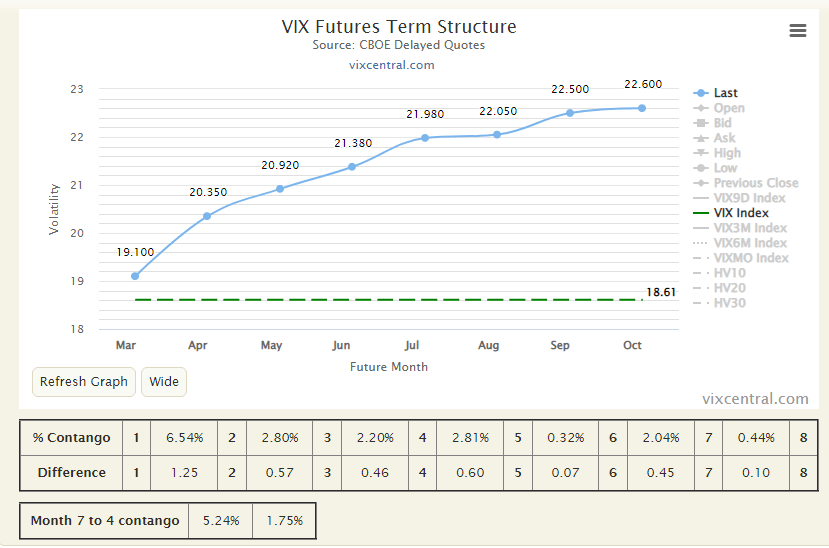
The VIX structure above is interesting. I have not yet seen a pattern like this. I would interpret it as indecisiveness, confusion, and calm before the storm.

 
Market Outlook
 

The markets literally crashed. It went from bullish to extremely bearish within two days. The bull trend narrative evaporated. And today was a scrambling day. Volatility went through the roof, and the market was going from bullish to bearish as the news about more banks failing and the government bailing them out hit the markets. Now the FED has what they wished for, except I don’t think they wished exactly for this. Everyone thinks the FED will cut the rates in their next FOMC meeting. And they really may do because despite them telling us that these banks were not significant and it is not a big deal, it can become a big deal very quickly. The companies that had money in these banks may fail to pay salaries to their employees, and they, in turn, may fail to pay their rent and lose their jobs. It can quickly become a domino, precisely like in 2008.

Tomorrow we will receive a CPI report. If the report comes in bad, the FED will be in a precarious position. They will need to raise the rates more, but they can’t unless they want to continue their unscrupulous devastation of the US and world economy.

Nevertheless, the market stopped at its support today after very volatile trading. But in light of the recent problems, it means nothing. We may easily slice below it and create new lows. If CPI comes in bad tomorrow, the market may fall further.

 
Market Outlook
 

The daily Ichimoku chart is helplessly bearish with no hope on the horizon. The proverbial light at the end of the tunnel is just another freight train speeding toward us. It is time to become defensive. The weekly chart doesn’t offer much hope, either. It is still bearish and the market has a hard time breaching the cloud.

 
Market Outlook
 

Powell is simply clueless, and he just does what he thinks may be needed at a particular moment in time without knowing what the consequences may be. He is like a doctor who has no clue about his patient’s illness and the potential medicine he may need, so he is just throwing drugs at him and observing which drug may be effective. But in the meantime, the patient dies. This illustrates it perfectly:
 
Jerome Powell testified in front of the banking committee last week.
 
COMMITTEE: “Do you see any systemic risk in the banking system because of the rapid rise of interest rates?”
 
POWELL: “No”
 
SIVB: “Hold my beer.”

 
Market Outlook
 

Market expectation for tomorrow is negative. But it may not happen. If the CPI indicates easing inflation, the market will rally as it may perceive that the FED can stop the tightening. If it comes in bad, who knows what happens? Expect extreme volatility and stay on the sidelines.
 

This is a delayed outlook. If you want to learn more about our SPX weekly analysis, subscribe to our weekly newsletter.


We all want to hear your opinion on the article above:
No Comments


Posted by Martin March 11, 2023
No Comments


The FED may have a problem… and all of us too


Last week we saw the first cracks in the economy. Two US banks are in trouble. Silvergate and Silicon Valley Banks experienced a bank run. Silver Gate may shut down completely, and SVB is not yet determined. We had a bunch of “experts” coming out telling us what happened. Many are in a panic mode and reporting in a catastrophe tone about the “mini Lehman financial crisis”. And the FED may have a problem.
 

I am not sure what happened with Silvergate bank besides that it was involved in crypto and couldn’t survive the recent crypto meltdown. But the SVB issue is more related to the FED and its aggressive interest hikes. And here we see some potential trouble the FED may be facing soon. They wanted to break something to bring inflation down. And it starts to seem that they broke the financial sector. Exactly the sector they didn’t want to break.
 

Wednesday’s selloff was induced by Powell’s “higher and longer” remarks. Thursday’s selloff was triggered by fears that SVB may start the financial crisis that would lead to the economy-wide credit crunch and recession as we saw many times in the past. The 2008 recession was the exact same problem. The inverted yield curve was signaling since last summer that something could break in the financial system if the FED continues to tighten the monetary policy.
 

The SVB trouble could be the start of the credit crunch and subsequent problems. It may spill into other sectors very quickly, mainly because of the fear of other people and other investors in the market. The FED may choose to ignore it because the SVB bank is too small to bother but the fear of other people is not. And their behavior may spark problems elsewhere. And now the FED may have the crack they wished for. Unfortunately, that is not a crack that would help with inflation. Now, they have to choose between high inflation or a crash in the economy.
 

Continue reading.


We all want to hear your opinion on the article above:
No Comments


Posted by Martin March 07, 2023
No Comments


03.06.2023 – MONDAY MARKET OUTLOOK


Market Outlook
 

The market started Monday’s session in a strong mode and rallied. Unfortunately, before the end of the day, it lost all gains and finished flat.

 
Market Outlook
 

The entire three-day rally was not sparked by any news or any changes to underlying fundamentals. If the underlying fundamentals were bad as bears are telling us, they are still bad. If they are good as the bulls hope, they are still good. This trading is purely sentimental driven by emotions and irrational fear. And the wave of bearishness made this bounce inevitable.

 
Market Outlook
 

As we can see on the daily Ichimoku chart, the price action improved significantly and the price of the index follows the cloud. That is good. It is also going to recapture the red line. If this continues, the case for the bull market will continue with it. This is also improving the weekly chart. We are once again attacking the cloud and soon, we will enter inside. It makes no significance until the market closes above it.

 
Market Outlook
 

The market traded as expected, except for the closing price action. That sucked. Tomorrow, as we await Powell’s testimony, the market is poised for an uptrend, but it will be a very choppy move. Unless Powell says something unexpected or something the markets will not like, we should go up.

 
Market Outlook
 

This is a delayed outlook. If you want to learn more about our SPX weekly analysis, subscribe to our weekly newsletter.


We all want to hear your opinion on the article above:
No Comments


This site has been fine-tuned by 14 WordPress Tweaks