Our first week in June 2021 started slowly as we generated $389.00 options income and $59.67 dividend income only. But this week was short and the market sassy, so we waited for it to calm down and show us what it wanted to do. We are again providing you with our investing and trading report so you can see how we are doing investing in stocks and trading options around our positions. We want to be transparent with our trades so you can decide to join our $100 account challenge program.
Our $100 account challenge
We started our $100 account challenge last week. We opened a new account with our broker, deposited the initial $100 cash and June $100 additional cash. We are now ready to start building our first position and grow this account from $100 to $75,000 in ten years or sooner. You can join this program and grow your account with us mirroring the trades, ask questions, and hopefully learn and develop enthusiasm investing in the stock market. We will be investors in the first place, buying dividend growth stocks and monetizing these positions selling options, and grow a small account.
Join us on this journey by subscribing to our program and follow us and see how I did it when I decided to grow a small account to a large one so later you can start trading naked strangles against stocks like AAPL, BABA, ABBV, or BA and have enough capital to do so. We started with a $100.00 initial deposit and we will be depositing $100 every month from now on and grow this account. And we are starting next week!
The subscription will cost $15.00 a month. After the initial $15.00 you will get one month free. I can assure you that after a certain time of investing and trading with us, you will be generating income larger than the cost of this program.
Let’s go and review this week’s investing and trading.
Here is our investing and trading report:
| Account Value: | $70,502.17 | +$1,660.31 | +2.41% |
| Options trading results | |||
| Options Premiums Received: | $389.00 | ||
| 01 January 2021 Options: | $4,209.00 | +16.65% | |
| 02 February 2021 Options: | $4,884.00 | +15.41% | |
| 03 March 2021 Options: | $5,258.00 | +12.79% | |
| 04 April 2021 Options: | $2,336.00 | +4.30% | |
| 05 May 2021 Options: | $6,346.00 | +9.22% | |
| 05 June 2021 Options: | $389.00 | +0.55% | |
| Options Premiums YTD: | $23,422.00 | +33.22% | |
| Dividend income results | |||
| Dividends Received: | $59.67 | ||
| 01 January 2021 Dividends: | $53.04 | ||
| 02 February 2021 Dividends: | $63.00 | ||
| 03 March 2021 Dividends: | $30.31 | ||
| 04 April 2021 Dividends: | $139.70 | ||
| 05 May 2021 Dividends: | $167.45 | ||
| 06 June 2021 Dividends: | $139.70 | ||
| Dividends YTD: | $554.65 | ||
| Portfolio metrics | |||
| Portfolio Yield: | 4.68% | ||
| Portfolio Dividend Growth: | 8.47% | ||
| Ann. Div Income & YOC in 10 yrs: | $13,789.13 | 19.62% | |
| Ann. Div Income & YOC in 20 yrs: | $132,158.60 | 188.03% | |
| Ann. Div Income & YOC in 25 yrs: | $685,168.47 | 974.84% | |
| Ann. Div Income & YOC in 30 yrs: | $5,982,376.69 | 8,630.85% | |
| Portfolio Alpha: | 24.59% | ||
| Portfolio Weighted Beta: | 0.85 | ||
| CAGR: | 825.95% | ||
| AROC: | 33.54% | ||
| TROC: | 24.16% | ||
| Our 2021 Goal | |||
| 2021 Dividend Goal: | $1,071.42 | 51.77% | |
| 2021 Portfolio Value Goal: | $42,344.06 | 166.50% | Accomplished |
Dividend Investing and Trading Report
Last week, we have received a $59.67 in dividends income. We feel that the income will be growing faster as more of our holdings mature and become eligible for dividend payouts.
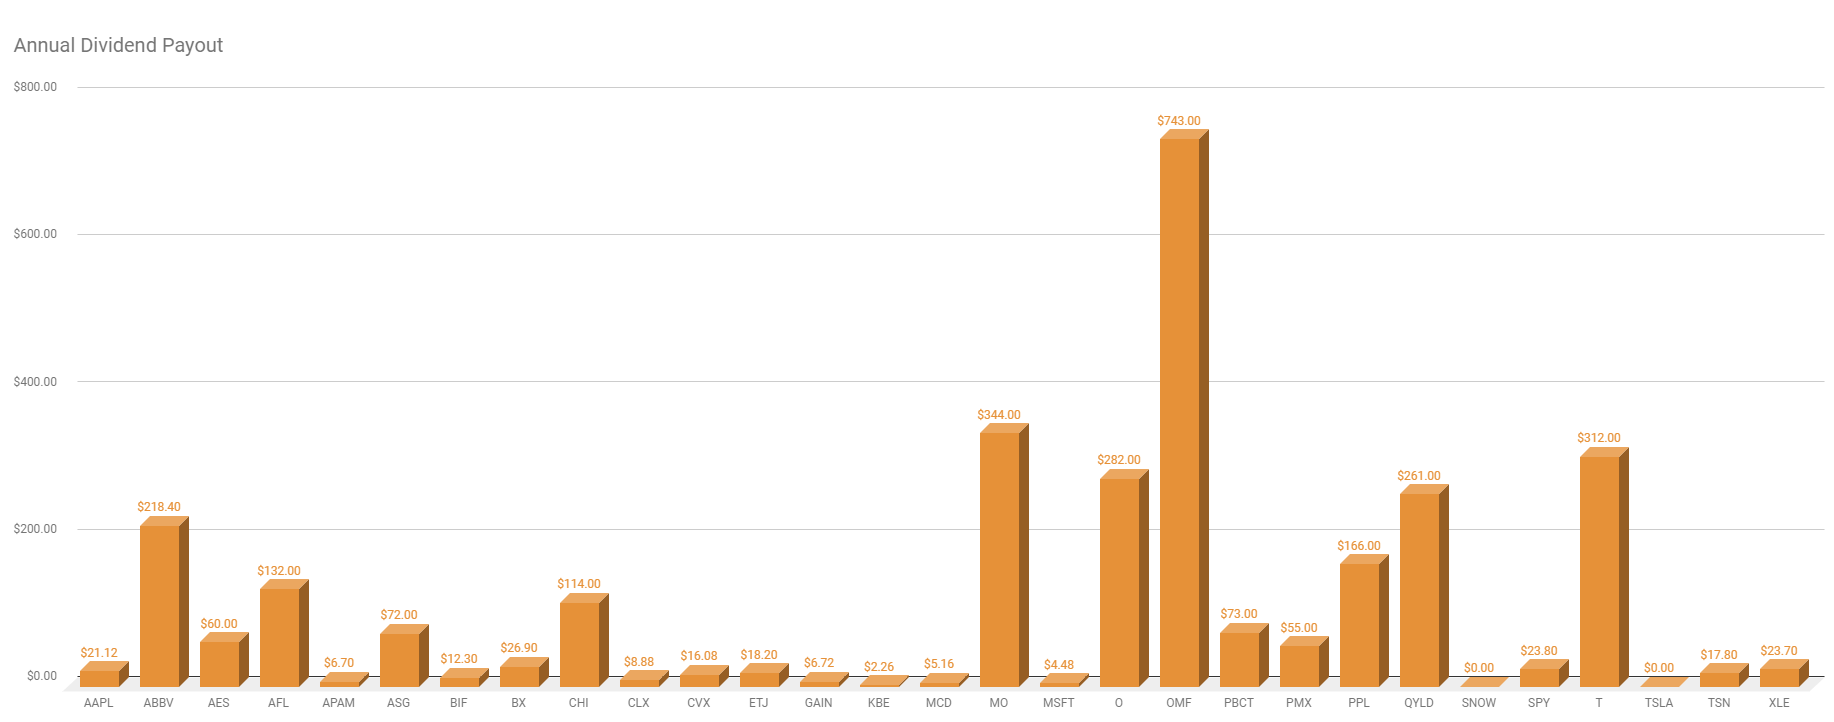
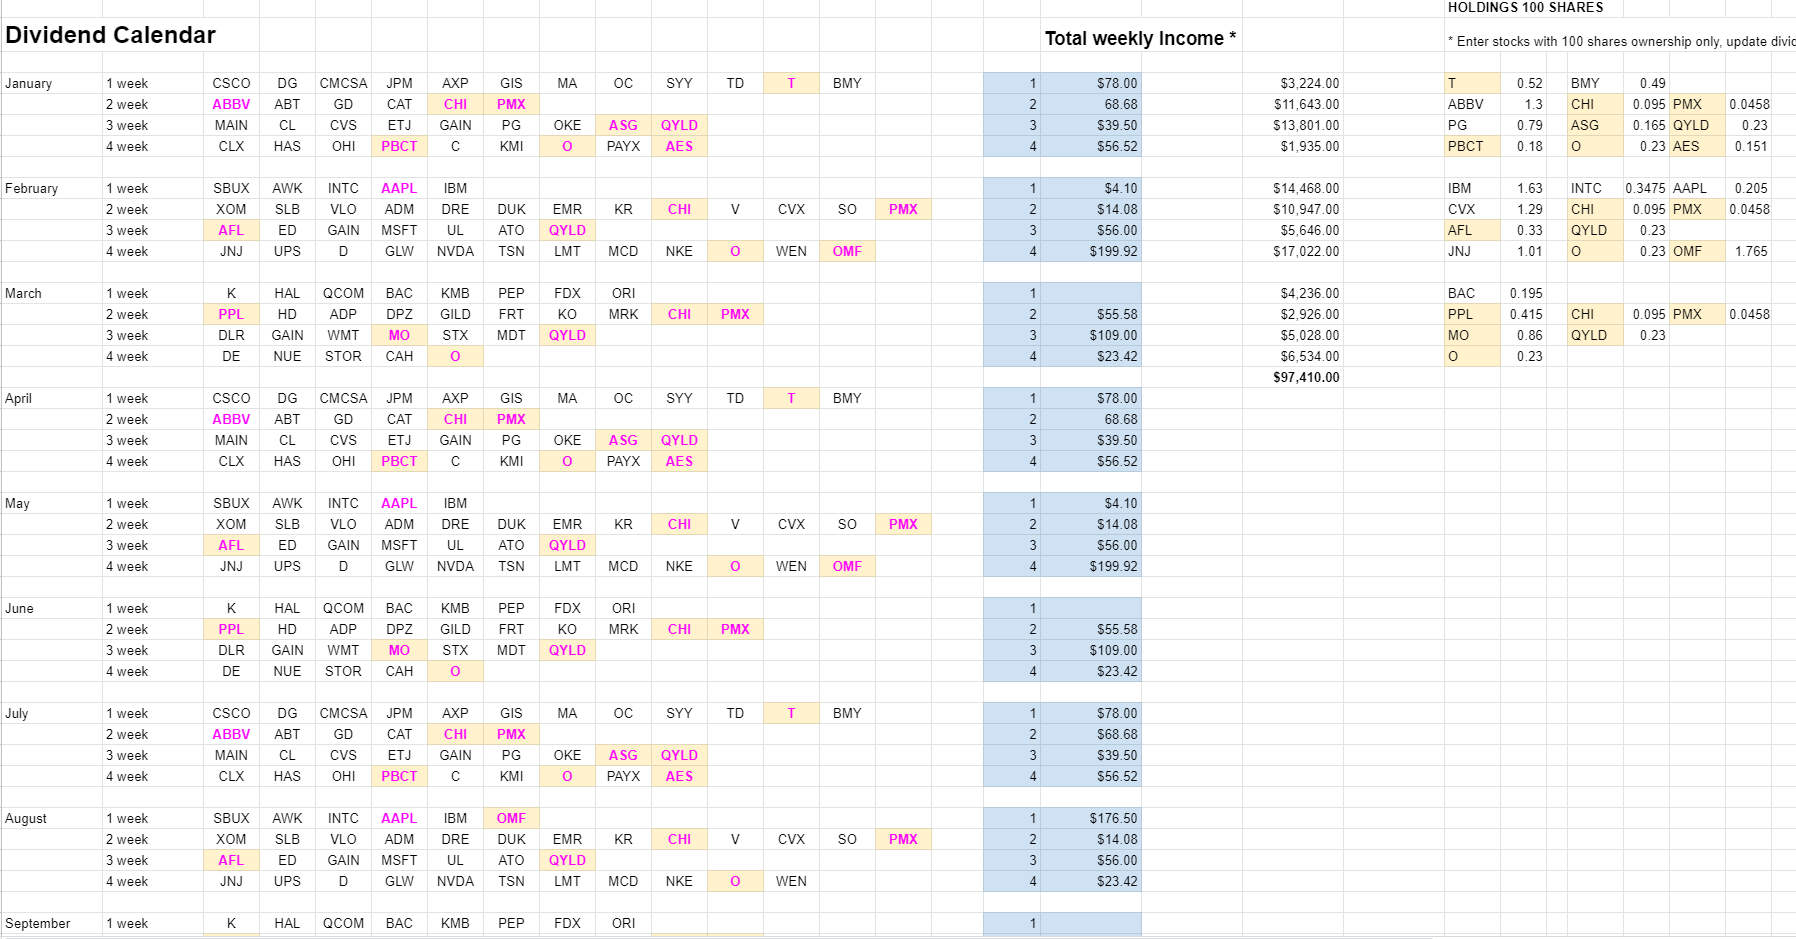
The chart below indicates our current annual dividend payout from our dividend stock holdings. A dividend growth investor needs to be aware of this payout from each stock. The chart indicates that some stocks contribute (or will be contributing to our income with large sums while others contribute very little. That can be a problem. If a company that contributes with large dividends suddenly cuts the dividend, it will have a very significant impact on our income (for example, if OMF cuts the dividend, or suspends it, the impact on our portfolio dividend income will be significant.
I am OK with this imbalance during the accumulation phase but plan to address it in the next phase of cultivating our portfolio. In other words, in the next phase, I will be accumulating stocks with lesser payout to match the stocks that pay more in dividends. If a company cuts the dividend, the impact of a lost income will be mitigated.
Last week, our dividend income reached 51.77% of our dividend income goal.

Options Investing and Trading Report
Last week we didn’t trade much. We rolled a few trades that got in trouble, such as OXY, BNGO, BA, and AAPL. We also re-opened a few new trades that expired a week ago. We opened a new strangle against DKNG, and OXY. Other than that, we have not done much trading last week.
The new trades and adjustments delivered $389.00 options premiums last week.
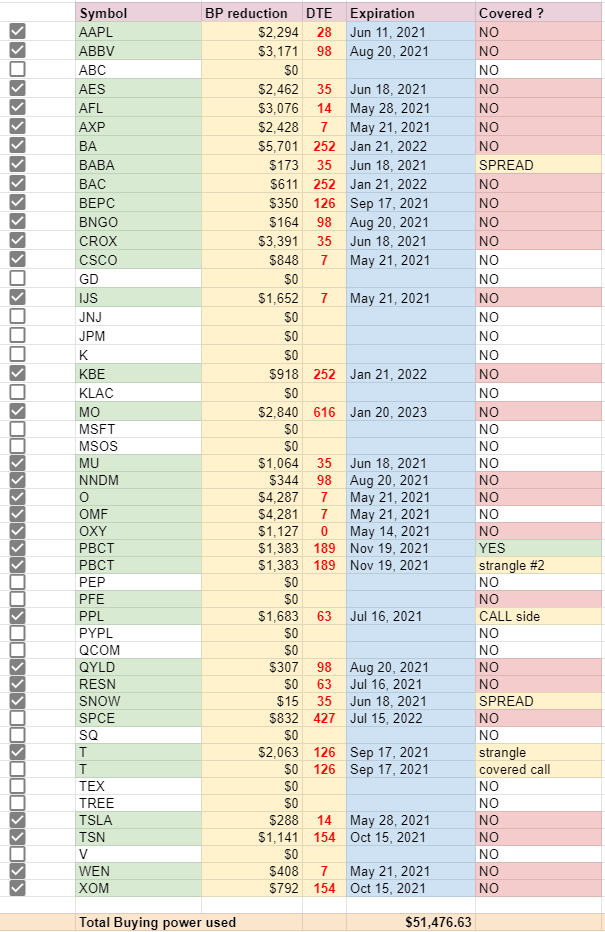
You can watch all our trades in this spreadsheet and you can also subscribe to our newsletter for our trade alerts.
Investing and Trading Newsletter
We started (or better say re-started) our free newsletter. We will send to our subscribers a notification of our new trades when we open them, when we adjust them, and when we close them or let them expire. The newsletter will also explain the trade and our expectations. As of now, it is free but it will not be free forever. But all existing subscribers will be grandfathered and receiving the emails for free.
Expected Future Dividend Income
As the table at the beginning of this report indicates, our aggressive dividend growth stocks accumulation is starting to show significant progress in our future dividends income. Our portfolio dividend yield and dividend growth will be bringing us almost $131,682.37 in 20 years and $5,941,988.95 in 30 years. We will keep aggressively accumulating dividend growth stocks to generate liveable income sooner than in 20 years. And the portfolio is starting to show this to be happening.
Market value of our holdings
Our non-adjusted stock holdings market value increased from $74,857.07 to $75,289.49. We did not add any new positions last week.

Our goal is to accumulate 100 shares of each stock of our interest and we are getting to that goal. However, as mentioned above, this harms our dividend payout and portfolio growth. Although, it is temporary. Therefore, once we reach this goal (which we set because of the ability to trade covered calls), we will start accumulating these shares to equalize our dividend income rather than have an equal amount of shares.
Investing and trading ROI
Our options trading delivered a 0.55% monthly ROI in May 2021, totaling a 33.22% ROI YTD.
Our account grew by 242.70% this year.
Our options trading averaged $3,903.67 per month this year. If this trend continues, we are on track to make $46,844.00 trading options in 2021.
Old SPX trades repair
This week we have not done any adjustments to our old SPX trades. We are still sitting on those trades and waiting for the untouched side to close so we can roll the trades again. The goal will be to roll the trades until we will be able to close them for at least break even and release the buying power. We will keep doing this only if the resulting trade will be a credit trade or a very small debit. If adjusting these trades would require adding more new money, we would rather close these trades and move on.
Accumulating Growth Stocks
Last week, we did not add any new growth stock positions to our portfolio. We may do so next week but I decided to take a breather from the aggressive accumulating of anything in our portfolio. I feel like I am stretching it too much and it makes me nervous. So I may take a break this month and just maintain the portoflio as is.
Accumulating Dividend Growth Stocks
Last week, we did and any new dividend growth stock positions to our portfolio.
Our goal is to reach 100 shares of high-quality dividend stocks and build a weekly dividend income as per this calendar, but we have made no changes to this goal last week:

You can see the entire spreadsheet here.
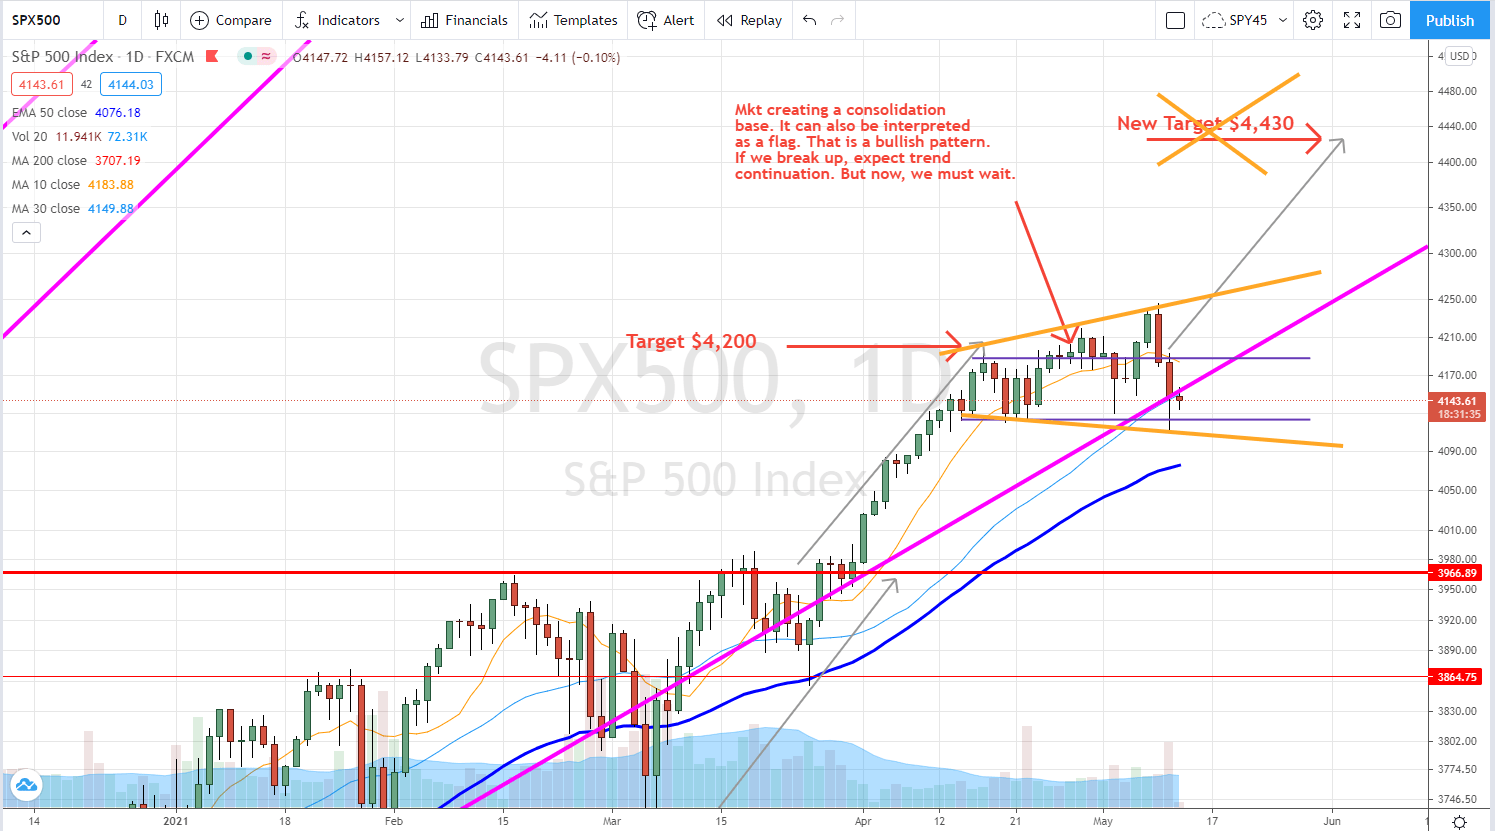
Market Outlook
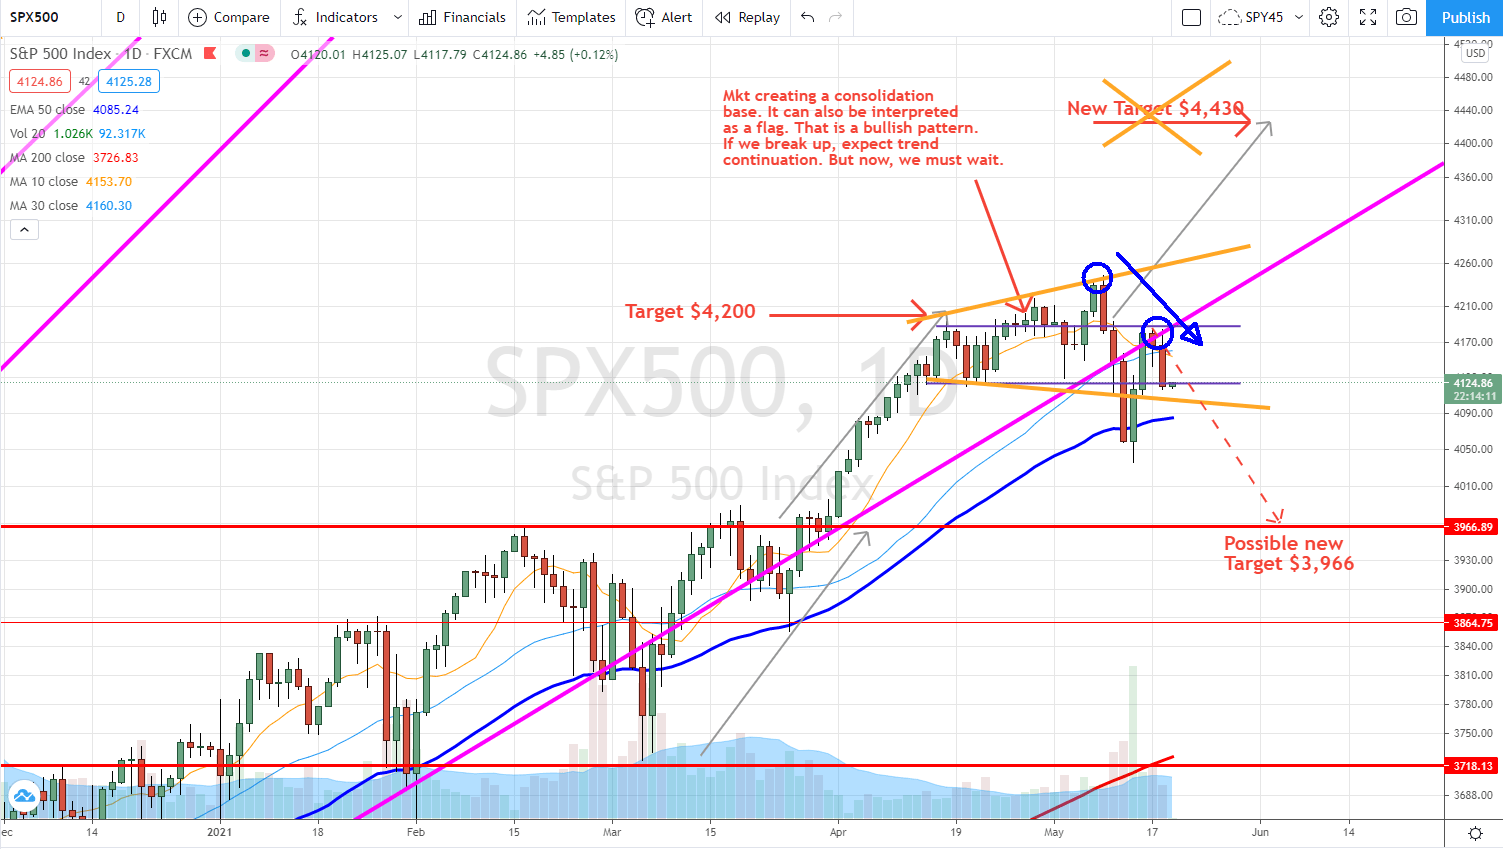
The market continued its sideways bound trading when optimism was replaced with inflation fears just to dismiss them later upon job report. Tech stocks continue struggling and the entire market seems to be consolidating. And that is good.
55% probability of going up
It is hard to say where we will go from here. It can be down as well as up. No one knows. We have to wait for more clues to find out. As of now, we are in a range and we have to wait. The market is slightly skewed to the upside but it can all change on a dime the very next day.

I still expect the stock market will most likely push to the $4,300 – $4,400 level (second half of July 2021) and then we may see some serious correction (15% to 25%) before the market resumes its uptrend. We are still in a very strong secular bull market, so do not expect any catastrophe or doomsday as talking heads and Perma-bears start crawling out of their holes. But that is just pure speculation.
Investing and trading report in charts
Account Net-Liq

Account Stocks holding

Or stock holdings still do not beat the market. However, I expect it to change over time. S&P 500 grew 46.22% since we opened our portfolio while our portfolio grew 16.03% only. On YTD basis, the S&P 500 grew 16.38% and our portfolio 9.05%.
Account Growth YTD

I expect our stock holdings to start outperforming the market as they mature. However, these are just our stock holdings. The entire portfolio beats the market by far thanks to monetizing those positions.
We consider our stocks our property, like real estate. We buy them to collect “rent” from those properties. We receive dividends, and we also receive premiums from options. We are building assets that we can monetize, generate income, and reinvest that income to buy more assets.
Our goal is to grow this account to $1,000,000.00 value in ten years. We are in year two.
And you can follow us in our journey growing our portfolio from $100 initial deposit to $75,000 in ten years (and maybe faster as I could grow this portfolio from approx. $2,000 to $70,000 in two years! Join us and subscribe to our $100 account challenge!
Investing and Trading Report – Options Monthly Income

Investing and Trading Report – Options Annual Income

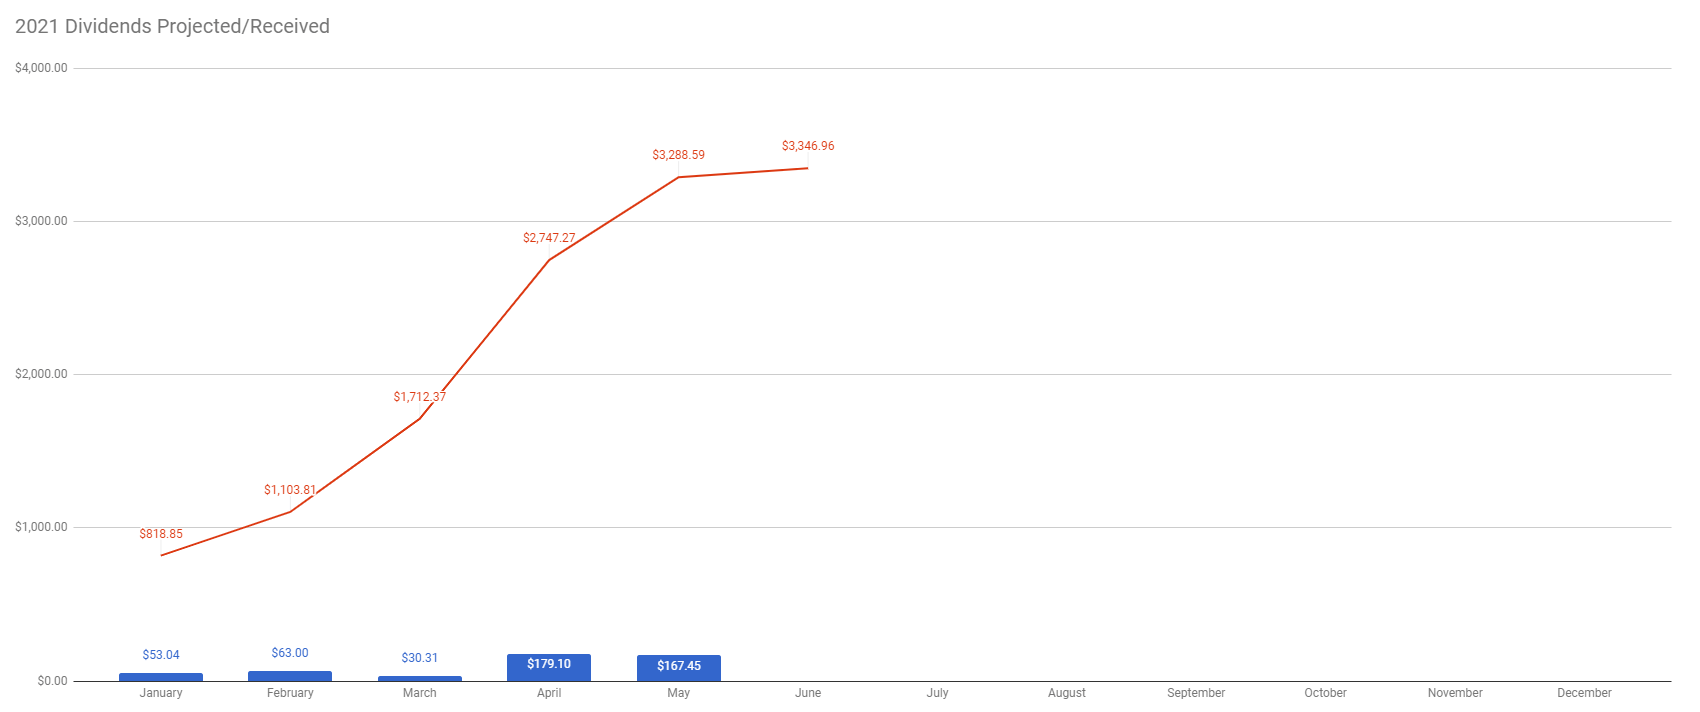
Our dividend goal and future dividends

We are on track to accomplish our dividend income goal, currently, we are at 51.77% of the goal to reach $1,071 of dividend income this year.
However, the chart below indicates that our dividend income will possibly exceed this goal as we accumulated enough shares to receive $3,347.42 in dividends.

Our account cumulative return
The chart below indicates our cumulative adjusted return. It shows how the last week’s selloff shook down our returns but we are recovering along with the market.

As of today, our account cumulative return is 23.71% (since March 13, 2021).
Conclusion of our investing and trading report
This week our options trading exceeded our expectations. I hope, the rest of the month will be even better.
We will continue accumulating the dividend growth stocks in our portfolio to reach 100 shares. We will also replenish our cash reserves to bring them back to 25% of our current net-liq value.
We will report our next week’s results next Saturday. Until then, good luck and good trading!
|
We all want to hear your opinion on the article above: No Comments |


Recent Comments