Weekly Newsletter   Challenge account   Weekly Newsletter   


Posted by Martin November 04, 2018
No Comments


October 2018 trading and investing results


S&P 500  2,723.06 -17.31(-0.63%)  Dow 30  25,270.83 -109.91(-0.43%)  Nasdaq  7,356.99 -77.06(-1.04%)
 

September results

October was a terrific as well as horrible month! Tons of volatility, negativity, pessimism and losses. At some point, it became depressive. The markets kept falling and falling with no retreat, no relief rallies. Any attempt to have a rally was immediately sold off and it faded.

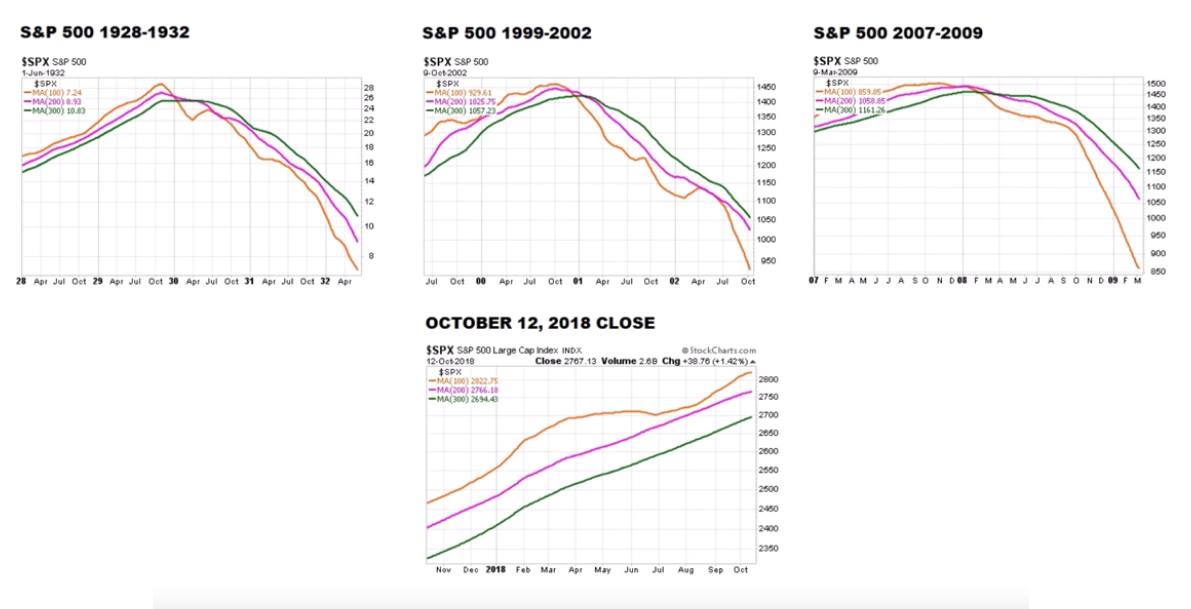
Is this the beginning of an end?

Many have asked this question and many predicted more selling more bear market to come.

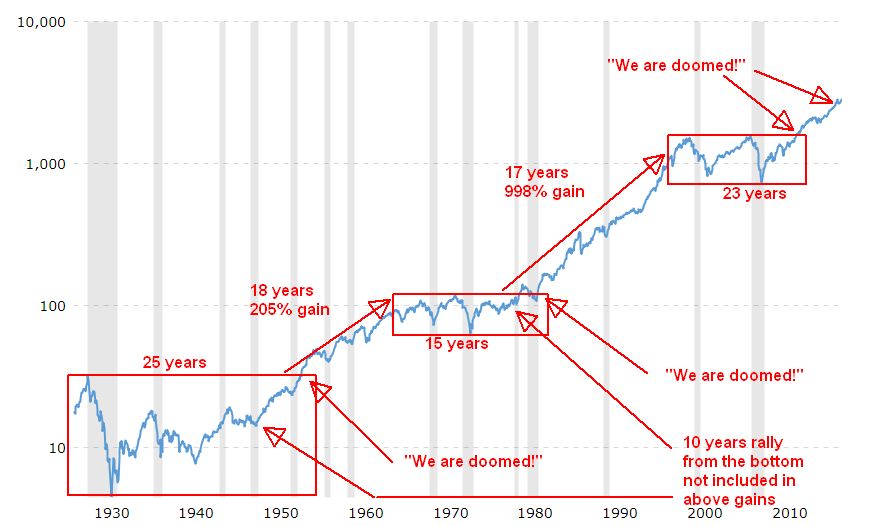
But we do not know what is going to happen. if you see all the predictors predicting this market to rally to the moon, others predicting gloom and doom, do not trust either of them. They do not know. They are just guessing.

No one knows where the markets will go. There is a lot of uncertainty and we may really crash into a bear market or resume a rally.

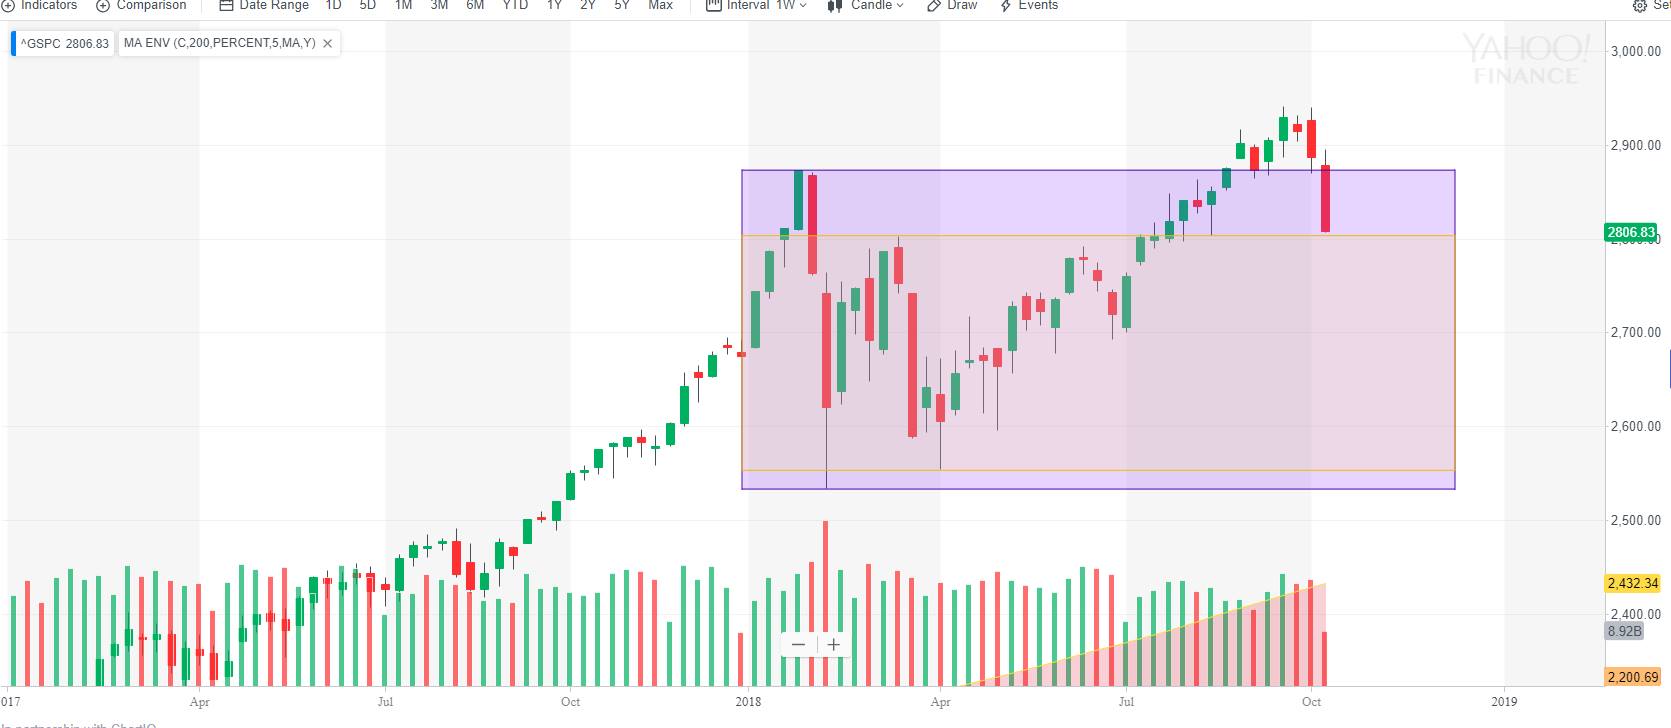
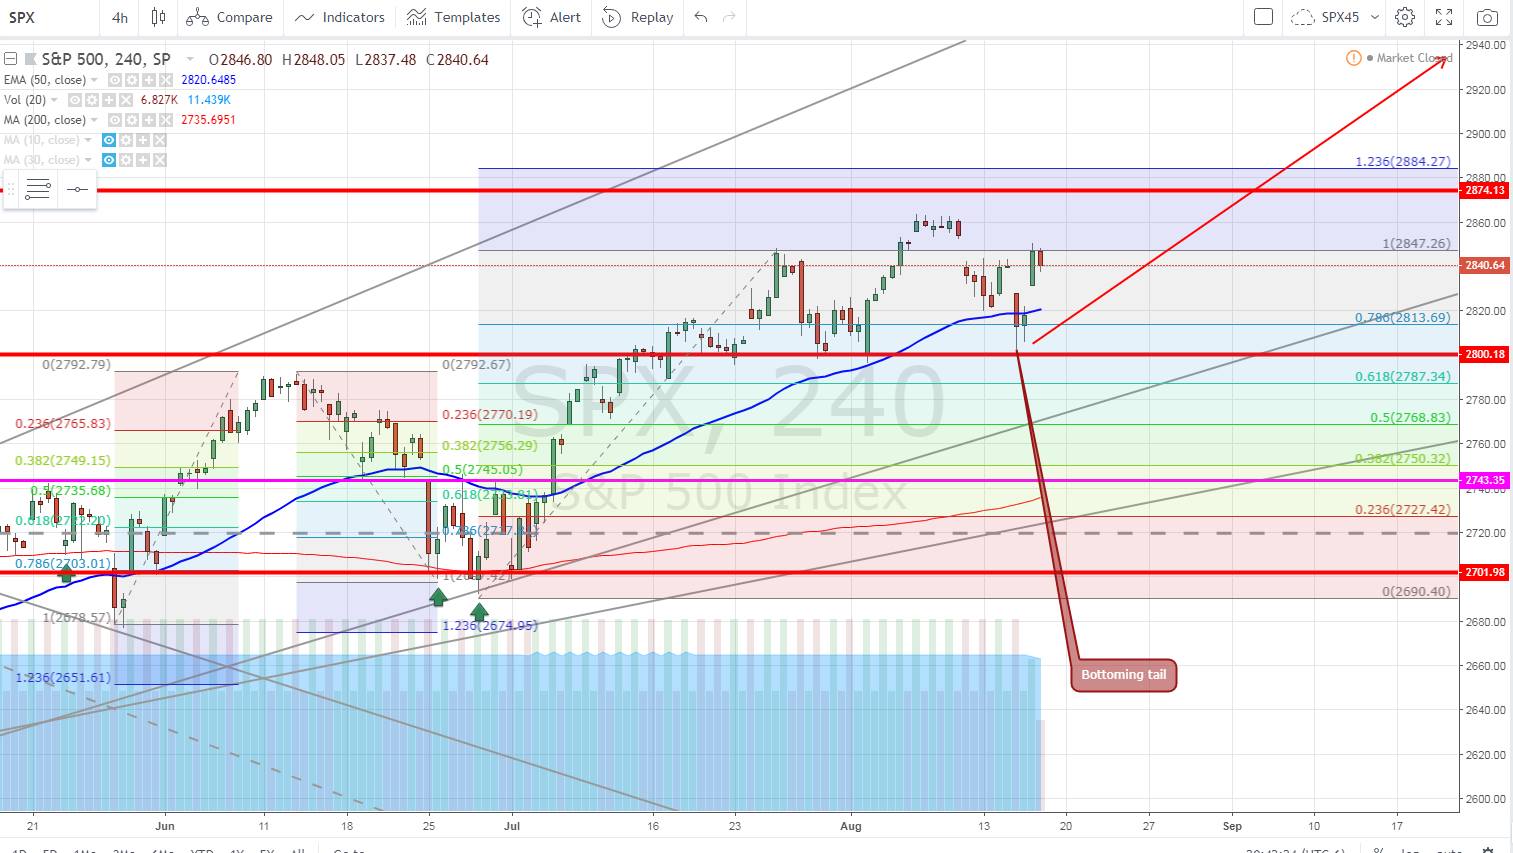
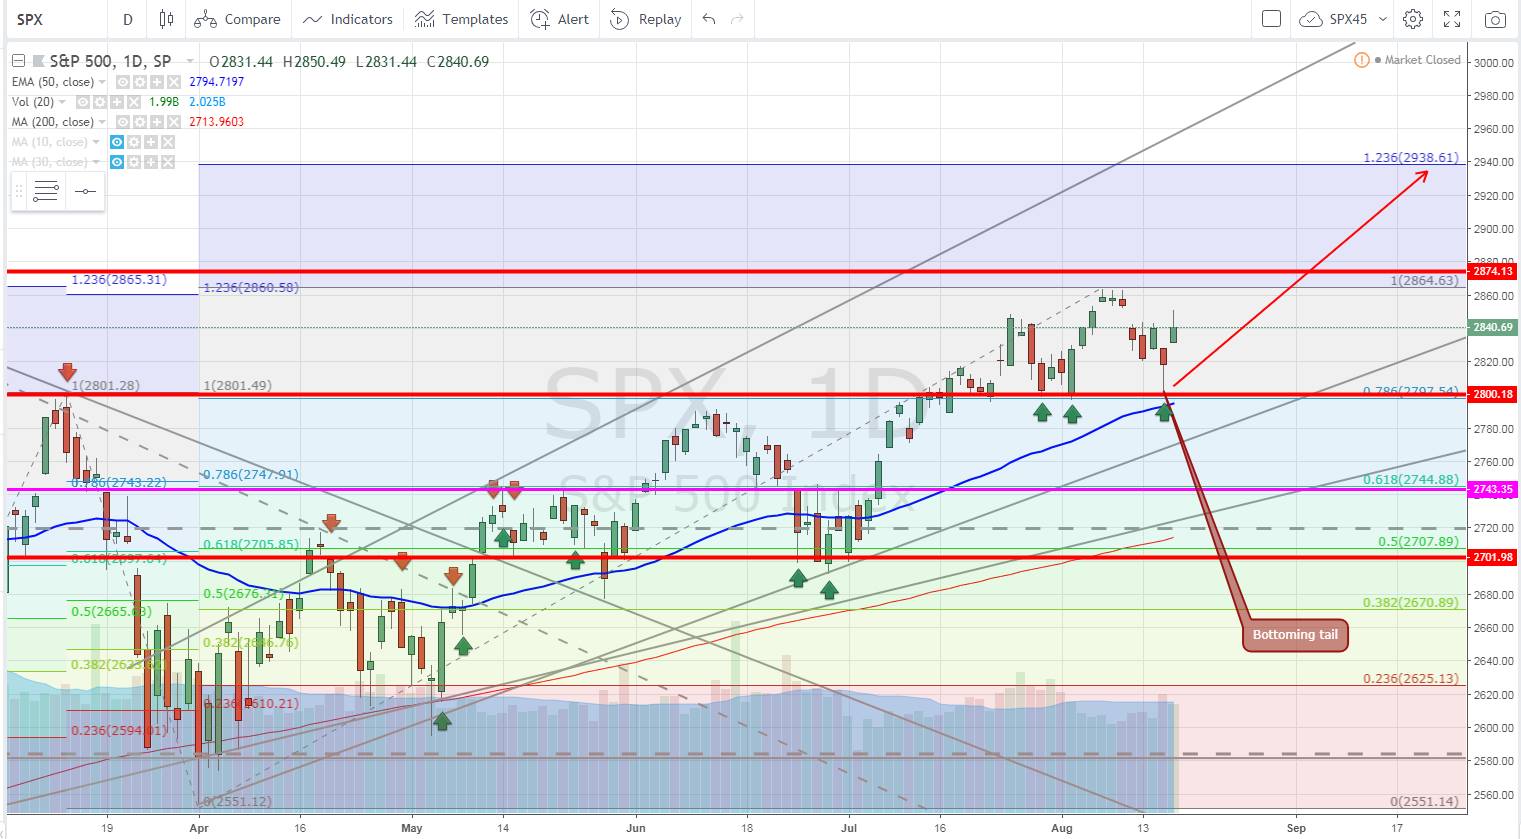
Last week the markets rebounded from the October selloff but we created a gap up. Most gaps, if not all, get closed at some point:

 
Trading Results
 

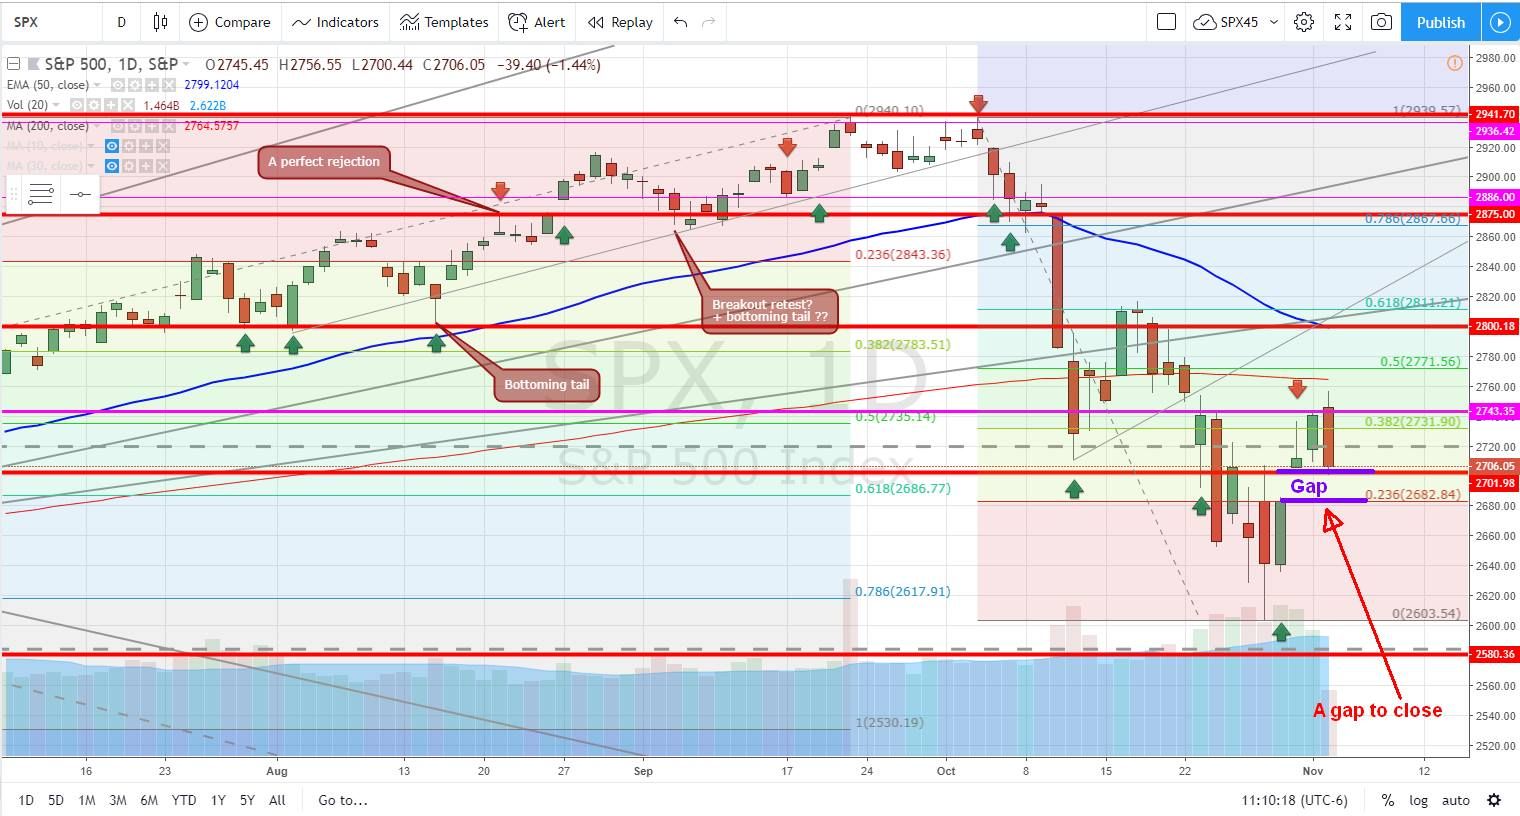
There are runaway gaps but these are fairly rare. Thus next week we may expect the market to actually go lower to close the gap.

We also have election on Tuesday and the results may also affect the market behavior next week.

Historically, the markets rallied after the midterm election. We may see the same happening this year too. But we will know for sure once the market reveals its direction.
 

In October, we were mostly adjusting our trades to make sure majority of them would be positioned well for their upcoming expiration. We had many Iron Condors on SPX with puts deep in the money. Thus we rolled those Condors lower to be not too deep in the money. We are still bullish, so we didn’t want to roll those Condors too low to avoid calls being in trouble once and IF the market really rebounds and start rallying.

We also had many spreads and Iron Condors using stocks as underlying but in this volatile market with a lot of whipsaw price action we needed to avoid getting our stock positions in the money and have them early assigned. We had SPY early assigned last week and lost money. We didn’t want that to happen to all of our stock options trades.

Thus we rolled most of our stock options into SPX options. The reason behind is that with SPX there is no risk of early assignment and in this zig-zag price action I can let either side of any Condor to get in the money without a fear of early assignment. And with any breached side I can wait until literally five minutes before end of a trading session to see if the breached side recovers or I need to roll it into another expiration. You won’t be able to do this with stock options.

Rolling our trades delivered nice premiums income, unfortunately, it didn’t end those trades and thus they stay open and consume net-liq of our accounts. And due to October selloff and many puts still in the money, our net-liq got smashed hard in October. But we see this as not the end of the world. I am optimistic and I will keep rolling those puts as long as they end up out of the money and expire worthless.

 
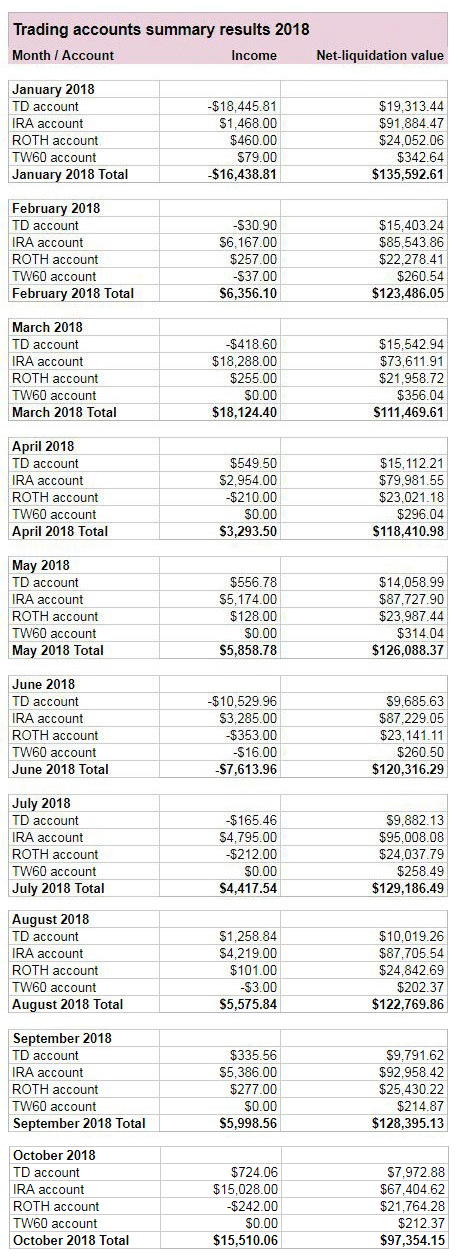
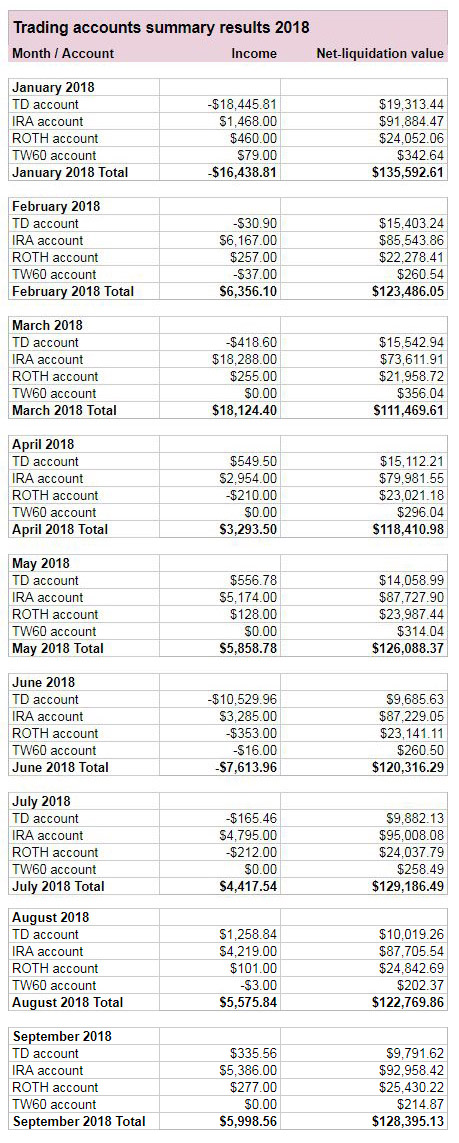
This is reflected in our end of the month trading results. As you can see, our net-liq ended down a lot while our income jumped up by more than $15,000 dollars in October:

 
Trading Results
 

We made $1,207.00 income last week and the Net-liq of all accounts increased by $4,368.16. But overall, October ended with a nice $15,510.06 dollars premiums while Net-liq finished down by $31,040.98 dollars.

We post our trades on our Facebook page and we also post (or try to post when I have time to do so) our end of day trading results.


Here are the entire 2018 year trading results:

 
Trading Results


 · Dividend stock investing


Dividend investing is doing great on both accounts – ROTH and IRA. I keep using 50% of all options income and buy dividend stocks. IRA account keeps growing fast with new stocks being purchased every month. ROTH is more or less stagnant.


Here is a review of our accounts stock holdings:

 
Traditional IRA
Trading Results
 

ROTH IRA
Trading Results
 

TD account
Trading Results
 

In August we purchased the following shares:

 
IRA purchases:
Dividend growth stocks
 

We haven’t purchase any shares in ROTH or TD this month.
 

We keep spending 50% of our options trading proceeds to buy good dividend growth stocks using our screener to get a better entry into the stocks. Although capital appreciation is not our goal but a secondary target, timing the entry creates good results as our positions are mostly up. However, do not be too excited, any large selloff can temporarily send those stocks down again. It is a dividend income what matters to our portfolios, not the portfolio value and capital appreciation. It seems to be evident that using options to grow the portfolio is the right way to do.


 · Dividend Income


IRA dividend income
Trading Results
 

ROTH IRA dividend income
Trading Results


We all want to hear your opinion on the article above:
No Comments


Posted by Martin October 28, 2018
No Comments


Another beautiful selloff which didn’t fail


In my last post I wrote about my bullish view expecting the sell off to finally end and the market working on a reversal. The reason for it was a nice and expected bullish candle formed at the bottom of the expected range.

It didn’t last long and we saw additional over 3% selloff. The market got hurt badly. The damage is so severe that it is no longer obvious whether we are still bullish or at the beginning of a bear market.

It is now a failed breakout or at least it does look like it:

 
Trading Results
 

Can this failure be saved?

I hope so but I do not know. I do not know the future and do not want to predict it.

At the market and among the analysts, we now have two sides each saying a different thing. One camp says “we are rolling into a bear market”, the other “this is a typical October mid term selloff”. The rest of us is left waiting which one will it be.

Our economy seems to be still strong (as FED believes by raising the interest rates). But is it?

Would a market really crash in a strong economy? Or is this economy not strong, just an illusion which will crash in the next 6 months too?

Or is this market seeing a liquidity issue due to QT (quantitative Tightening)?
 

I still see the market:
 

long term (>5 years) = bullish
mid term = (1 – 5 years) = bullish
short term = (0 – 1 year) = 50/50 bullish/bearish
 

We just need to wait for the next outcome. No new trades on my part, just managing the old trades only.

Last week, the market went from bad to worse. This again resets my “correction” tracker increasing the level of this correction from 8.5% to 10.6%, 35 days length, and 2628 lows:

 
Trading Results
 

Last time, I said “If this was really the bottom, expect a recovery”, today, I am not sure which is it. Are we done with selling or is more selling to come?

We do not know.

This selloff took a significant toll on our account net liquidation value. It is because all our put trades are now in the money!

Yes, they are all at full loss.

Last week, we rolled our Iron Condors down (lower) lowering our in the money put spreads and offsetting the cost by lowering the calls too. This resulted in a nice credit income of over $6,000.00 dollars. But our net-liquidation value took $11,000 decline.

 
Trading Results
 

People think that my accounts and my trading is bad because my account is down. But it is down not because I took losses by closing my positions. It is down because our puts are in the money.

We keep our trades rolling so yes, at this moment we are closing old trades at a loss but we are opening new trades completely offsetting that loss by bringing in more credit and giving ourselves more time to recover. We are still bullish long term. And even if this market goes to a 20% or more correction (bear market), it still will not be a secular bear market! And even if it lasts 150 or 200 days to recover from 20% or 30% decline, we are OK to wait for recovery and keep adjusting our trades accordingly during that time.

 
Strategy for now?
 

1) As an option trader – I will wait. No new options trades but managing the open ones only. The market seems to be in a point of indecisiveness. It goes up and down violently and in my opinion difficult to trade safely. Thus I want the market to provide a direction first. Until then, I will be managing the old trades only.

2) As a dividend investor I will be taking advantage of the selloffs and buy more shares of dividend growth stocks.

 
Trading Results


We all want to hear your opinion on the article above:
No Comments


Posted by Martin October 23, 2018
No Comments


Another beautiful selloff which failed


Today, the market showed a spectacular rally and recovery from lows.

The futures sank by 1.40% and after the market opened we went even lower and undertaken the previous lows of 2711 level (losing over 2% at 2691 level resetting my correction tracker).

But then a spectacular rally happened.

 
Trading Results
 

As mentioned in a video in my yesterday’s post we did went below the previous lows, re-tested the correction lows, and then started seeing a hammer candle indicating exhaustion. All we need now is a confirmation and we will be moving up again.

This selloff was expected. For a few days after a bounce the market was signaling that we may re-test the lows or even go below. And it happened. And as it happened, big money came back and started buying. All we needed a flushout and a hammer candle to form.

Only, I didn’t expect it to happen in one day – today.

Tomorrow we may see some easy movement and possibly going lower again. Although, I wish this rally continue.

This resets my “correction” tracker increasing the level of this correction from 7.8% to 8.5%, 32 days length, and 2691 lows.

 
Trading Results
 

If this was really the bottom, expect a recovery.

 
However, despite buyers coming back and pushing this market up we had an SPX Condor expiring tomorrow. The put side got so deep in the money that I didn’t expect recovery by tomorrow’s end of trading so I decided to roll the condor away. I closed almost worthless call side, rolled the put side, and sold new call side to offset the cost. This trade was a wash (debit was fully offset by a new credit, see the last three groups of trades).

 
Trading Results
 

Then we also had TESLA trades. The Citron group announced being bullish on TSLA and the stock rallied hard. My calls got busted so I had to roll them. I rolled the entire Condor higher and reversed a few calls into puts. Still, TESLA will be a pain in the neck and I am planning on reversing those trades into SPX Condors (I did one trade reversal though, today).

 
Trading Results
 

Trading Results
 

Trading Results
 

Today’s overall trade balance: +$1,216.00 credit


We all want to hear your opinion on the article above:
No Comments


Posted by Martin October 14, 2018
No Comments


Correction not bear market


It is funny watching people panicking about last week market decline.

Many panic and predict bear market. Many are guessing what happens next. Some are drawing their charts drawing lines of the next decline and claiming historicity of their claim.

 
Predictors
 

Claiming historical evidence and predicting the drop all the way down to 2275 indicates more a lack of studying the history than knowing history.

And ignoring broader context.

Bear markets don’t come in 2 days

Bear markets really do not start in a week or 2 days of a sharp drop. Drops are usually smaller not so violent and they are preceded by other warning signs. This market dropped suddenly and violently. Even the “we know all” media were baffled and guessing what may have caused such drop.

The bear markets are preceded by other signs which would warn you in time that bear market is coming: raising interest rates, declining corporate profits, and investors’ optimism.”

Although FED is raising rates, they are still historically low. In December 2007 interest rates were almost 5%, today, the rates are at 2.5%.

Corporate profits are raising with no sign of slowing. And investors’ optimism? They are spooked by any flow of a breeze out there. The amount of bearishness is outstanding. Many people are still sitting aside in cash, spooked by never ending predictions of bear market coming “tomorrow”. According to AAII 63% of regular investors are neutral to bearish. Only about 35% are bullish.

Add to it fear of valuation, trade war, political comments of the President, FED intervention, and fear of slow down in China, Italy, Greece, Egypt and others. The markets do not turn bear upon fears. Corrections? Yes, they do.

Fundamentally, this bear market is not showing signs of being rolling over.

Technically, this market is not showing any signs of a rollover either.

Look at the following charts with simple moving averages from 1930, 2000, and 2007, in comparison with 2018. Do they look same or similar?

 
technical analysis
 

If you think that they are same then yes, the bear market is coming!

But you may also need to visit an optometrist.

Some spooked investors claimed that we cannot compare long term trends with short term time frames. But the long term time frames determine the short term.

If the long term indicates that we are in a cyclical bullish trend, and in fact, we broke from a long term consolidation (24 year long) in 2016, we are more likely to see a growth than another bear market:

 
technical analysis
 

If you know in what cycle the market is you may rest calm about any corrections or short term bear markets. I recommend watching a video made by Chris Ciovacco analizing the market from a distance. This definitely helps not to panic and stay the course when selling like this happens:


Corrections are healthy and needed for the stock market to go higher. There is no need to panic. However, there is a need to watch the market because although fundamental and technical reasons for this bullish market hasn’t changed it may change any day. and it will change for sure. But be assured that you will be able to react to the change. The rollover of the market is a process and it takes days and months before you see the market making bearish moves. Last week’s movement wasn’t it, yet.


We all want to hear your opinion on the article above:
No Comments


Posted by Martin October 11, 2018
No Comments


Gut wrenching volatility


A volatility in the stock markets is normal. It is a part of it. When looking in the rear mirror and see all those drops we think: “it is all OK and normal.”

But experiencing such volatility in real time is painful and… gut wrenching.

Many people can’t take the pain. I must admit, I too feel sick to the bottom of my stomach when my own cash is involved in this market which is eating it up. But I keep saying myself: volatility is normal, volatility happens. It must happen.

And when it happens we panic. And sell and run away.

I have experienced investors in our group who couldn’t take it and bailed out.

For the last 7 days the stock market was in a selling mode. First few days were slow and markets rallied at the end of the trading session. It didn’t recover the losses though, just rallied, creating nice tails. At first it looked like we had a small dip.

But last two days – Wednesday, October 10, the market lost the support and tanked hard. It lost 94 point or -3.36%!! On Thursday, October 11th the market again looked like it might recover. In the afternoon, selling sped up and S&P lost another -2.06% !!

 
S&P 500 correction
 

At first, I expected the market to honor a support at 2875, which was January high, the market smashed below. I expected it to honor another support at 2801 level. It didn’t hold.

 
S&P 500 correction
 

The 50% Fibonacci retracement at 2745. The market breached that level today.

 
S&P 500 correction
 

The selling was sharp and ugly.

What to do when the market sells off like this?

There are two types of volatility out there: volatility to ignore and volatility to respect.

In order to know what to do, an investor needs to step away from day to day charts and look at higher time frames. And doing so today, you will see that we are clearly in a secular bull market.

If you think that this selling is the beginning of a bear market then know that bear markets never happen in two days, bear market sneaks in slowly before it hits hard and it takes for a long time of selling, not just 7 days. Knowing that we are in a long term secular market and knowing that we just saw 7 days of selling will help you determine whether to ignore or respect today’s volatility.

As a stock investor, knowing that this is just a retracement, an expected correction, you do nothing! Stay calm, hold your stocks, and buy more shares! This is a gut wrenching volatility for sure but not a roll over to a bear market. Not yet!

As an option trader, it is a bit more complicated. Options are instruments which have limited life time. They expire. You do not want to get caught deep in the money at expiration or be assigned early. Then close the trade or roll it. I prefer rolling it. Roll it far away and sell offsetting calls, or keep selling calls to collect as much premium as possible.

With corrections like this, you want to move your options far away to give the market time to repair and eventually the price will come to your puts and you will be safe again.

The following table shows all corrections since 2009 lows. They happen, they may be ugly, but they eventually recover. Some sooner, some take longer:

 
S&P 500 correction
 

Also, note May 2, 2011 to October 4, 2011 drop. The market declined -21.6% during that period of time. By definition, a 20% drop in stock prices indicates the market to be in a bear market!

So, if someone will be telling you that this bull market is the longest bull in history, lasting more than a decade, then that person is ignorant. We had a bear market in 2011. So this bull market is only approximately 7 years old. It still can last another 10 years. With gut wrenching volatility.


We all want to hear your opinion on the article above:
No Comments


Posted by Martin September 29, 2018
No Comments


September 2018 trading and investing results


S&P 500  2,913.98 -0.02(0.00%)  Dow 30  26,458.31 +18.38(+0.07%)  Nasdaq  8,046.35 +4.38(+0.05%)
 

September results

September 2018 is over and it is time to report our trading and investing results. Overall September was a great month but it was also a very volatile month.

Our IRA account performed great. Our cash increased to $104,600.00 and we purchased a few new stock position in dividend growth stocks. Our net-liq is stagnating as we are opening new trades which lower it temporarily. As trades get to close net-liq will grow too.

Our ROTH account is however showing signs of great improvement. Last year, we got into a few trades which went bad preventing us trading the account. If however, the trend of improvement continues we will be again trade ROTH more actively.

Our TD account is still depressed but also getting better consolidating it.

In September, we achieved the following results:

 
Trading Results
 

We made $5,998.56 dollars in September. Net-liq of all accounts increased by $5,625.27 this month.

We post our trades on our Facebook page and we also post (or try to post when I have time to do so) our end of day trading results.

 
Here are a few posts from the Facebook page you can review:
 

WEEKLY RESULTS, September 28, 2018

Trading day September 28, 2018

Trading day September 27, 2018

Trading day September 26, 2018

Trading day September 25, 2018

Trading day September 24, 2018


Here are the entire 2018 year trading results:

 
Trading Results


 · Dividend stock investing


Dividend investing is doing great on both accounts – ROTH and IRA. I keep using 50% of all options income and buy dividend stocks. IRA account keeps growing fast with new stocks being purchased every month. ROTH is more or less stagnant.


Here is a review of our accounts stock holdings:

 
Traditional IRA
Trading Results
 

ROTH IRA
Trading Results
 

TD account
Trading Results
 

In August we purchased the following shares:

 
IRA purchases:
Dividend growth stocks
 

ROTH purchases:
Dividend growth stocks
 

We keep spending 50% of our options trading proceeds to buy good dividend growth stocks using our screener to get a better entry into the stocks. Although capital appreciation is not our goal but a secondary target, timing the entry creates good results as our positions are mostly up. However, do not be too excited, any large selloff can temporarily send those stocks down again. It is a dividend income what matters to our portfolios, not the portfolio value and capital appreciation. It seems to be evident that using options to grow the portfolio is the right way to do.


 · Dividend Income


IRA dividend income
Trading Results
 

ROTH IRA dividend income
Trading Results


We all want to hear your opinion on the article above:
No Comments


Posted by Martin September 01, 2018
3 Comments


August 2018 trading, investing, results


S&P 500  2,901.52 +0.39(+0.01%)  Dow 30  25,964.82 -22.10(-0.09%)  Nasdaq  8,109.54 +21.17(+0.26%)
 

August results

August 2018 was a mix bag of goodies and rotten apples, so to speak. It was good until it wasn’t. We made nice income but then the market started rallying and many of our Iron Condors started seeing call spreads breached.

As I expressed in our Facebook group, I was happy when the market retreated a bit as it released the tension on our call spreads. My dilemma and worries were that if I started rolling the Condors higher and the market retreats more, those rolled Condors will suddenly hurt us on the put side.

We rolled a few Condors with deep in the money calls and sure enough, as the market dipped on Thursday and Friday last week even more, the puts were suddenly in trouble.

No matter what, all adjustments I made to our trades had negative income on our trading income as well as net-liq (net liquidation value). We also closed a few open trades prematurely to release cash in case more rolling will be needed.

Overall, my outlook of the market is bullish so these pullbacks and retreats are just a small consolidation and nothing to worry about. There fore I will not be rolling down those puts which are now in the money but rather keep removing calls as I expect this market to continue higher.

 
Trading Results
 

Income, although hurt a bit by adjusting the trades was good, We still made nice $5,575.84 dollars monthly income. Net-liq of all accounts dropped but this doesn’t worry me at all as it is just a temporary decline due to increased volatility of the open trades. If and after those trade close successfully the net-liq would rise back up again. Should the market keep dropping (which I do not expect), then I will start converting all open put trades into calls as we did in February and March this year. Otherwise we will keep trading bullish trades.


Here are the entire 2018 year trading results:

 
Trading Results


 · Dividend stock investing


Dividend investing is doing great on both accounts – ROTH and IRA. I keep using 50% of all options income and buy dividend stocks. IRA account keeps growing fast with new stocks being purchased every month. ROTH is more or less stagnant.


Here is a review of our accounts stock holdings:

 
Traditional IRA
Trading Results
 

ROTH IRA
Trading Results
 

TD account
TBD
 

As of now, I do not track dividend stocks in TD account. We have a few positions in dividend stocks but our focus in this account would again bringing it up to speed, grow the capital and then adopt the same strategy as in IRA.
 

In August we purchased the following shares:

 
Dividend growth stocks
 

We keep spending 50% of our options trading proceeds to buy good dividend growth stocks using our screener to get a better entry into the stocks. Although capital appreciation is not our goal but a secondary target, timing the entry creates good results as our positions are mostly up. However, do not be too excited, any large selloff can temporarily send those stocks down again. It is a dividend income what matters to our portfolios, not the portfolio value and capital appreciation. It seems to be evident that using options to grow the portfolio is the right way to do.


 · Dividend Income


ROTH IRA dividend income
Trading Results
 

IRA dividend income
Trading Results


We all want to hear your opinion on the article above:
3 Comments


Posted by Martin August 20, 2018
7 Comments


Buying dividend stocks out right or timing the entry?


There are two camps among the dividend growth investors. One camp represent an idea that over the long run, it doesn’t matter whether you buy the stocks out right. As long as you keep buying regularly and for the next 20 years, the difference is negligible.

The second camp advocates calculating the fair value and time the entry to get a better price of entry.

For many years I belonged to the first camp. I used to buy a small amount of shares (as long as it was commission feasible) and did it regularly. It was mostly because I didn’t know how to obtain the proper data and information to calculate the fair value, to determine whether a stock is undervalued or over-valued. What seemed undervalued to me was undervalued to others. So I gave up looking for a better entry points. It all looked to me as a game of dreamland-style data.

While searching for a method how to evaluate stock I got many confusing numbers, results, and conflicting methods. It made absolutely no sense to me and I couldn’t see any consistency in the effort of searching for a fair value.

As time went by, I realized that you need to find a method you feel comfortable with, create the rules based on that one method and then rigorously ignore everything else.

To illustrate the point, I followed a few methods – fair value calculated by Dividends4life, author and owner of dividend growth stocks blog who makes great analysis of several dividend growth stocks. If you are new to dividend growth stocks investing I strongly recommend you following D4L’s blog and read his analysis.

The second method was Graham formula and then my own method.

For example, Automatic Data Processing Inc (ADP) Graham number is $50.33, D4L’s calculated fair value is $108.86, and my own calculated fair value is $124.24.

So, which is it?

Well, pick a method and stick to it with meticulous consistency. It will make you no good jumping from one calculation to another. Pick one method and stick to it.

Over time, I created my own screener added my formulas and now stick to it.


What is in it? I use three criteria to determine whether a stock is a “buy” or not.

The first criteria is a fair value:
 

The screener uses the following inputs: Next 5 year EPS growth estimate consensus, forward P/E, current EPS, dividend rate, dividend growth over the next 5 years, desired minimum annual return on investment, and payout ratio. Using these inputs I calculate my fair value.
 

The second criteria is that the stock must retreat and trade 10% or more below its 52 week high.
 

And the third criteria is that the stocks current dividend yield must be higher than the 5 year average dividend rate. We know that if the stock price goes down, the dividend yield goes up. If it exceeds 5 year average, the stock can be considered undervalued.
 

If all three criteria are met at the same time, the stock becomes a “buy”. In the watch list / screener such stock is displayed in a column “Trd?” and is highlighted in green.

Here is how the current result looks like today:

 
Trading Results
 

The watch list now updates automatically. Inputs for calculations are automatically imported from web sites such as Finviz, Yahoo Finance, Google, and other financial portals, loaded into formulas and results are displayed. Now all you need to do is to wait when a stock appears as “undervalued” or a “buy” in the column “Trd?” and buy.

This watch list can make your investing easier too. You can follow the watch list and keep investing on your own. If you want, you can send us a request for a stock addition and we will add your dividend growth stock into our watch list and you can keep following your stock in the screener.

We invest our options proceeds. We trade options, collect premiums, and invest 50% of the premiums into the dividend growth stocks from the watch list above. This is a fulfillment of my dream – create a stream of income which can be invested into stocks. This is what I striven to create since 2006 when I started investing into dividend growth stocks.
 

Investing into stocks by “timing” entry by waiting for the proper time to buy as advocated by Benjamin Graham or Warren Buffett, I already see good results. Once we started managing our own former 401k, now self directed IRA account and using the above described strategy our dividend growth stocks quickly delivered over 8% capital gain since November 2017 when we purchased the very first dividend growth stock vs 6.47% S&P 500 index gain. Add dividends income on top of this gain (currently 0.33% additional income) and this is a market beating result:

 
Trading Results


We all want to hear your opinion on the article above:
7 Comments


Posted by Martin August 18, 2018
No Comments


WEEKLY RESULTS, August 18, 2018


Last week was a good week. It was a bit choppy as Wall Street was worried abut Turkey, then wasn’t worried about Turkey, and on Wednesday it was worried about Turkey again.

No matter what, Turkey became just an excuse for a shake out to get rid of weak hands and move on without them. It is exactly what has happened next week.

 
Trading Results
 

The market created nice bottoming tail when everybody was panicking about Turkey. The very next day the candle got confirmation and we could load our accounts with new trades – and make money.

 
Trading Results
 

It is more apparent on the daily chart:

 
Trading Results
 

Choppy markets are great for income, they can make you nice cash. They are not as good for your net-liq (net liquidation value) of your account as zig-zags of volatility spiking or drying up within hours can impact the account. One day, our net-liq was at $95,000 and the very next day we dropped to $87,000 just to recover a bit by Friday.

Since we had the bottoming tail confirmed we may see more uptrend in the coming week and reach the January highs which are now a resistance. At the resistance we may see some downward push which will be good to enter more bullish trades.


Last week our screener provided a few stocks good to buy.

Here are the dividend growth stocks we purchased in August using 50% of our options trading proceeds:

 
Trading Results
(click to enlarge)


We all want to hear your opinion on the article above:
No Comments


Posted by Martin August 06, 2018
No Comments


Ignorance of media


It is truly stunning how ignorant people are when it comes to stock market and investing.

In many human activities and jobs people usually go and educate themselves before they participate in that activity. If one wants to become a dentist, he or she goes to school and spends 10 years educating herself. If another person wants to be a lawyer, it is the same, he goes to school and spends a lot of time in school before he becomes a lawyer. And same goes with a surgeon, and engineer, and even a machinist or operator in a factory.

But when it comes to investing you can be as dumb as a log and participate in the stock market, lose all your money, blame the government and other participants for it, and then publish your own opinions and present it as a fact.

Everybody is now worried that this market is over. That this market pushes itself to the end. This is what was published in media recently:

 
Media
 

All it takes is a perspective. In my previous post I said that all data point to a high probability of this market being at the beginning of something big. Of course, it may change any day and we need to watch this market on a day to day basis to see if anything is changing or not. As of today, we have no indication of the market changing but rather be at the beginning of a new strong rally from a recent breakout.

Here is a picture I posted in my previous post:

 
Weekly Results
 

Let’s zoom into the most recent period of time.

 
Recency bias
 

When people look back, 23 years into history, all they see is a market which failed them a lot in the past. They saw a new high and a large selloff, then recovery and selloff again, and again. No wonder that today, they say: “We have seen this before!”

And media are propagating this also as you could see above. Same young inexperienced people are now looking back 10 years behind and think that they know everything. Yet they are missing the big picture.

It is true, we have been in this before! But not in a way as others and media think.

We have seen this market rallying up, then consolidating the gains, rallying again, and so forth. When the markets broke from previous consolidations people too were scared and predicted the market to crash. All they remembered was a short term picture of long consolidations and when the market broke, they screamed: “We are doomed!”

But then, the markets made new highs and delivered new gains. and many doomsayers stayed aside because they didn’t believe what was developing in front of their eyes.

 
Recency bias
 

The gains listed in the chart above and time frame (18 years and 205% gains, and 17 years and 998% gains) do not include time and gains the market provided from the bottom of the consolidations. The last 10 years, from the last consolidation low is not included:

 
Recency bias
 

Of course there will be corrections and selloffs on the way up into the new highs but these will be just a great opportunity to buy stocks from weak hands. This is not a prediction of what is going to happen. But there is a high probability of this development in the markets in the next decade or more.

Recently, I purchased my brand new crystal ball to predict the market.

This is what has arrived:

 
Recency bias
 

With this crystal ball I will only be 50% correct in predicting the market! So be careful!


We all want to hear your opinion on the article above:
No Comments


This site has been fine-tuned by 14 WordPress Tweaks