Weekly Newsletter   Challenge account   Weekly Newsletter   


Posted by Martin December 01, 2018
No Comments


November 2018 trading and investing results


S&P 500  2,760.17 +22.41(+0.82%)  Dow 30  25,538.46 +199.62(+0.79%)  Nasdaq  7,330.54 +7.88(+0.52%)
 

September results

2018 is going to an end and it is turning out to be a bad year for us. the entire year was volatile and we saw two wild corrections, one in January and the second in October. Both had a significant impact on our accounts.

And both corrections once again proved the significance of “staying small”. And I violated that rule again. In all accounts.

Too much optimism on the bullish side and believe the US economy is doing so well that nothing bad can happen and that I can overcome any pullbacks. I kept opening more and more trades. And now I am in trouble.

I am not losing money extremely (not yet, but it still may happen) as I am still able to manage the trades, roll them, and adjust them. But I can see a danger of being overextended. My smaller accounts such as trading account and ROTH are showing a distress. I have trades deep in the money but no means to roll them as I am overextended. And that forces me to close the trades for a loss.

So, it is time to adjust my strategy on money management. I pretty much stopped trading these two accounts and will be saving more money until I reach a level when trading is easy and comfortable. On the IRA account I need to stick to my rules harder and keep eliminating over trading.
 

What I will be doing from now on?
 

In the IRA account:
 

1) We open only one weekly trade at a time with Friday expiration. A new trade can be opened only when the old trade closes. If the old trade is rolled into the next expiration and not closed a new trade will not be opened. You can follow the trades in our Facebook page.

2) We open up to two 45 DTE trades but with different time to expiration. We will be creating a ladder. This was our old theory we started doing a few years ago but abandoned and never finished. This means, we will open a 45 DTE expiration trade one week and then a second 45 DTE next week.

3) After a trade is open we immediately place a closing GTC (good till cancelled) trade for 50% profit.

4) We open a new 45 DTE trade only when the old trade is closed. If an old trade is rolled or otherwise kept open no new trade can be opened.

5) A new additional 45 DTE (above 2 contracts mentioned above) trade can be added only when BP is higher than the cash management limit allowed.

6) We will keep managing old open trades already in the account to close them successfully as winners.


In the ROTH account:
 

1) There will be no new trading in this account. Only managing old open trades. and saving more cash for trading.


In the TD account:
 

1) There will be no new trading in this account. Only managing old open trades. and saving more cash for trading.
 

It is really time to stop the madness and reckless trading I did sometimes in my accounts and bring it back to boring strategy and discipline.
 

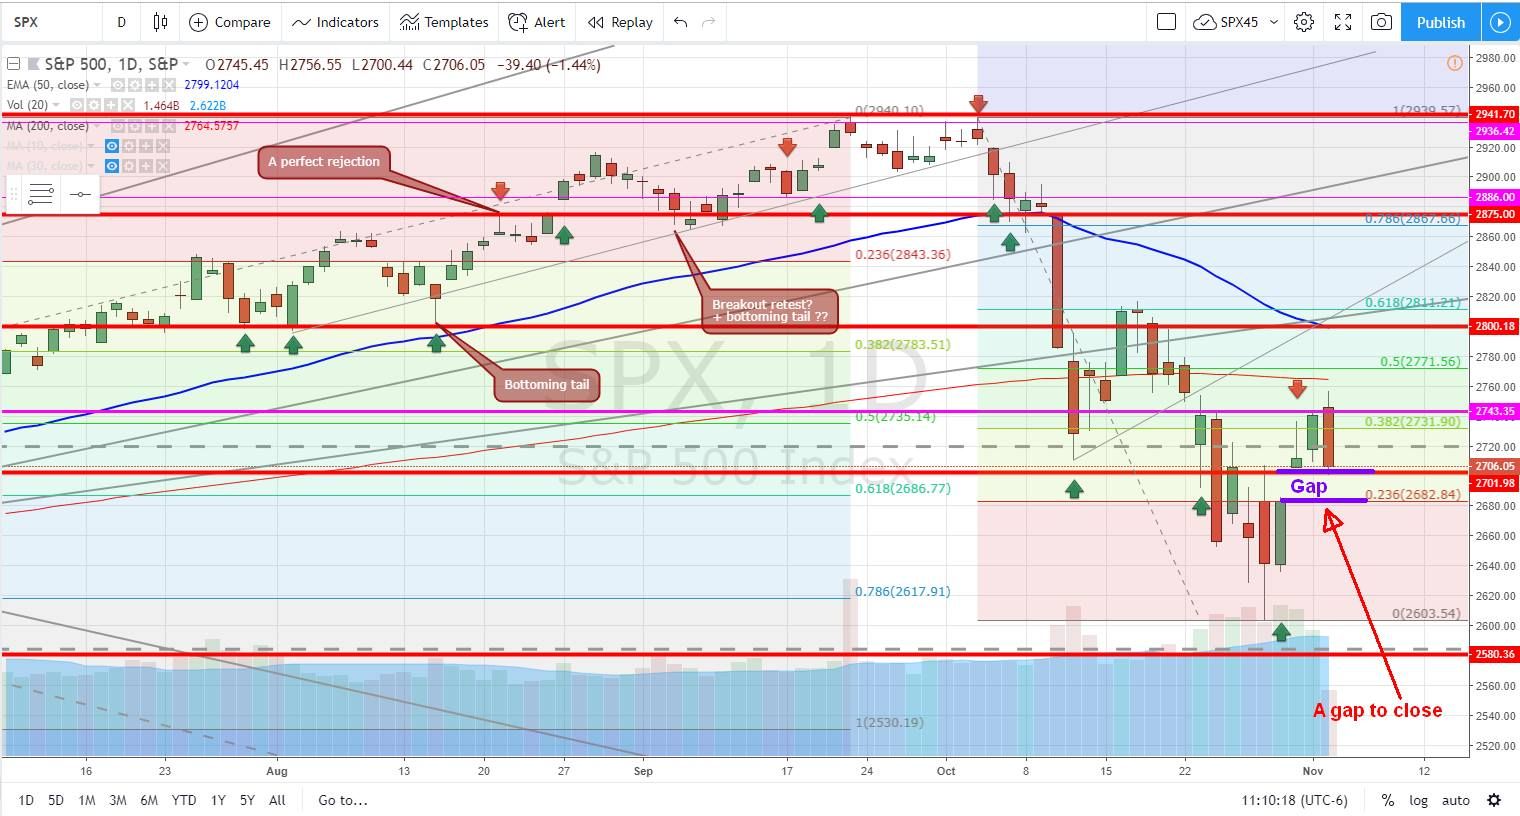
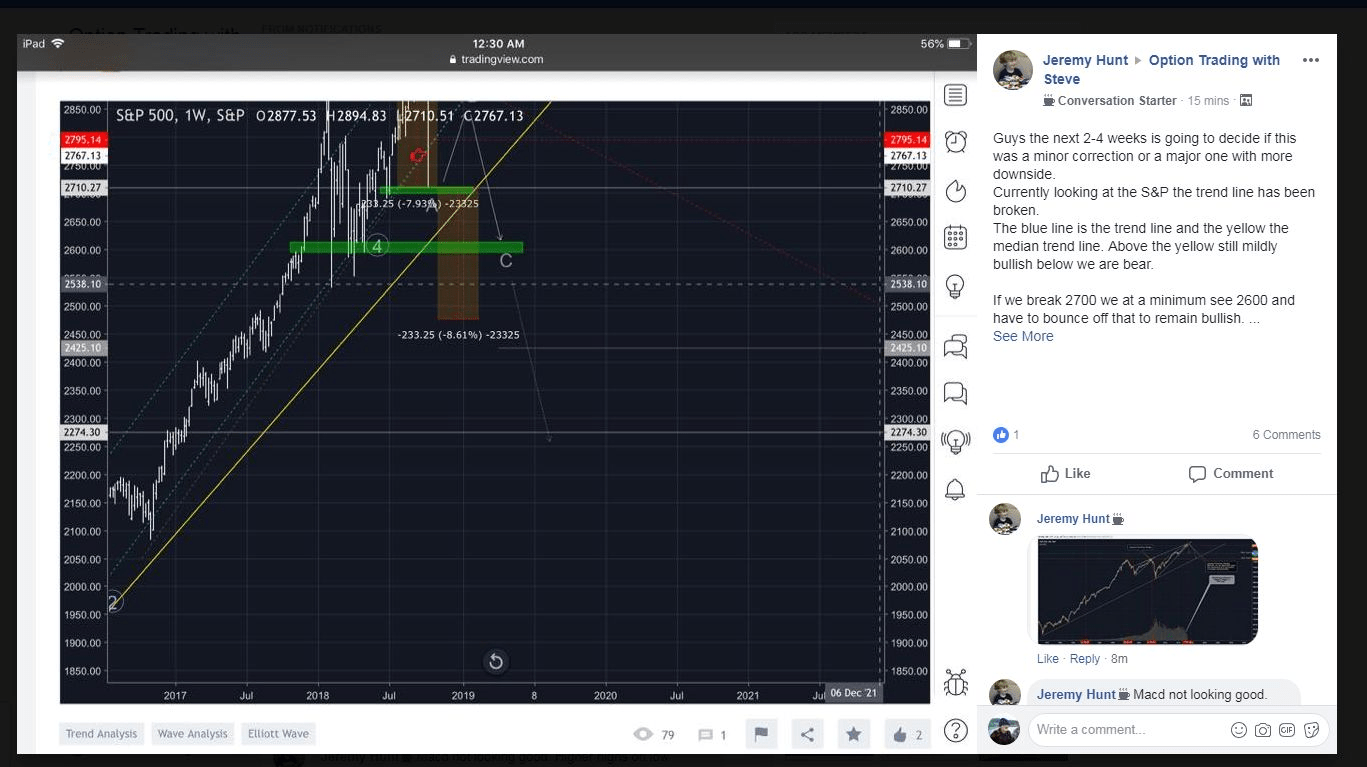
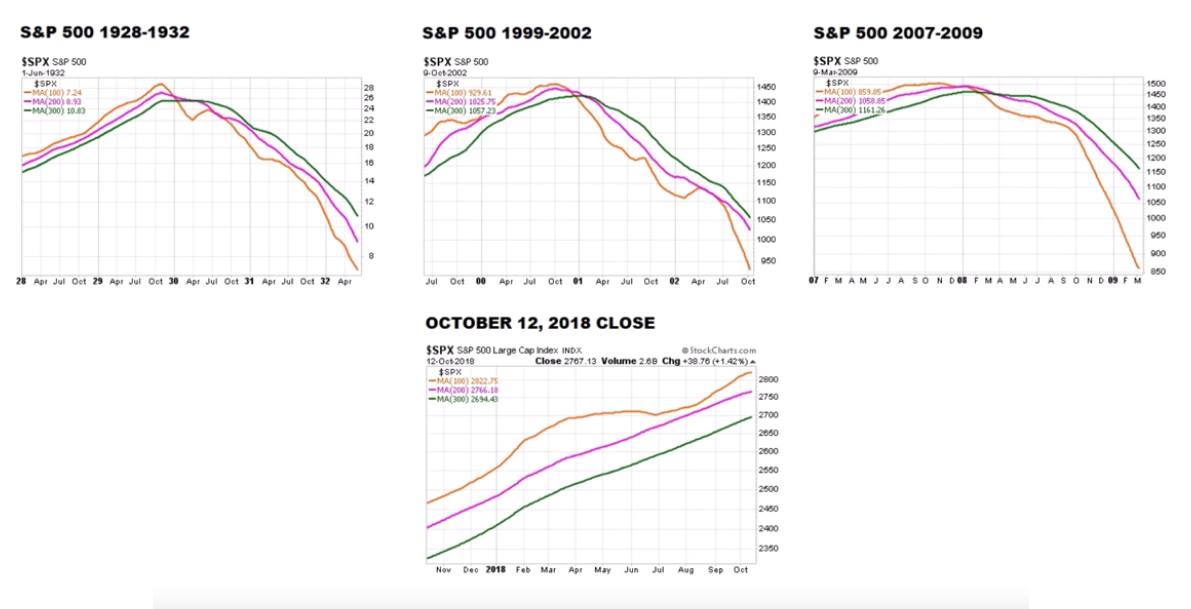
The stock market has been volatile as it was sending a message to FED to ease the rates amid global economy (and the US among it) slowdown. and Powell seemed to deliver that message last week. The market rallied and broke the downtrend.

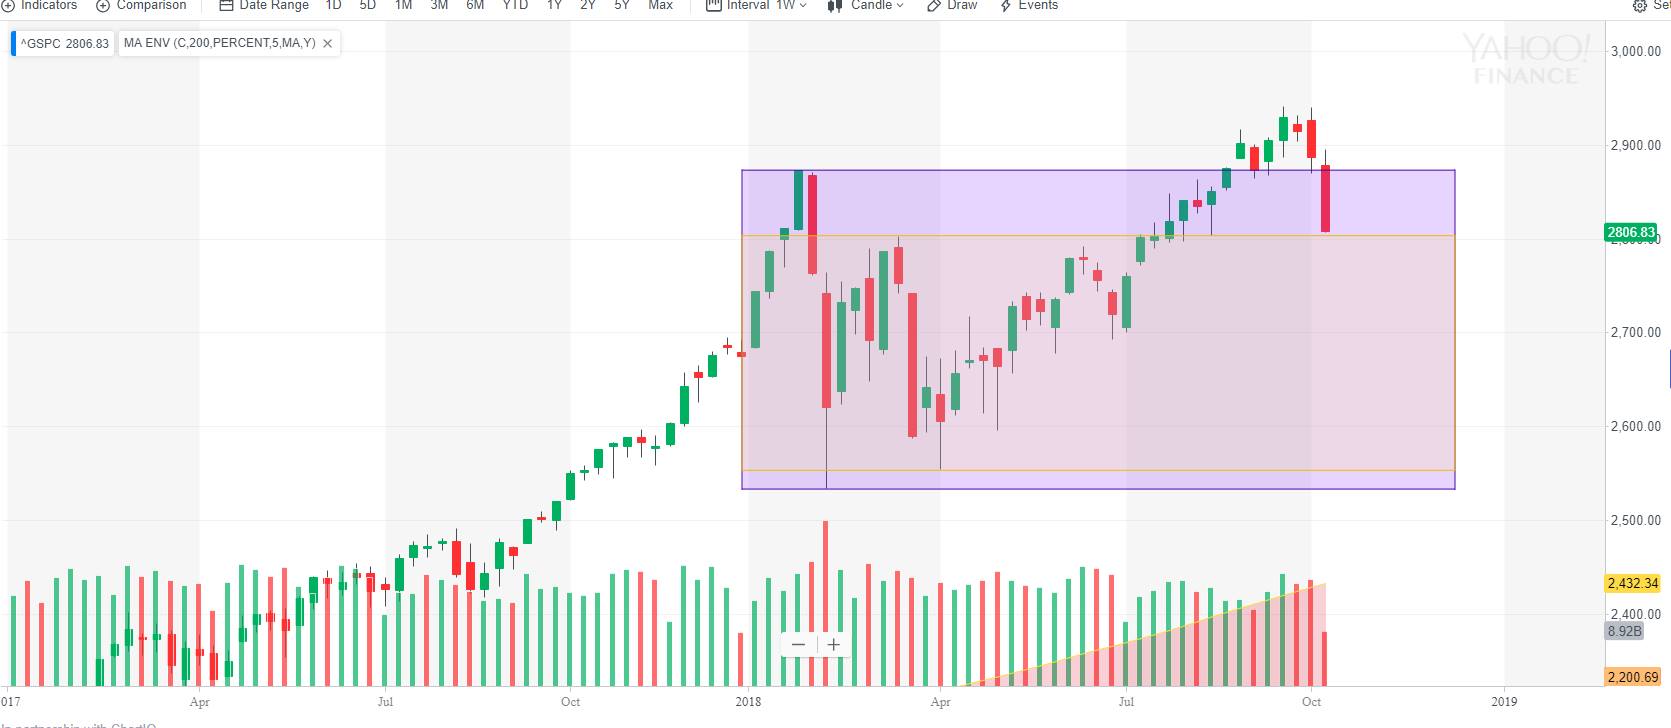
It created a double bottom also. That provided the needed boost to break the pessimism:

 
Trading Results
 

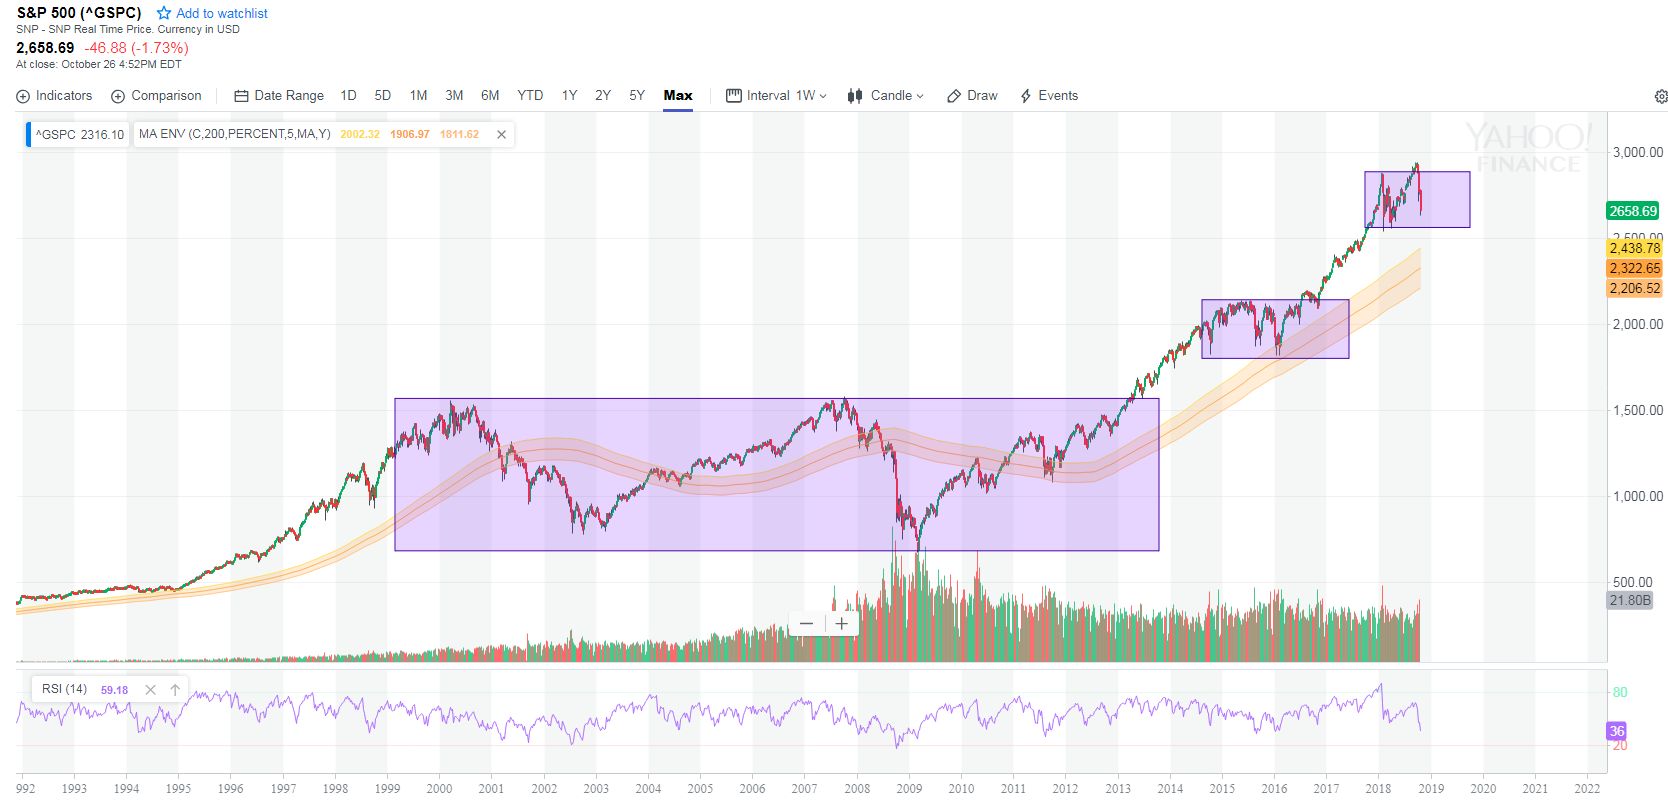
But we are heading toward a strong resistance at 2800 – 2820 level. We are not there yet so we may see some more buying conviction pushing this market up – unless Trump destroys it all at the G20 meeting with the Chinese President. If Trump escalates his trade war which is already damaging the US economy – farmers, automakers and others as exports to China dropped significantly when Chinese decided to stop buying from the US and looking at another sources such as Canada, India, Russia, or South American countries.
 

There is more to all this mess Trump has created and many decided to either ignore it or even foolishly defend it. But let’s see how all this ends.

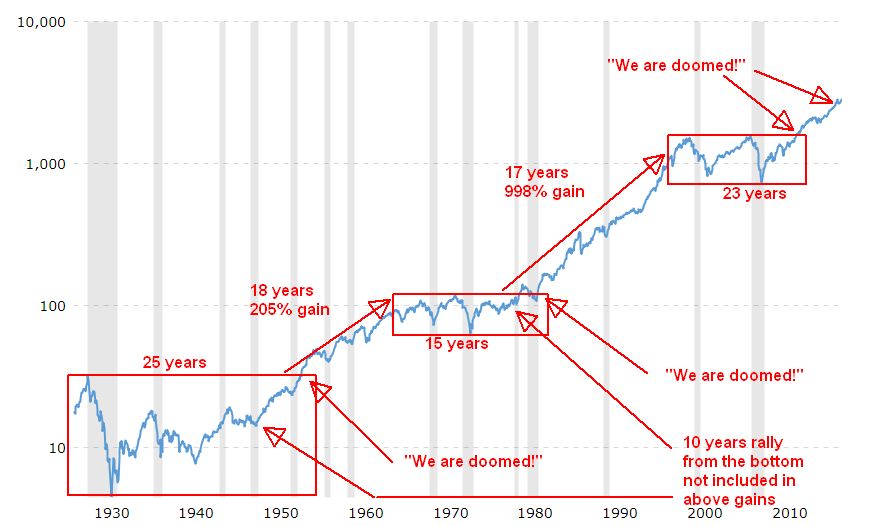
A positive note can be that history shows that whenever FED stopped raising interest rates, the market rallied. Let’s hope it will play that way too this time despite a lot of damage from Trump.
 

In November, we were mostly adjusting our trades to make sure majority of them would be positioned well for their upcoming expiration. We had many Iron Condors on SPX with puts deep in the money. Thus we rolled those Condors lower to be not too deep in the money. We are still bullish, so we didn’t want to roll those Condors too low to avoid calls being in trouble once the market really rebounds and start rallying.

We also had many spreads and Iron Condors using stocks as underlying but in this volatile market with a lot of whipsaw price action we needed to avoid getting our stock positions in the money and have them early assigned. We had SPY early assigned last week and lost money. We didn’t want that to happen to all of our stock options trades.

In November our income was however small, smaller than expected, as we mostly waited and didn’t trade too much. We expect this trend to continue in December trading only a few trades and managing the old ones. a large portion of income was also consumed by closing the old trades earlier than what we normally do.

 
Trading Results
 

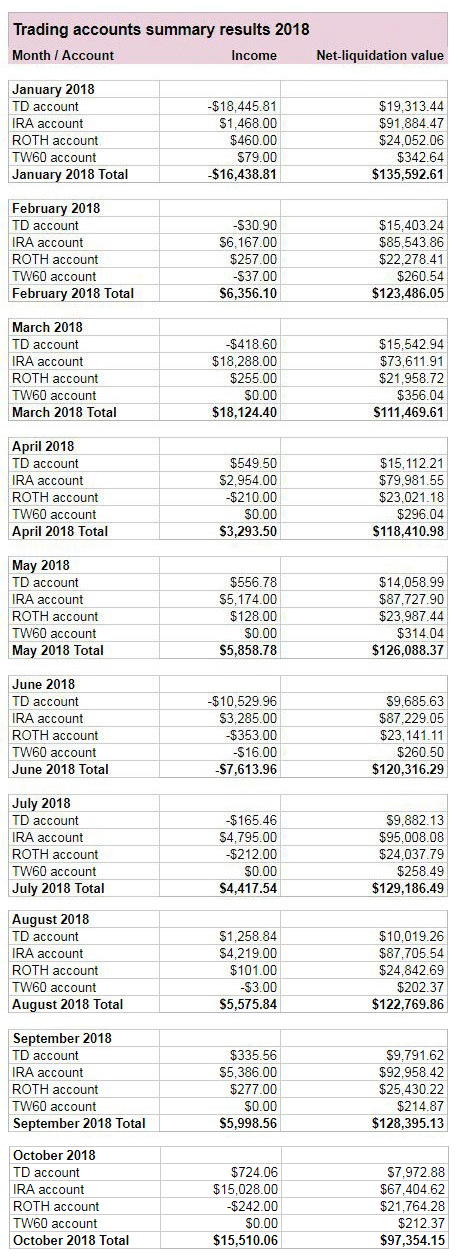
in November 2018 we lost $502.89 and our Net-liq of all accounts dropped by $2,044.05.

We post our trades on our Facebook page.


Here are the entire 2018 year trading results:

 
Trading Results


 · Dividend stock investing


Dividend investing is doing great on both accounts – ROTH and IRA. We keep using 50% of all options income and buy dividend stocks. IRA account keeps growing fast with new stocks being purchased every month. ROTH is more or less stagnant.


Here is a review of our accounts stock holdings:

 
Traditional IRA
Trading Results
 

ROTH IRA
Trading Results
 

TD account
Trading Results
 

In August we purchased the following shares:

 
IRA purchases:
Dividend growth stocks
 

We haven’t purchase any shares in ROTH or TD this month.
 

We keep spending 50% of our options trading proceeds to buy good dividend growth stocks using our screener to get a better entry into the stocks. Although capital appreciation is not our goal but a secondary target, timing the entry creates good results as our positions are mostly up. However, do not be too excited, any large selloff can temporarily send those stocks down again. It is a dividend income what matters to our portfolios, not the portfolio value and capital appreciation. It seems to be evident that using options to grow the portfolio is the right way to do.


 · Dividend Income


IRA dividend income
Trading Results
 

ROTH IRA dividend income
Trading Results


We all want to hear your opinion on the article above:
No Comments


Posted by Martin December 01, 2018
No Comments


Adding another SPX Jan11 (43 DTE) Iron Condor


We all want to hear your opinion on the article above:
No Comments


Posted by Martin November 30, 2018
No Comments


All is good at Wall Street again, until it isn’t


We can say that today, we got a breakout and confirmation of an uptrend.

On Wednesday we saw a nice rally, on Thursday, the indecision candle worked as a pause and today we broke the downtrend.

It was crucial that we got above the downtrend line today to keep the correction recovery on the way. If we didn’t break out today, we would be doomed for more selling.

However, we have a very strong resistance at 2800 – 2820 level which we need to break in order to continue higher. If we don’t this market could end up in a range bound trading bouncing off of 2820 back down to 2630 lows.

All now depends on G20 weekend if more buyers full of optimism over the Trump’s trade war and tariffs will be willing to step in on Monday and start frantically buying back everything what they have been selling for last couple of months. Time will show.
 

S&P Trend


We all want to hear your opinion on the article above:
No Comments


Posted by Martin November 30, 2018
No Comments


Tracking our options trades again so you can follow them…


We tracked our trades in the past but soon we had so many trades that tracking them became a tedious and time consuming effort. So we stopped.

A few days ago we adjusted our trading strategy a bit to still trade often but in a organized way so we could track those trades better.

So we resumed our records tracking:


We all want to hear your opinion on the article above:
No Comments


Posted by Martin November 29, 2018
No Comments


Adding a longer term SPX Iron Condor Jan11


We all want to hear your opinion on the article above:
No Comments


Posted by Martin November 04, 2018
No Comments


October 2018 trading and investing results


S&P 500  2,723.06 -17.31(-0.63%)  Dow 30  25,270.83 -109.91(-0.43%)  Nasdaq  7,356.99 -77.06(-1.04%)
 

September results

October was a terrific as well as horrible month! Tons of volatility, negativity, pessimism and losses. At some point, it became depressive. The markets kept falling and falling with no retreat, no relief rallies. Any attempt to have a rally was immediately sold off and it faded.

Is this the beginning of an end?

Many have asked this question and many predicted more selling more bear market to come.

But we do not know what is going to happen. if you see all the predictors predicting this market to rally to the moon, others predicting gloom and doom, do not trust either of them. They do not know. They are just guessing.

No one knows where the markets will go. There is a lot of uncertainty and we may really crash into a bear market or resume a rally.

Last week the markets rebounded from the October selloff but we created a gap up. Most gaps, if not all, get closed at some point:

 
Trading Results
 

There are runaway gaps but these are fairly rare. Thus next week we may expect the market to actually go lower to close the gap.

We also have election on Tuesday and the results may also affect the market behavior next week.

Historically, the markets rallied after the midterm election. We may see the same happening this year too. But we will know for sure once the market reveals its direction.
 

In October, we were mostly adjusting our trades to make sure majority of them would be positioned well for their upcoming expiration. We had many Iron Condors on SPX with puts deep in the money. Thus we rolled those Condors lower to be not too deep in the money. We are still bullish, so we didn’t want to roll those Condors too low to avoid calls being in trouble once and IF the market really rebounds and start rallying.

We also had many spreads and Iron Condors using stocks as underlying but in this volatile market with a lot of whipsaw price action we needed to avoid getting our stock positions in the money and have them early assigned. We had SPY early assigned last week and lost money. We didn’t want that to happen to all of our stock options trades.

Thus we rolled most of our stock options into SPX options. The reason behind is that with SPX there is no risk of early assignment and in this zig-zag price action I can let either side of any Condor to get in the money without a fear of early assignment. And with any breached side I can wait until literally five minutes before end of a trading session to see if the breached side recovers or I need to roll it into another expiration. You won’t be able to do this with stock options.

Rolling our trades delivered nice premiums income, unfortunately, it didn’t end those trades and thus they stay open and consume net-liq of our accounts. And due to October selloff and many puts still in the money, our net-liq got smashed hard in October. But we see this as not the end of the world. I am optimistic and I will keep rolling those puts as long as they end up out of the money and expire worthless.

 
This is reflected in our end of the month trading results. As you can see, our net-liq ended down a lot while our income jumped up by more than $15,000 dollars in October:

 
Trading Results
 

We made $1,207.00 income last week and the Net-liq of all accounts increased by $4,368.16. But overall, October ended with a nice $15,510.06 dollars premiums while Net-liq finished down by $31,040.98 dollars.

We post our trades on our Facebook page and we also post (or try to post when I have time to do so) our end of day trading results.


Here are the entire 2018 year trading results:

 
Trading Results


 · Dividend stock investing


Dividend investing is doing great on both accounts – ROTH and IRA. I keep using 50% of all options income and buy dividend stocks. IRA account keeps growing fast with new stocks being purchased every month. ROTH is more or less stagnant.


Here is a review of our accounts stock holdings:

 
Traditional IRA
Trading Results
 

ROTH IRA
Trading Results
 

TD account
Trading Results
 

In August we purchased the following shares:

 
IRA purchases:
Dividend growth stocks
 

We haven’t purchase any shares in ROTH or TD this month.
 

We keep spending 50% of our options trading proceeds to buy good dividend growth stocks using our screener to get a better entry into the stocks. Although capital appreciation is not our goal but a secondary target, timing the entry creates good results as our positions are mostly up. However, do not be too excited, any large selloff can temporarily send those stocks down again. It is a dividend income what matters to our portfolios, not the portfolio value and capital appreciation. It seems to be evident that using options to grow the portfolio is the right way to do.


 · Dividend Income


IRA dividend income
Trading Results
 

ROTH IRA dividend income
Trading Results


We all want to hear your opinion on the article above:
No Comments


Posted by Martin October 28, 2018
No Comments


Another beautiful selloff which didn’t fail


In my last post I wrote about my bullish view expecting the sell off to finally end and the market working on a reversal. The reason for it was a nice and expected bullish candle formed at the bottom of the expected range.

It didn’t last long and we saw additional over 3% selloff. The market got hurt badly. The damage is so severe that it is no longer obvious whether we are still bullish or at the beginning of a bear market.

It is now a failed breakout or at least it does look like it:

 
Trading Results
 

Can this failure be saved?

I hope so but I do not know. I do not know the future and do not want to predict it.

At the market and among the analysts, we now have two sides each saying a different thing. One camp says “we are rolling into a bear market”, the other “this is a typical October mid term selloff”. The rest of us is left waiting which one will it be.

Our economy seems to be still strong (as FED believes by raising the interest rates). But is it?

Would a market really crash in a strong economy? Or is this economy not strong, just an illusion which will crash in the next 6 months too?

Or is this market seeing a liquidity issue due to QT (quantitative Tightening)?
 

I still see the market:
 

long term (>5 years) = bullish
mid term = (1 – 5 years) = bullish
short term = (0 – 1 year) = 50/50 bullish/bearish
 

We just need to wait for the next outcome. No new trades on my part, just managing the old trades only.

Last week, the market went from bad to worse. This again resets my “correction” tracker increasing the level of this correction from 8.5% to 10.6%, 35 days length, and 2628 lows:

 
Trading Results
 

Last time, I said “If this was really the bottom, expect a recovery”, today, I am not sure which is it. Are we done with selling or is more selling to come?

We do not know.

This selloff took a significant toll on our account net liquidation value. It is because all our put trades are now in the money!

Yes, they are all at full loss.

Last week, we rolled our Iron Condors down (lower) lowering our in the money put spreads and offsetting the cost by lowering the calls too. This resulted in a nice credit income of over $6,000.00 dollars. But our net-liquidation value took $11,000 decline.

 
Trading Results
 

People think that my accounts and my trading is bad because my account is down. But it is down not because I took losses by closing my positions. It is down because our puts are in the money.

We keep our trades rolling so yes, at this moment we are closing old trades at a loss but we are opening new trades completely offsetting that loss by bringing in more credit and giving ourselves more time to recover. We are still bullish long term. And even if this market goes to a 20% or more correction (bear market), it still will not be a secular bear market! And even if it lasts 150 or 200 days to recover from 20% or 30% decline, we are OK to wait for recovery and keep adjusting our trades accordingly during that time.

 
Strategy for now?
 

1) As an option trader – I will wait. No new options trades but managing the open ones only. The market seems to be in a point of indecisiveness. It goes up and down violently and in my opinion difficult to trade safely. Thus I want the market to provide a direction first. Until then, I will be managing the old trades only.

2) As a dividend investor I will be taking advantage of the selloffs and buy more shares of dividend growth stocks.

 
Trading Results


We all want to hear your opinion on the article above:
No Comments


Posted by Martin October 23, 2018
No Comments


Another beautiful selloff which failed


Today, the market showed a spectacular rally and recovery from lows.

The futures sank by 1.40% and after the market opened we went even lower and undertaken the previous lows of 2711 level (losing over 2% at 2691 level resetting my correction tracker).

But then a spectacular rally happened.

 
Trading Results
 

As mentioned in a video in my yesterday’s post we did went below the previous lows, re-tested the correction lows, and then started seeing a hammer candle indicating exhaustion. All we need now is a confirmation and we will be moving up again.

This selloff was expected. For a few days after a bounce the market was signaling that we may re-test the lows or even go below. And it happened. And as it happened, big money came back and started buying. All we needed a flushout and a hammer candle to form.

Only, I didn’t expect it to happen in one day – today.

Tomorrow we may see some easy movement and possibly going lower again. Although, I wish this rally continue.

This resets my “correction” tracker increasing the level of this correction from 7.8% to 8.5%, 32 days length, and 2691 lows.

 
Trading Results
 

If this was really the bottom, expect a recovery.

 
However, despite buyers coming back and pushing this market up we had an SPX Condor expiring tomorrow. The put side got so deep in the money that I didn’t expect recovery by tomorrow’s end of trading so I decided to roll the condor away. I closed almost worthless call side, rolled the put side, and sold new call side to offset the cost. This trade was a wash (debit was fully offset by a new credit, see the last three groups of trades).

 
Trading Results
 

Then we also had TESLA trades. The Citron group announced being bullish on TSLA and the stock rallied hard. My calls got busted so I had to roll them. I rolled the entire Condor higher and reversed a few calls into puts. Still, TESLA will be a pain in the neck and I am planning on reversing those trades into SPX Condors (I did one trade reversal though, today).

 
Trading Results
 

Trading Results
 

Trading Results
 

Today’s overall trade balance: +$1,216.00 credit


We all want to hear your opinion on the article above:
No Comments


Posted by Martin October 14, 2018
No Comments


Correction not bear market


It is funny watching people panicking about last week market decline.

Many panic and predict bear market. Many are guessing what happens next. Some are drawing their charts drawing lines of the next decline and claiming historicity of their claim.

 
Predictors
 

Claiming historical evidence and predicting the drop all the way down to 2275 indicates more a lack of studying the history than knowing history.

And ignoring broader context.

Bear markets don’t come in 2 days

Bear markets really do not start in a week or 2 days of a sharp drop. Drops are usually smaller not so violent and they are preceded by other warning signs. This market dropped suddenly and violently. Even the “we know all” media were baffled and guessing what may have caused such drop.

The bear markets are preceded by other signs which would warn you in time that bear market is coming: raising interest rates, declining corporate profits, and investors’ optimism.”

Although FED is raising rates, they are still historically low. In December 2007 interest rates were almost 5%, today, the rates are at 2.5%.

Corporate profits are raising with no sign of slowing. And investors’ optimism? They are spooked by any flow of a breeze out there. The amount of bearishness is outstanding. Many people are still sitting aside in cash, spooked by never ending predictions of bear market coming “tomorrow”. According to AAII 63% of regular investors are neutral to bearish. Only about 35% are bullish.

Add to it fear of valuation, trade war, political comments of the President, FED intervention, and fear of slow down in China, Italy, Greece, Egypt and others. The markets do not turn bear upon fears. Corrections? Yes, they do.

Fundamentally, this bear market is not showing signs of being rolling over.

Technically, this market is not showing any signs of a rollover either.

Look at the following charts with simple moving averages from 1930, 2000, and 2007, in comparison with 2018. Do they look same or similar?

 
technical analysis
 

If you think that they are same then yes, the bear market is coming!

But you may also need to visit an optometrist.

Some spooked investors claimed that we cannot compare long term trends with short term time frames. But the long term time frames determine the short term.

If the long term indicates that we are in a cyclical bullish trend, and in fact, we broke from a long term consolidation (24 year long) in 2016, we are more likely to see a growth than another bear market:

 
technical analysis
 

If you know in what cycle the market is you may rest calm about any corrections or short term bear markets. I recommend watching a video made by Chris Ciovacco analizing the market from a distance. This definitely helps not to panic and stay the course when selling like this happens:


Corrections are healthy and needed for the stock market to go higher. There is no need to panic. However, there is a need to watch the market because although fundamental and technical reasons for this bullish market hasn’t changed it may change any day. and it will change for sure. But be assured that you will be able to react to the change. The rollover of the market is a process and it takes days and months before you see the market making bearish moves. Last week’s movement wasn’t it, yet.


We all want to hear your opinion on the article above:
No Comments


Posted by Martin October 11, 2018
No Comments


Gut wrenching volatility


A volatility in the stock markets is normal. It is a part of it. When looking in the rear mirror and see all those drops we think: “it is all OK and normal.”

But experiencing such volatility in real time is painful and… gut wrenching.

Many people can’t take the pain. I must admit, I too feel sick to the bottom of my stomach when my own cash is involved in this market which is eating it up. But I keep saying myself: volatility is normal, volatility happens. It must happen.

And when it happens we panic. And sell and run away.

I have experienced investors in our group who couldn’t take it and bailed out.

For the last 7 days the stock market was in a selling mode. First few days were slow and markets rallied at the end of the trading session. It didn’t recover the losses though, just rallied, creating nice tails. At first it looked like we had a small dip.

But last two days – Wednesday, October 10, the market lost the support and tanked hard. It lost 94 point or -3.36%!! On Thursday, October 11th the market again looked like it might recover. In the afternoon, selling sped up and S&P lost another -2.06% !!

 
S&P 500 correction
 

At first, I expected the market to honor a support at 2875, which was January high, the market smashed below. I expected it to honor another support at 2801 level. It didn’t hold.

 
S&P 500 correction
 

The 50% Fibonacci retracement at 2745. The market breached that level today.

 
S&P 500 correction
 

The selling was sharp and ugly.

What to do when the market sells off like this?

There are two types of volatility out there: volatility to ignore and volatility to respect.

In order to know what to do, an investor needs to step away from day to day charts and look at higher time frames. And doing so today, you will see that we are clearly in a secular bull market.

If you think that this selling is the beginning of a bear market then know that bear markets never happen in two days, bear market sneaks in slowly before it hits hard and it takes for a long time of selling, not just 7 days. Knowing that we are in a long term secular market and knowing that we just saw 7 days of selling will help you determine whether to ignore or respect today’s volatility.

As a stock investor, knowing that this is just a retracement, an expected correction, you do nothing! Stay calm, hold your stocks, and buy more shares! This is a gut wrenching volatility for sure but not a roll over to a bear market. Not yet!

As an option trader, it is a bit more complicated. Options are instruments which have limited life time. They expire. You do not want to get caught deep in the money at expiration or be assigned early. Then close the trade or roll it. I prefer rolling it. Roll it far away and sell offsetting calls, or keep selling calls to collect as much premium as possible.

With corrections like this, you want to move your options far away to give the market time to repair and eventually the price will come to your puts and you will be safe again.

The following table shows all corrections since 2009 lows. They happen, they may be ugly, but they eventually recover. Some sooner, some take longer:

 
S&P 500 correction
 

Also, note May 2, 2011 to October 4, 2011 drop. The market declined -21.6% during that period of time. By definition, a 20% drop in stock prices indicates the market to be in a bear market!

So, if someone will be telling you that this bull market is the longest bull in history, lasting more than a decade, then that person is ignorant. We had a bear market in 2011. So this bull market is only approximately 7 years old. It still can last another 10 years. With gut wrenching volatility.


We all want to hear your opinion on the article above:
No Comments


This site has been fine-tuned by 14 WordPress Tweaks