Weekly Newsletter   Challenge account   Weekly Newsletter   


Posted by Martin September 18, 2022
No Comments


2022 SPX put credit spreads trading review – week 37


Last week was brutal. SPX lost over 4.7% and many of our SPX trades that were bullish are underwater again. I reversed trading to credit call spreads instead and try to manage the open trades by rolling them away and waiting for a better opportunity to manage them. It will be a long process.
 

We rolled one box trade away (that delivered nice credit, hope we will manage to keep it in the end). We also traded CCS (credit call spread) spreads. Those trades delivered a $1,685.00 gain. That brought our account up by +5.34% while SPX lost -4.77%.
 

Our SPX account is up +822.97% since the beginning of this program, and we have $37,594 in unrealized gains.


Initial SPX trade set ups


For the SPX strategy, I dedicated a $3,600 initial amount that will be used to trade SPX PCS strategy per week. Today, the account is up at $33,226.95. However, due to the recent bear market, many trades are still tight to open trades which need to expire to release the funds.
 

WHAT WILL WE TRADE?    
DAY DTE TYPE
MONDAY 7 DTE & 40 delta 10 wide Put Credit Spread
TUESDAY 30 DTE & 40 delta 10 wide Put Credit Spread
WEDNESDAY 7 DTE & 40 delta 10 wide Put Credit Spread
FRIDAY 60 DTE & 14 delta 10 wide Put Credit Spread
EVERY MONTH 120 DTE Put Debit Spread – HEDGE


Our SPX strategy is designed as directional options trading. We are selling credit put spreads to collect premiums, and hopefully, these spreads expire worthlessly, or we repurchase them for a small debit.

We use a set of indicators (primarily based on moving averages and volume profiles) and market sentiment that generates bullish signals. The trading is based on a “trend following strategy.” We open the trade if we have a bullish signal and a bullish trend. If we do not have a signal, we stay away.

We set the set of rules and alerts and backtested them. The backtesting software proved that the strategy was viable and returned good gains. We also tried to automate the decision-making as much as possible to have the trading as mechanical as possible. This helps eliminate our emotions. The decision-making was reduced to: “bullish signal present” – open a trade, “not present” – stay away. It worked well.

Here you can see all our trades:

 
SPX PCS account value
Click on the picture above to see the entire list.
 

We do not trade 0 DTE trades although we may shorten the DTE if needed. This strategy is designed to be as passive as possible. You open a trade and let it run. You do not need to be glued to the computer all the time. The strategy takes advantage of the market’s historical behavior of mainly going up. Yes, there will be selloffs and corrections, even bear markets, but over time, it goes up. And therefore, our strategy is designed for this direction. The premise is that if we have a bullish trend, we open a bullish spread and let it run. 80% or 90% of the time, it will be a winning trade. And if the trend is strong, we open more aggressive trades (which is not the case today due to the market’s correction).

How much money can you trade?

As you can see in the table below, the highest amount of cash to trade this strategy is $19,995.00. That will allow adjustments, rolls, and comfortable trading without blowing your account. Can you trade less? Well, yes, I started with a $3,600 initial amount. But you need to be selective. You won’t trade all trades. You just trade the safest trades only (which is the Friday trade), especially in this market, and when the market gets out of this mess, you can start adding trades. And you do not compound. You must wait for the actual trade to end before opening a new trade. This way, the growth will be a lot slower, and you collect less credit, but you do not blow your account, mainly when you need to roll. You do not have money to do that (as the old busted trade will need more buying power which can be reduced by adding an offsetting trade that neutralizes the old trade, but you still will need that initial buying power).


Last week trading


Overall, the strategy resulted in a +822.97% gain last week.
 

Initial account value (since inception: 12/07/2021): $3,600.00
Last week beginning value: $31,541.95
Last week ending value: $33,226.95 (+5.34%; total: +822.97%)
The highest capital requirements to trade this strategy: $19,995
Current capital at risk: -$4,594
Unrealized Gain: $37,594 (-818.33%)
Realized Gain: -$7,073 (153.96%)
Total Gain: $30,521 (-664.37%)
Win Ratio: 55%
Average Winner: $325
Average Loser: $496


SPX PCS account value
 

SPX PCS account vs SPX
SPX PCS account vs SPX index net liq
 

SPX PCS account vs SPX
SPX PCS account vs SPX index
 

If you want to receive trade alerts whenever we open a new SPX put credit spread or a hedge trade, you can subscribe to our service:


Note, if you wish to subscribe to multiple levels, you can do so by subscribing to one level only and then sending us an email that you want to be added to other levels too.

Also, if you like this report, hit the like button so I know there is enough audience wanting to see this type of report. If you have any questions or want to see anything else about my SPX trading, do not hesitate to contact me or write a comment in the comments section. Thank you!


We all want to hear your opinion on the article above:
No Comments


Posted by Martin September 14, 2022
No Comments


Markets puked yesterday, what’s next?


The adage says that past performance is not a guarantee of future results or something like that. But the markets still follow certain patterns that tend to repeat. It is because the markets express human behavior and psychology. Even the algos that react to the events express the humans. Only much faster. They, too, are programmed by humans to do what humans would do.

Yesterday, we saw a big fall. The markets fell over 4%, which doesn’t happen every day. And if we accept that the markets do trade in certain patterns, we can look into markets’ seasonality from the past to see what may happen next. It is not guaranteed to happen, but it may give a clue of what the market participants may do next based on what the past market participants did before us.

 
markets in almanac
 

According to history, we may see positive trading after the 4% decline. S&P 500 has declined 4% or more in a single day 53 times before yesterday since 1950. The next trading day S&P was higher 35 times and lower 18. The average gain of 1.08% occurred on all up days. Based on historical performance, the odds of a gain today are 66.04%.


We all want to hear your opinion on the article above:
No Comments


Posted by Martin September 13, 2022
No Comments


Markets puked, should you buy tech stocks?


The markets overreacted to a 0.1% inflation miss and sold off by 4.41% (S&P500, the NASDAQ was even worse: -5.67%). Should we be worried? Will the markets continue down? And is this a good opportunity to buy non-dividend stocks? I like to buy dividend stocks because I get paid while waiting for the stock price appreciation. But what will you get with a stock that doesn’t pay dividends? If you bought a stock like Netflix (NFLX), Snowflake (SNOW), or PayPal (PYPL) when they were trading at their highest valuations and didn’t sell before they slid, you are sitting on significant losses, and it may take years to recover. And what if you buy now and the stock goes even lower? What do you get?
 

Will the markets continue selling?

 
That’s a good question. I would say yes. The selling gained very strong momentum. In the morning, it was selling down 2%, but the selling got stronger by the end of the trading session. See the chart below. As the price volume indicates, the most volume occurred at 3,980. We then sold off to as low as 3,927, which corresponds with the previous week’s POC. We bounced there. But will it be enough?

 
markets crashing after CPI
 

We also stopped at the previous lower upward sloping trend line:

 
markets at the support
 

I doubt this support will hold, at least not soon. Today’s investors are primarily idiots, and they freak out about something that was widely known, widely expected, and trumpeted to the world before. So we may see some more selling. We may see a bounce, too, before more selling. Technically, this is damage that will take time to repair.

But it is mostly the weak hands selling. The smart guys are buying because this situation will not last long. It may persist another year when the markets will be depressed, but that’s it. The bear markets do not last forever. The longest bear takes up to three years, and then it goes higher again.

And even if we go to the “difficult” or “lost decade” type of market, if you invest strategically, you will do well too.
 

Should you be buying non dividend stocks in these whacky markets?

 
This brings a question of how you should invest in the markets like this. You should not be selling, that is for sure. Today, many young inexperienced investors are used to investing for a quick buck. They want to buy high-flying meme stocks, ideally using options, make thousands, if not millions, and get out. It may have worked in 2020 and 2021, but today, they are getting slammed. But you should be doing the exact opposite.

 
millennials out of the markets
 

Buying dividend stocks is a no-brainer. In the markets like today, the stock price gets slammed when everyone panics, but you do not care because you still get paid. Every three months or even monthly, you get paid your dividends. But what about non-dividend stocks like Google (GOOGL), PayPal (PYPL), Netflix (NFLX), T-mobile (TMUS), and many others? They are very good quality stocks. They are just getting slammed because everyone thinks they are no longer alive (yes, the funeral service is this Saturday).

I still think this is the best time to buy these stocks. Even if they are not on the bottom, it is still a good time to add a few shares today. Then wait a few weeks or months and add again.
 

What happens if you do so?
 

1) The stock stays where it is for many months or years. Or they may never recover to their previous highs (like Netflix going back to $700 a share). Well, then use the position as a cash-generating vehicle. Sell covered calls every month against that position and collect your dividends. If you keep doing this for the next 30 years, you will generate income that can be reinvested or spent.

2) The stock starts recovering and moving back to its previous highs. Then use the position as your cash-generating vehicle and sell covered calls and puts (strangle). Puts will help you roll the calls should the stock move too fast. Make sure you have enough cash to cover the puts in case the stock tanks and you get assigned.
 

I always use this strategy, which helps me generate up to $10,000 cash every month. Sometimes, it is hard to manage the position in volatile markets, sometimes, I cannot take the cash out as the open margin requirements collateralize it, but in the end, it pays off. And it is easy to do. All you need to do is to learn how to do it, gain confidence and execute the plan. But mainly, do not panic during markets like this one. Do the exact opposite of what everybody does. In the end, you will be the winner.


We all want to hear your opinion on the article above:
No Comments


Posted by Martin September 11, 2022
No Comments


2022 Week 36 investing and trading report


As a week ago was a disaster for our trading and investing, it all changed on a dime last week, and we recovered all paper losses. Nevertheless, I was not trading last week. I only adjusted a few trades to bring them a bit in line with the stock price (that adjustment delivered credit), but other than that, I was staying out and just watching what was going on out there.
 

Last week my net-liq value, cash, and buying power improved. Both metrics went up. That is good. If this continues, I will be able to open more trades:

 
Cash - Net-Liq - BP 36
 

Our trading delivered +$653.00 premiums last week ending September 2022 at +$586.00 (+0.81%) options income. Our net-liq value increased by +9.08% last week to $72,323.97 value, and our overall account is down -30.89% YTD.
 

Here is our investing and trading report:


Account Value: $72,323.97 +$6,566.21 +9.08%
Options trading results
Options Premiums Received: +$653.00    
01 January 2022 Options: +$8,885.00 +8.36%  
02 February 2022 Options: +$10,009.00 +10.34%  
03 March 2022 Options: -$1,662.00 -1.47%  
04 April 2022 Options: +$1,047.00 +1.19%  
05 May 2022 Options: +$8,604.00 +11.32%  
06 June 2022 Options: +$9,691.00 +13.73%  
07 July 2022 Options: +$8,717.00 +11.39%  
08 August 2022 Options: +$7,987.00 +12.15%  
09 September 2022 Options: +$586.00 +0.81%  
Options Premiums YTD: $53,864.00 +74.48%  
Dividend income results
Dividends Received: $23.60    
01 January 2022 Dividends: $303.38    
02 February 2022 Dividends: $732.81    
03 March 2022 Dividends: $393.74    
04 April 2022 Dividends: $337.31    
05 May 2022 Dividends: $343.99    
06 June 2022 Dividends: $445.80    
07 July 2022 Dividends: $367.66    
08 August 2022 Dividends: $683.58    
09 September 2022 Dividends: $140.03    
Dividends YTD: $3,748.30    
Portfolio Equity
Portfolio Equity: $170,554.50 +$6,700.61 +4.09%
Portfolio metrics
Portfolio Yield: 5.47%    
Portfolio Dividend Growth: 11.61%    
Ann. Div Income & YOC in 10 yrs: $68,149.30 37.90%  
Ann. Div Income & YOC in 20 yrs: $2,405,649.75 1,337.89%  
Ann. Div Income & YOC in 25 yrs: $46,164,602.49 25,674.29%  
Ann. Div Income & YOC in 30 yrs: $3,025,648,609.05 1,682,704.34%  
Portfolio Alpha: 69.04%    
Sharpe Ratio: 4.73 EXCELLENT  
Portfolio Weighted Beta: 0.49    
CAGR: 310.67%    
AROC: 51.99%    
TROC: 5.75%    
Our 2022 Goal
2022 Dividend Goal: $4,800.00 78.09% In Progress
2022 Portfolio Value Goal: $151,638.03 47.70% In Progress
6-year Portfolio Value Goal: $175,000.00 41.33% In Progress
10-year Portfolio Value Goal: $1,000,000.00 7.23% In Progress


Dividend Investing and Trading Report

 
Last week we have received $23.60 in dividends bringing our September’s dividend income at $140.03. That met my expectations.

Last week, we did not purchase any dividend stock.


Here is a chart of our account equity showing our accumulation goal and the value of all stocks in our account. It shows a nice upward-sloping chart as our equities grow. This is a result of our options trading and using premiums to buy dividend stocks:

 
Account Equity week 36
 

And here you can see the dividend income those equities pay us every year:

 
Annual Dividend Payout week 36


Growth stocks Investing and Trading Report


Last week, we purchased no growth stocks.


Options Investing and Trading Report

 
Last week I was just adjusting my existing options positions.

However, these adjustments delivered a gain of +$653.00 making our September options income +$586.00.


We were actively trading our SPX strategy that delivered -$25.00 loss.


Expected Future Dividend Income

 
We received $23.60 in dividends last week. Our portfolio currently yields 5.47% at $72,323.97 market value.

 
Our projected annual dividend income in 10 years is $68,149.30, but that projection is if we do absolutely nothing and let our positions grow without adding new positions or reinvesting the dividends.

We are also set to receive a $6,686.70 annual dividend income ($557.22 monthly income). We are 9.81% of our 10 year goal of $68,149.30 dividend income.

 
Future Divi on YOC week 36
 

The chart above shows how our future dividend income is based on the future yield on cost and what dividend income we may expect. The expected dividend growth depends on what stocks we add to our portfolio and the stocks’ 3 years’ average dividend growth rate. It is interesting to see what passive income we may enjoy 10, 20, 25, or 30 years from now.


Market value of our holdings

 
Our non-adjusted stock holdings market value increased from $163,853.89 to $170,554.50 last week.

In 2022 we plan on accumulating dividend stocks, monetizing these positions, HFEA strategy, and SPX trading. We plan to raise more of our holdings to 100 shares to sell covered calls. We continued rebalancing our options trades that released buying power significantly. That allowed us to start repurchasing shares of our interest.

 
Stock holdings trading week 36
 

We aim to accumulate 100 shares of dividend growth stocks we like and then start selling covered calls or strangles around those positions. We also planned on reinvesting all dividends back into those holdings.
 

Investing and trading ROI


Our options trading delivered a +0.81% monthly ROI in September 2022, totaling a 74.48% ROI YTD. If our options income stays at this level by the end of the year, we will exceed our 45% annual revenue goal in selling options against dividend stocks.

Our entire account is still down -30.89%.
 

Our options trading averaged $5,984.89 per month this year. If this trend continues, we will make $71,818.67 trading options in 2022. As of today, we have made $53,864.00 trading options.
 

Old SPX trades repair


We traded our SPX put credit spread strategy which you will be able to review in my next report. The SPX strategy has held well so far, and our signals kept us from opening new aggressive trades.


Investing and trading report in charts


Account Net-Liq


TW Account trading Net-Liq week 36
 

Account Stocks holding

 
TW Account holdings week 36
 

Last week, S&P 500 grew 40.61% since we opened our portfolio while our portfolio grew 19.02%. On YTD basis, the S&P 500 fell -24.16% and our portfolio -10.75%. This is an excellent result! We are significantly outperforming the market.

The numbers above apply to our stock holdings only. Our overall account net-liq is down by -30.89% this year.
 

Stock holdings Growth YTD

 
TW Account holdings Growth YTD
 

Our stock holdings are starting to outperform the market. Hopefully, this trend will stay, and we will constantly do better than S&P 500.
 

Our 10-year goal is to grow this account to $1,000,000.00 value in ten years. We are in year two and we accomplished 7.23% of that goal.
 

Our 6-year goal is to reach $175,000 account value to be eligible for portfolio margin (PM) and today we accomplished 41.33% of that goal.
 

Our 2022 year goal is to grow this account to a $151,638.03 and today we accomplished 47.70% of this goal.


Investing and Trading Report – Options Monthly Income

 
TW Options Trading Income week 36
 

Investing and Trading Report – Options Annual Income


TW Options Annual Trading Income week 36
 

Our dividend goal and future dividends


TW Received vs Projected Dividends week 36
 

We plan to make $4,800.00 in dividend income in 2022. As of today, we received $3,748.30. This is in line with our projected dividend 2022 goal. We also accumulated enough shares to start making $6,686.70 a year. Our monthly projected dividend income is $557.22, and our current monthly dividend income is $312.36.
 

TW Received vs Future Dividends week 36


I have a favor to ask. If you like this report, please, hit the like like button button so I know that there is enough audience that like this content. Also, if there is something you want to know or you want me to change this report to a different format, let me know in the comments section.


We all want to hear your opinion on the article above:
No Comments


Posted by Martin September 11, 2022
No Comments


2022 SPX put credit spreads trading review – week 36


Last week the market stopped at 3,900 support, reversed, and started going higher again. That was not good for our SPX trading as I was preparing for more selling opening credit call spreads. When the market reversed, I had to reverse the trades too. Last week, I had a “box” trade that was set to expire on September 9. I decided to let the trade go and let it expire without adjusting it. I will not be renewing the trade either.

I also had a credit call spread set to expire on September 2nd. The trade expired worthless for a full profit. We also have a trade expiring on September 12 that is currently in the money. I will try to roll it if the market doesn’t move up next week. It needs to move 40 points for the trade to end out of the money. I hope it will happen.
 

With the box-puts trade expiring in the money, I had a loss. The loss was just $10, so it had little impact on the overall account. The SPX trading delivered a -$25.00 loss. That brought our account up by -0.08% while SPX lost 3.65%.
 

Our SPX account is up +776.17% since the beginning of this program, and we have $37,694 in unrealized gains.


Initial trade set ups


For the SPX strategy, I dedicated a $3,600 initial amount that will be used to trade SPX PCS strategy per week. Today, the account is up at $31,541.95. However, due to the recent bear market, many trades are still tight to open trades which need to expire to release the funds.
 

WHAT WILL WE TRADE?    
DAY DTE TYPE
MONDAY 7 DTE & 40 delta 10 wide Put Credit Spread
TUESDAY 30 DTE & 40 delta 10 wide Put Credit Spread
WEDNESDAY 7 DTE & 40 delta 10 wide Put Credit Spread
FRIDAY 60 DTE & 14 delta 10 wide Put Credit Spread
EVERY MONTH 120 DTE Put Debit Spread – HEDGE


Our SPX strategy is designed as directional options trading. We are selling credit put spreads to collect premiums, and hopefully, these spreads expire worthlessly, or we repurchase them for a small debit.

We use a set of indicators (primarily based on moving averages and volume profiles) and market sentiment that generates bullish signals. The trading is based on a “trend following strategy.” We open the trade if we have a bullish signal and a bullish trend. If we do not have a signal, we stay away.

We set the set of rules and alerts and backtested them. The backtesting software proved that the strategy was viable and returned good gains. We also tried to automate the decision-making as much as possible to have the trading as mechanical as possible. This helps eliminate our emotions. The decision-making was reduced to: “bullish signal present” – open a trade, “not present” – stay away. It worked well.

Here you can see all our trades:

 
SPX PCS account value
Click on the picture above to see the entire list.
 

We do not trade 0 DTE trades although we may shorten the DTE if needed. This strategy is designed to be as passive as possible. You open a trade and let it run. You do not need to be glued to the computer all the time. The strategy takes advantage of the market’s historical behavior of mainly going up. Yes, there will be selloffs and corrections, even bear markets, but over time, it goes up. And therefore, our strategy is designed for this direction. The premise is that if we have a bullish trend, we open a bullish spread and let it run. 80% or 90% of the time, it will be a winning trade. And if the trend is strong, we open more aggressive trades (which is not the case today due to the market’s correction).

How much money can you trade?

As you can see in the table below, the highest amount of cash to trade this strategy is $19,995.00. That will allow adjustments, rolls, and comfortable trading without blowing your account. Can you trade less? Well, yes, I started with a $3,600 initial amount. But you need to be selective. You won’t trade all trades. You just trade the safest trades only (which is the Friday trade), especially in this market, and when the market gets out of this mess, you can start adding trades. And you do not compound. You must wait for the actual trade to end before opening a new trade. This way, the growth will be a lot slower, and you collect less credit, but you do not blow your account, mainly when you need to roll. You do not have money to do that (as the old busted trade will need more buying power which can be reduced by adding an offsetting trade that neutralizes the old trade, but you still will need that initial buying power).


Last week trading


Overall, the strategy resulted in a +776.17% gain last week.
 

Initial account value (since inception: 12/07/2021): $3,600.00
Last week beginning value: $31,261.95
Last week ending value: $31,541.95 (-0.08%; total: +776.17%)
The highest capital requirements to trade this strategy: $19,995
Current capital at risk: -$5,694
Unrealized Gain: $37,694 (-662.00%)
Realized Gain: -$7,883 (138.44%)
Total Gain: $29,811 (-523.55%)
Win Ratio: 55%
Average Winner: $323
Average Loser: $490


SPX PCS account value
 

SPX PCS account vs SPX
SPX PCS account vs SPX index net liq
 

SPX PCS account vs SPX
SPX PCS account vs SPX index
 

If you want to receive trade alerts whenever we open a new SPX put credit spread or a hedge trade, you can subscribe to our service:


Note, if you wish to subscribe to multiple levels, you can do so by subscribing to one level only and then sending us an email that you want to be added to other levels too.

Also, if you like this report, hit the like button so I know there is enough audience wanting to see this type of report. If you have any questions or want to see anything else about my SPX trading, do not hesitate to contact me or write a comment in the comments section. Thank you!


We all want to hear your opinion on the article above:
No Comments


Posted by Martin September 03, 2022
1 Comment


2022 Week 35 investing and trading report


Last week was a disaster to my net-liq, not necessarily trading results as I was able to bring in some cash trading options and dividend income was great too. Bu the open stock and options positions dropped and hurt the value of the portfolio. I think it will be just a temporary drawdown that I have to survive (meaning be able to go through it without liquidating my core positions).
 

And that is the issue as my cash balance is going up but my buying power is going down with the increased margin requirements. It is very hard to stay afloat:

 
Cash - Net-Liq - BP 35
 

Last week, I made a few adjustments only, but these adjustments were mostly for credit.

Our trading delivered +$644.00 premiums last week ending August 2022 at +$7,987.00 (+12.15%) options income. Our net-liq value decreased by stagerring -19.25% last week to $65,757.76 value, and our overall account is down -37.16% YTD.
 

Here is our investing and trading report:


Account Value: $65,757.76 -$12,656.74 -19.25%
Options trading results
Options Premiums Received: +$644.00    
01 January 2022 Options: +$8,885.00 +8.36%  
02 February 2022 Options: +$10,009.00 +10.34%  
03 March 2022 Options: -$1,662.00 -1.47%  
04 April 2022 Options: +$1,047.00 +1.19%  
05 May 2022 Options: +$8,604.00 +11.32%  
06 June 2022 Options: +$9,691.00 +13.73%  
07 July 2022 Options: +$8,717.00 +11.39%  
08 August 2022 Options: +$7,987.00 +0.37%  
09 September 2022 Options: -$67.00 -0.10%  
Options Premiums YTD: $53,211.00 +80.92%  
Dividend income results
Dividends Received: $152.58    
01 January 2022 Dividends: $303.38    
02 February 2022 Dividends: $732.81    
03 March 2022 Dividends: $393.74    
04 April 2022 Dividends: $337.31    
05 May 2022 Dividends: $343.99    
06 June 2022 Dividends: $445.80    
07 July 2022 Dividends: $367.66    
08 August 2022 Dividends: $683.58    
09 September 2022 Dividends: $116.43    
Dividends YTD: $3,724.70    
Portfolio Equity
Portfolio Equity: $163,853.89 -$7,701.52 -4.49%
Portfolio metrics
Portfolio Yield: 5.61%    
Portfolio Dividend Growth: 11.61%    
Ann. Div Income & YOC in 10 yrs: $71,395.60 39.71%  
Ann. Div Income & YOC in 20 yrs: $2,666,651.05 1,483.15%  
Ann. Div Income & YOC in 25 yrs: $53,770,820.94 29,906.45%  
Ann. Div Income & YOC in 30 yrs: $3,767,792,172.73 2,095,584.43%  
Portfolio Alpha: 75.45%    
Sharpe Ratio: 5.60 EXCELLENT  
Portfolio Weighted Beta: 0.49    
CAGR: 303.03%    
AROC: 80.37%    
TROC: 4.63%    
Our 2022 Goal
2022 Dividend Goal: $4,800.00 77.60% In Progress
2022 Portfolio Value Goal: $151,638.03 43.36% In Progress
6-year Portfolio Value Goal: $175,000.00 37.58% In Progress
10-year Portfolio Value Goal: $1,000,000.00 6.58% In Progress


Dividend Investing and Trading Report

 
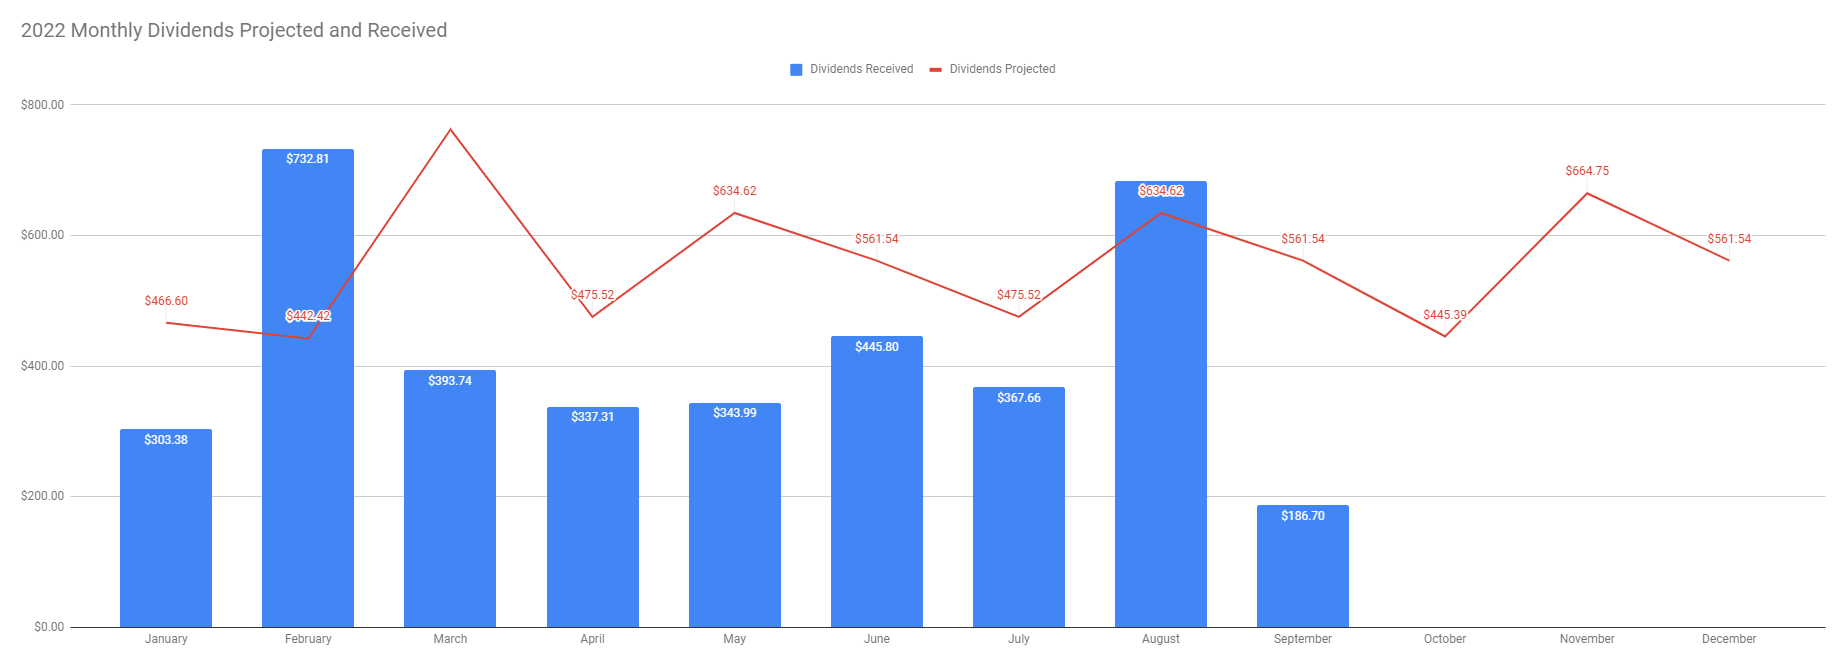
Last week we have received $152.58 in dividends bringing our August’s dividend income at $683.58. That met my expectations.

Last week, we did not purchase any dividend stock.


Here is a chart of our account equity showing our accumulation goal and the value of all stocks in our account. It shows a nice upward-sloping chart as our equities grow. This is a result of our options trading and using premiums to buy dividend stocks:

 
Account Equity week 35
 

And here you can see the dividend income those equities pay us every year:

 
Annual Dividend Payout week 35


Growth stocks Investing and Trading Report


Last week, we purchased no growth stocks.


Options Investing and Trading Report

 
Last week I was just adjusting my existing options positions.

However, these adjustments delivered a gain of +$644.00 making our August options income +$7,987.00.


We were actively trading our SPX strategy that delivered +$305.00 gain.

You can watch all our trades in this spreadsheet. You can watch the spreadsheet and look for a “NEW” indication next to the trading date. When the indicator shows up, it is typically good for up to 3 days to follow that trade.
 

Expected Future Dividend Income

 
We received $152.58 in dividends last week. Our portfolio currently yields 5.61% at $65,757.76 market value.

 
Our projected annual dividend income in 10 years is $71,395.60, but that projection is if we do absolutely nothing and let our positions grow without adding new positions or reinvesting the dividends.

We are also set to receive a $6,684.50 annual dividend income ($557.04 monthly income). We are 9.36% of our 10 year goal of $71,395.60 dividend income.

 
Future Divi on YOC week 35
 

The chart above shows how our future dividend income is based on the future yield on cost and what dividend income we may expect. The expected dividend growth depends on what stocks we add to our portfolio and the stocks’ 3 years’ average dividend growth rate. It is interesting to see what passive income we may enjoy 10, 20, 25, or 30 years from now.


Market value of our holdings

 
Our non-adjusted stock holdings market value decreased from $171,555.41 to $163,853.89 last week.

In 2022 we plan on accumulating dividend stocks, monetizing these positions, HFEA strategy, and SPX trading. We plan to raise more of our holdings to 100 shares to sell covered calls. We continued rebalancing our options trades that released buying power significantly. That allowed us to start repurchasing shares of our interest.

 
Stock holdings trading week 35
 

We aim to accumulate 100 shares of dividend growth stocks we like and then start selling covered calls or strangles around those positions. We also planned on reinvesting all dividends back into those holdings.
 

Investing and trading ROI


Our options trading delivered a +12.15% monthly ROI in August 2022, totaling a 80.92% ROI YTD. If our options income stays at this level by the end of the year, we will exceed our 45% annual revenue goal in selling options against dividend stocks.

Our entire account is still down -37.16%.
 

Our options trading averaged $5,912.33 per month this year. If this trend continues, we will make $70,948.00 trading options in 2022. As of today, we have made $53,211.00 trading options.
 

Old SPX trades repair


We traded our SPX put credit spread strategy which you will be able to review in my next report. The SPX strategy held well so far, and our signals kept us from opening new aggressive trades.


Investing and trading report in charts


Account Net-Liq


TW Account trading Net-Liq week 35
 

Account Stocks holding

 
TW Account holdings week 35
 

Last week, S&P 500 grew 37.80% since we opened our portfolio while our portfolio grew 16.91%. On YTD basis, the S&P 500 fell -26.96% and our portfolio -12.87%. This is an excellent result! We are significantly outperforming the market.

The numbers above apply to our stock holdings only. Our overall account net-liq is down by -37.16% this year.
 

Stock holdings Growth YTD

 
TW Account holdings Growth YTD
 

Our stock holdings are starting to outperform the market. Hopefully, this trend will stay, and we will constantly do better than S&P 500.
 

Our 10-year goal is to grow this account to $1,000,000.00 value in ten years. We are in year two and we accomplished 6.58% of that goal.
 

Our 6-year goal is to reach $175,000 account value to be eligible for portfolio margin (PM) and today we accomplished 37.58% of that goal.
 

Our 2022 year goal is to grow this account to a $151,638.03 and today we accomplished 43.36% of this goal.


Investing and Trading Report – Options Monthly Income

 
TW Options Trading Income week 35
 

Investing and Trading Report – Options Annual Income


TW Options Annual Trading Income week 35
 

Our dividend goal and future dividends


TW Received vs Projected Dividends week 35
 

We plan to make $4,800.00 in dividend income in 2022. As of today, we received $3,724.70. This is in line with our projected dividend 2022 goal. We also accumulated enough shares to start making $6,684.50 a year. Our monthly projected dividend income is $557.04, and our current monthly dividend income is $310.39.
 

TW Received vs Future Dividends week 35


I have a favor to ask. If you like this report, please, hit the like like button button so I know that there is enough audience that like this content. Also, if there is something you want to know or you want me to change this report to a different format, let me know in the comments section.


We all want to hear your opinion on the article above:
1 Comment


Posted by Martin September 03, 2022
No Comments


2022 SPX put credit spreads trading review – week 35


The sell-off continued last week and that affected performance of our SPX strategy. I did a few trades last week – adjusting one trade by rolling it away using a “box” trade. Then I opened a new credit call spread with an expiration last Friday. The spread expired worthless for a full profit. I also had a trade that I was trying to fix which was also set to expire last Friday. But with a sudden, sharp market selloff, the trade became an immediate bust and not worth repairing it. And since we collected plenty of cash premiums I decided to let that trade go and let it expire for a loss. The calls expired for a full profit, the puts were a bust. Yet, the overall account remains positive for this week.
 

The SPX trading delivered a $305.00 gain. That brought our account up by 0.98% while SPX lost -3.29%.
 

Overall, our SPX account is up +776.86% since the beginning of this program, and we have $38,474 in unrealized gains.


Initial trade set ups


For the SPX strategy, I dedicated a $3,600 initial amount that will be used to trade SPX PCS strategy per week. If this amount is depleted, I will evaluate the strategy to determine whether to continue or change it. If I grow this amount, I will scale up the trading.
 

WHAT WILL WE TRADE?    
DAY DTE TYPE
MONDAY 7 DTE & 40 delta 10 wide Put Credit Spread
TUESDAY 30 DTE & 40 delta 10 wide Put Credit Spread
WEDNESDAY 7 DTE & 40 delta 10 wide Put Credit Spread
FRIDAY 60 DTE & 14 delta 10 wide Put Credit Spread
EVERY MONTH 120 DTE Put Debit Spread – HEDGE


Our SPX strategy is designed as directional options trading. We are selling credit put spreads to collect premiums, and hopefully, these spreads expire worthlessly, or we repurchase them for a small debit.

We use a set of indicators (primarily based on moving averages and volume profiles) and market sentiment that generates bullish signals. The trading is based on a “trend following strategy.” We open the trade if we have a bullish signal and a bullish trend. If we do not have a signal, we stay away.

We set the set of rules and alerts and backtested them. The backtesting software proved that the strategy was viable and returned good gains. We also tried to automate the decision-making as much as possible to have the trading as mechanical as possible. This helps eliminate our emotions. The decision-making was reduced to: “bullish signal present” – open a trade, “not present” – stay away. It worked well.

Here you can see all our trades:

 
SPX PCS account value
Click on the picture above to see the entire list.
 

We do not trade 0 DTE trades. This strategy is designed to be as passive as possible. You open a trade and let it run. You do not need to be glued to the computer all the time. The strategy takes advantage of the market’s historical behavior of mainly going up. Yes, there will be selloffs and corrections, even bear markets, but over time, it goes up. And therefore, our strategy is designed for this direction. The premise is that if we have a bullish trend, we open a bullish spread and let it run. 80% or 90% of the time, it will be a winning trade. And if the trend is strong, we open more aggressive trades (which is not the case today due to the market’s correction).

How much money can you trade?

As you can see in the table below, the highest amount of cash to trade this strategy is $19,995.00. That will allow adjustments, rolls, and comfortable trading without blowing your account. Can you trade less? Well, yes, I started with a $3,600 initial amount. But you need to be selective. You won’t trade all trades. You just trade the safest trades only (which is the Friday trade), especially in this market, and when the market gets out of this mess, you can start adding trades. And you do not compound. You must wait for the actual trade to end before opening a new trade. This way, the growth will be a lot slower, and you collect less credit, but you do not blow your account, mainly when you need to roll. You do not have money to do that (as the old busted trade will need more buying power which can be reduced by adding an offsetting trade that neutralizes the old trade, but you still will need that initial buying power).


Last week trading


Overall, the strategy resulted in a +776.86% gain last week.
 

Initial account value (since inception: 12/07/2021): $3,600.00
Last week beginning value: $31,261.95
Last week ending value: $31,566.95 (+0.98%; total: +776.86%)
The highest capital requirements to trade this strategy: $19,995
Current capital at risk: -$5,474
Unrealized Gain: $38,474 (-702.85%)
Realized Gain: -$8,143 (148.76%)
Total Gain: $30,331 (-554.09%)
Win Ratio: 55%
Average Winner: $322
Average Loser: $490


SPX PCS account value
 

SPX PCS account vs SPX
SPX PCS account vs SPX index net liq
 

SPX PCS account vs SPX
SPX PCS account vs SPX index
 

If you want to receive trade alerts whenever we open a new SPX put credit spread or a hedge trade, you can subscribe to our service:


Note, if you wish to subscribe to multiple levels, you can do so by subscribing to one level only and then sending us an email that you want to be added to other levels too.

Also, if you like this report, hit the like button so I know there is enough audience wanting to see this type of report. If you have any questions or want to see anything else about my SPX trading, do not hesitate to contact me or write a comment in the comments section. Thank you!


We all want to hear your opinion on the article above:
No Comments


Posted by Martin September 03, 2022
No Comments


August 2022 $100 Challenge account review


The stock market is still in crash mode. For almost the entire August we were rallying until its end when we lost half of the gains. And now we are at risk of going lower, which will drag our stocks with it. And that was a reason for not trading this account much. Sometimes, sitting on your hands is the best strategy. The reason is that our account is too small to withstand volatility and naked options. So we just accumulate stocks and get ready for the new bull market.
 

Accumulation phase

 
The account is underperforming our goal. We are investing in stocks of our interest and building equity positions first. After we build our equity, we will be wheeling the positions. If you are not patient and want to trade right now with a small account, you can get burned significantly. The margin requirements can shift sharply and hurt your account. Trust me. I struggle with it in my main account when the maintenance requirements change sharply overnight and I am in trouble. But my main account is big enough to navigate through this and stay afloat. Our Challenge account doesn’t have that power.
 

August 2022 Challenge account review


MONTH GOAL $$ ACTUAL $$
August 2021: $409.00 $397.71
September 2021: $512.00 $476.91
October 2021: $615.00 $632.37
November 2021: $718.00 $659.00
December 2021: $821.00 $802.08
January 2022: $924.00 $594.29
February 2022: $1,027.00 $283.87
March 2022: $1,130.00 $301.74
April 2022: $1,233.00 $350.56
May 2022: $1,336.00 $428.82
June 2022: $1,439.00 $459.70
July 2022: $1,542.00 $641.27
August 2022: $1,645.00 $653.32


$100 Challenge account review

 
From the chart above, the red dot (line) indicates the current account value, compared to the blue line (plan). Our account is underperforming our goal. But I expect this to improve with the market. We will keep buying assets and monetize them once we accumulate enough shares.
 

August 2022 Overall Challenge account review

 
The chart below indicates our account value compared to the overall goal and plans to grow the $100 investment into a $75,000 portfolio. As of today, we are still at the beginning of our journey.

YEAR CONTRIBUTIONS $$ GOAL $$ ACTUAL $$
Year 0: $100.00 $100.00 $100.00
Year 1: $1,300.00 $1,336.00 $459.70
Year 2: $2,500.00 $3,016.96 $653.32
Year 3: $3,700.00 $5,303.07  
Year 4: $4,900.00 $8,412.17  
Year 5: $6,100.00 $12,640.55  
Year 6: $7,300.00 $18,391.15  
Year 7: $8,500.00 $26,211.96  
Year 8: $9,700.00 $36,848.27  
Year 9: $10,900.00 $51,313.64  
Year 10: $12,100.00 $70,986.56  


$100 Challenge account review goal


August 2022 Challenge account Income


Total Invested in Stocks $789.33
Total Unrealized Profit -$152.32
Total Realized Profit -$1.17
Strangles Income -$1,316.00
Dividends Income $29.97
Deposits Total $1600.00
Cash $15.44
Net-Liq $653.32


If you want to see what investments we take and what trades and strategies we will use to grow this small account, join our program today and grow your money too. We engage in safe investments, select strategies to maximize winning trades, and grow our portfolio. And you can do it too, today! We do not provide quick rich promises, gambling, or reckless strategies. We want our portfolio to grow steadily and preserve our capital while maximizing returns.
 

As a member, you will have access to the following features:


We all want to hear your opinion on the article above:
No Comments


Posted by Martin September 03, 2022
No Comments


HFEA August 2022 strategy report


With our HFEA portfolio in 100% of SPXL (a 3x leveraged bullish ETF), the selloff is especially damaging to the portfolio. After recent growth and outperforming the market, the portfolio turned down again – significantly. But I am OK with this development no matter how dramatic and gut-wrenching it may be. It still goes with my strategy.

Initially, I dedicated $15,000 to this strategy. That represented approx. 15% of our portfolio. When the SPXL underperforms the market and my position goes down and is below my cost basis (my position is in red), I am adding new shares to my portfolio. I deposit cash and buy shares. Once this bear market ends, and trust me, it will as no bear market lasts forever, I will stop buying new shares but trim the position and save cash from selling for the next bear market. This is a standard balancing approach. Keep my position at about 15% of my main portfolio. When it moves to 20% (or more) I sell enough to bring the position back down to 15%. If it moves down to 10% I will buy enough to bring it back to 15%, and so on.

In today’s bearish market, I am adding new cash and buying. Even though it is hurting my net-liq short term.
 

MONTH NET-LIQ PROFIT/
LOSS
PROFIT/
LOSS %%
November 2021 $13,441.91 $0.00 0.00%
December 2021 $14,773.72 $1,331.81 9.91%
January 2022 $12,597.96 -$2,175.76 -14.73%
February 2022 $11,665.69 -$932.27 -7.40%
March 2022 $12,483.01 $817.32 7.01%
April 2022 $8,694.65 -$3,788.36 -30.35%
May 2022 $6,923.49 -$1,771.16 -20.37%
June 2022 $12,199.81 $5,276.32 76.21%
July 2022 $15,551.55 $3,351.74 27.47%
August 2022 $13,414.80 -$2,136.75 -13.74%


Our HFEA strategy lost value in August 2022 and lost -13.74% while the entire market lost -4.79%. Overall, the HFEA portfolio is down -0.20% while the entire market is down -13.49%.
 

HFEA charts

 
HFEA net-liq 08
Strategy Net liquidation value
 

HFEA net-liq 08
Strategy vs SPY Net liquidation value
 

HFEA vs SPY
Strategy performance vs. SPY
 

August 2022 was not a good month for this strategy as the SPXL lost significant value (remember, the leveraged ETFs work both ways – they go up 3 times but they also go down 3 times).


We all want to hear your opinion on the article above:
No Comments


Posted by Martin August 28, 2022
2 Comments


2022 Week 34 investing and trading report


Last week I avoided trading as I was traveling. I was however forced to do a few trades. Why forced? It is typically bad to be forced to do trades and they usually end up in losses. But this time I had built reserves to avoid losses (thank God!).

What happened? Well, have you ever heard about a “Day Trade” call? Not a Pattern Day Trade call which we all hate. I just learned this stupid regulation the hard way. So, yes, a Day Trade call is another imbecilic FINRA regulation that does more harm than protecting anything against anyone. As stupid, as it can be. In a nutshell, it is pretty much a rule that if you use unsettled buying power on the same day, you will get a “Day Trade call” no matter how big your account is (unless you have tons of cash on it which I usually don’t).

It works this way – every day, your broker tells you how much “Starting Day Trade Buying Power (SDTBP)” you have and all your debit trades on that day must not exceed that amount. If it does, you will be serviced with a Day Trade call and if you do not settle it in a day or two they will block your account for 90 days. So, for example, if your SDTBP at the beginning of the day is $1,700.00 and you open new trades worth $4,000 debit that same day, you will be issued a DT call for $2,300 the next day. All you have to do is either deposit cash, or liquidate your option or stock positions to satisfy your call. Stupid? Yes, incredibly. I still wonder what the regulator was thinking when inventing this rule.

Fortunately, I had funds parked in the ISCH fund that I started rebuilding a few months ago. All I had to do is to liquidate that position to satisfy the call. And on Monday, my account should be free again and I should be able to buy the ICSH shares back to park my cash so I do not use it inappropriate way (like buying more shares or opening new options positions which could be pricey in this wacky market).
 

The ICSH liquidation had an impact on my stock positions but also on my cash-BP:

 
Cash - Net-Liq - BP 34
 

Last week, I made a few adjustments only, but these adjustments were already for credit.

Our trading delivered +$4,171.00 premiums last week ending August 2022 at +$7,343.00 (+9.36%) options income. Our net-liq value increased by +3.29% last week to $78,414.50 value, and our overall account is down -25.07% YTD.
 

Here is our investing and trading report:


Account Value: $78,414.50 +$2,580.97 +3.29%
Options trading results
Options Premiums Received: +$4,171.00    
01 January 2022 Options: +$8,885.00 +8.36%  
02 February 2022 Options: +$10,009.00 +10.34%  
03 March 2022 Options: -$1,662.00 -1.47%  
04 April 2022 Options: +$1,047.00 +1.19%  
05 May 2022 Options: +$8,604.00 +11.32%  
06 June 2022 Options: +$9,691.00 +13.73%  
07 July 2022 Options: +$8,717.00 +11.39%  
08 August 2022 Options: +$7,343.00 +0.37%  
Options Premiums YTD: $52,634.00 +67.12%  
Dividend income results
Dividends Received: $0.00    
01 January 2022 Dividends: $303.38    
02 February 2022 Dividends: $732.81    
03 March 2022 Dividends: $393.74    
04 April 2022 Dividends: $337.31    
05 May 2022 Dividends: $343.99    
06 June 2022 Dividends: $445.80    
07 July 2022 Dividends: $367.66    
08 August 2022 Dividends: $531.60    
Dividends YTD: $3,456.29    
Portfolio Equity
Portfolio Equity: $171,555.41 -$10,550.75 -5.79%
Portfolio metrics
Portfolio Yield: 5.42%    
Portfolio Dividend Growth: 11.61%    
Ann. Div Income & YOC in 10 yrs: $66,966.25 37.25%  
Ann. Div Income & YOC in 20 yrs: $2,314,761.72 1,287.43%  
Ann. Div Income & YOC in 25 yrs: $43,607,716.90 24,253.90%  
Ann. Div Income & YOC in 30 yrs: $2,787,533,849.05 1,550,380.77%  
Portfolio Alpha: 61.69%    
Sharpe Ratio: 4.63 EXCELLENT  
Portfolio Weighted Beta: 0.49    
CAGR: 327.30%    
AROC: 48.24%    
TROC: 4.62%    
Our 2022 Goal
2022 Dividend Goal: $4,800.00 72.01% In Progress
2022 Portfolio Value Goal: $151,638.03 51.71% In Progress
6-year Portfolio Value Goal: $175,000.00 44.81% In Progress
10-year Portfolio Value Goal: $1,000,000.00 7.84% In Progress


Dividend Investing and Trading Report

 
Last week we have received $0.00 in dividends bringing our August’s dividend income at $531.60. That is slightly below my expectations.

Last week, we did not purchase any dividend stock.


Here is a chart of our account equity showing our accumulation goal and the value of all stocks in our account. It shows a nice upward-sloping chart as our equities grow. This is a result of our options trading and using premiums to buy dividend stocks:

 
Account Equity week 34
 

And here you can see the dividend income those equities pay us every year:

 
Annual Dividend Payout week 34


Growth stocks Investing and Trading Report


Last week, we purchased no growth stocks. I sold my ICSH position to satisfy the DT call (that is why my equity value dropped and BP and cash raised).


Options Investing and Trading Report

 
Last week I was just adjusting my existing options positions.

However, these adjustments delivered a gain of +$4,171.00 making our August options income +$7,343.00.


We were actively trading our SPX strategy that delivered +$0.00 gain.

You can watch all our trades in this spreadsheet. You can watch the spreadsheet and look for a “NEW” indication next to the trading date. When the indicator shows up, it is typically good for up to 3 days to follow that trade.
 

Expected Future Dividend Income

 
We received $0.00 in dividends last week. Our portfolio currently yields 5.42% at $78,414.50 market value.

 
Our projected annual dividend income in 10 years is $66,966.25, but that projection is if we do absolutely nothing and let our positions grow without adding new positions or reinvesting the dividends.

We are also set to receive a $6,684.50 annual dividend income ($557.04 monthly income). We are 9.98% of our 10 year goal of $66,966.25 dividend income.

 
Future Divi on YOC week 34
 

The chart above shows how our future dividend income is based on the future yield on cost and what dividend income we may expect. The expected dividend growth depends on what stocks we add to our portfolio and the stocks’ 3 years’ average dividend growth rate. It is interesting to see what passive income we may enjoy 10, 20, 25, or 30 years from now.


Market value of our holdings

 
Our non-adjusted stock holdings market value decreased from $183,881.92 to $171,555.41 last week.

In 2022 we plan on accumulating dividend stocks, monetizing these positions, HFEA strategy, and SPX trading. We plan to raise more of our holdings to 100 shares to sell covered calls. We continued rebalancing our options trades that released buying power significantly. That allowed us to start repurchasing shares of our interest.

 
Stock holdings trading week 34
 

We aim to accumulate 100 shares of dividend growth stocks we like and then start selling covered calls or strangles around those positions. We also planned on reinvesting all dividends back into those holdings.
 

Investing and trading ROI


Our options trading delivered a +9.36% monthly ROI in August 2022, totaling a 67.12% ROI YTD. If our options income stays at this level by the end of the year, we will exceed our 45% annual revenue goal in selling options against dividend stocks.

Our entire account is still down -25.07%.
 

Our options trading averaged $6,579.25 per month this year. If this trend continues, we will make $78,951.00 trading options in 2022. As of today, we have made $52,634.00 trading options.
 

Old SPX trades repair


We traded our SPX put credit spread strategy which you will be able to review in my next report. The SPX strategy held well so far, and our signals kept us from opening new aggressive trades.


Investing and trading report in charts


Account Net-Liq


TW Account trading Net-Liq week 34
 

Account Stocks holding

 
TW Account holdings week 34
 

Last week, S&P 500 grew 40.27% since we opened our portfolio while our portfolio grew 19.65%. On YTD basis, the S&P 500 fell -24.49% and our portfolio -10.12%. This is an excellent result! We are significantly outperforming the market.

The numbers above apply to our stock holdings only. Our overall account net-liq is down by -25.07% this year.
 

Stock holdings Growth YTD

 
TW Account holdings Growth YTD
 

Our stock holdings are starting to outperform the market. Hopefully, this trend will stay, and we will constantly do better than S&P 500.
 

Our 10-year goal is to grow this account to $1,000,000.00 value in ten years. We are in year two and we accomplished 7.84% of that goal.
 

Our 6-year goal is to reach $175,000 account value to be eligible for portfolio margin (PM) and today we accomplished 44.81% of that goal.
 

Our 2022 year goal is to grow this account to a $151,638.03 and today we accomplished 51.71% of this goal.


Investing and Trading Report – Options Monthly Income

 
TW Options Trading Income week 34
 

Investing and Trading Report – Options Annual Income


TW Options Annual Trading Income week 34
 

Our dividend goal and future dividends


TW Received vs Projected Dividends week 34
 

We plan to make $4,800.00 in dividend income in 2022. As of today, we received $3,456.29. This is in line with our projected dividend 2022 goal. We also accumulated enough shares to start making $6,684.50 a year. Our monthly projected dividend income is $557.04, and our current monthly dividend income is $288.02.
 

TW Received vs Future Dividends week 34


I have a favor to ask. If you like this report, please, hit the like like button button so I know that there is enough audience that like this content. Also, if there is something you want to know or you want me to change this report to a different format, let me know in the comments section.


We all want to hear your opinion on the article above:
2 Comments


This site has been fine-tuned by 14 WordPress Tweaks