Weekly Newsletter   Challenge account   Weekly Newsletter   


Posted by Martin January 13, 2022
2 Comments


My Goal 2022


I set up my investing and trading goal for 2022 and now is the time to write it down for the record. I plan on having the goal for 2022 simple and easy to track yet it may evolve over time.
 

2022 Goal summary

 
In 2022, I will focus on the following tasks:
 

  1. Buying dividend growth stocks and monetizing those positions.
  2. Developing SPX trading.
  3. Developing and managing 15% of the portfolio in the HFEA strategy.
  4. Increase Net-Liq value of the account by 30%
  5. Maintaining 10% of the portfolio in tech growth stocks
  6. Increasing exposure to SPY LEAPS and add one or two new contracts


Dividend growth stock purchasing goal

 
In 2022 I will continue purchasing dividend growth stocks as I did in 2021. But, I will also focus on adding high-yield dividend stocks and ETFs that are relatively safe. Here is the starting list of goals of stocks I plan on purchasing this year.
 

Goal 2022 start

 
This goal is a developing task and it will morph over time and grow. It is not a rigid set of tasks. If I see a new opportunity, better than the one listed in the table above, I will shift my focus.

However, besides the dividend growth stocks, I will be buying high-yield dividend stocks such as RYLD, IEP, and QYLD (and may add other covered calls ETFs) for high yield. These stocks do not provide capital growth though but I will be purchasing them for income. I would like to create a dividend income that would offset my mortgage payments. And I am starting with HELOC to offset. That will give me peace of mind that I have cash and income saved that would help to pay my monthly payments.
 

The “BSV salary reserve goal” is a task that I wish to save enough cash in BSV to cover my annual salary, health insurance, taxes, etc. to be able to trade for a living. I am a conservative person, so I want to have enough savings in case the stock market pukes and I won’t be able to withdraw money from the account. In other words, I do not want to get caught with my pants down.


SPX PCS trading goal

 
In December 2021, I started trading SPX again using credit put spreads. I modified the strategy and now I use simple indicators to determine whether to trade PCS or stay away.

In 2022, I will be opening trades in the following days and if the indicators tell me that it is safe to open a trade:
 

Mondays (7 days to expiration)
Tuesdays (30 days to expiration)
Wednesdays (7 days to expiration)
Fridays (60 days to expiration)

And every month, I will be adding an SPX hedge for black swan events.
 

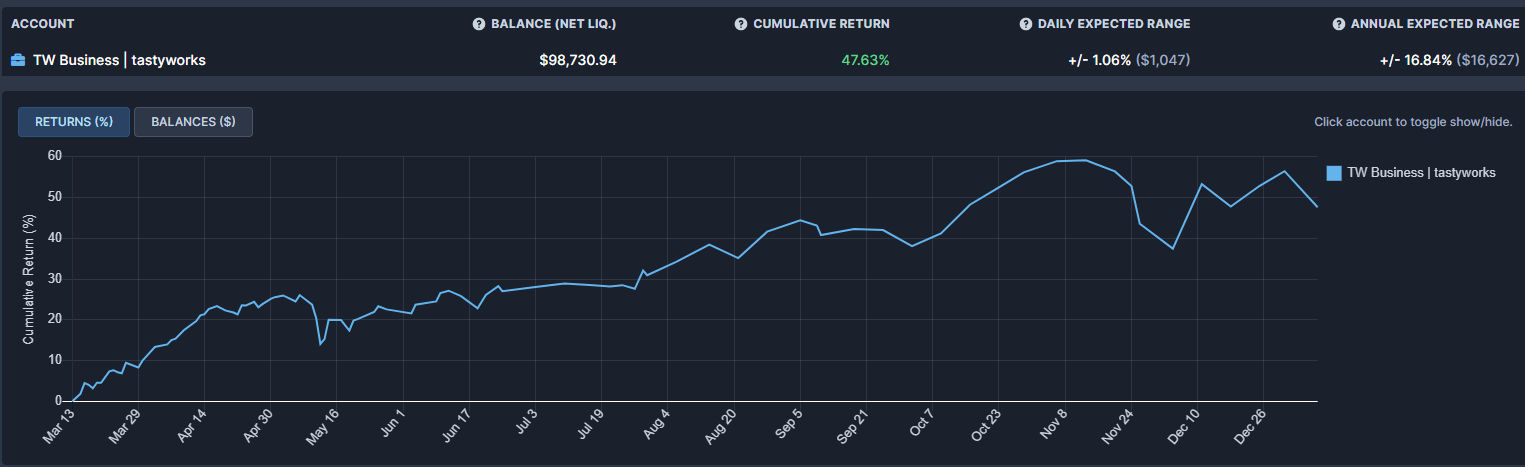
If the indicators are negative, we will skip the trade. I dedicated $3,600 for the SPX trading, currently, the account (sub-account) is at $5,370.00, an approximate growth of 47.33%. Although it may change over time my goal will be to increase this sub-account to $10,000 by EOY.
 

If you are interested, you can subscribe to SPX alerts and receive an alert via email or you can follow our Twitter for the alerts (in order to follow the Twitter account, you must be a subscriber).
 

Investing 15% in HFEA goal

 
HFEA is again a strategy (passive with quarterly rebalancing) that involves buying 3x leveraged ETFs and holding them for growth. Other investors who use this strategy reported up to 45% earnings in their accounts. I dedicated approx. $15,000 to this strategy (representing 15% of my portfolio). In December 2021, the HFEA account was up almost 10%. In January, thanks to the wobbling market, the account lost over 6% and the entire HFEA account is up about 2.4%.

There is not much I can do about this strategy. I just hold and in March (and following months) I will be rebalancing (either adding new cash to increase the account to 15% of my entire portfolio or trimming the holdings if above the 15% threshold. And, also, rebalancing ETFs within the HFEA account to keep the target allocation).

When trimming the HFEA I plan on saving the cash to dividend stocks or ETFs. When adding cash (during underperforming quarters) I will use the saved cash to increase the HFEA balance. I have not yet decided which stock or ETF I will use. I planned to use BSV but I may elect to use another stock or ETF.
 

Net-Liq value goal

 
I created a 10-year plan on growing my portfolio (all accounts together) and for 2021 my goal was to reach $42,344.06 net liq value. I calculated the initial balance and its increase based on estimated growth from options trading, stocks accumulation, stocks growth, and received dividends. The year 2021 was so exceptional that I exceeded that goal almost three times.

Well, I do not expect this to happen in 2022. But I did the same calculation as in 2021 and my new goal for the portfolio value is $151,638.03.
 

I still have goals from last year that are long-term:
 

6-year Portfolio Value Goal:  achieve $175,000.00 net-liq value.
 

10-year Portfolio Value Goal:  achieve $1,000,000.00 net-liq value.

These goals are well underway and if my portfolio growth keeps growing at the estimated pace, I should be able to achieve the 6-year goal next year in lieu of planned 2024 and the $1M goal may get accomplished at the end of year 9. Let’s see, how 2022 progresses.
 

Invest 10% in growth stocks goal

 
Although I primarily focus on dividend stocks, I also want to own a few tech stocks such as Apple (AAPL), Snowflake (SNOW), Amazon (AMZN), Tesla (TSLA), Google (GOOGL), etc. In 2022 I plan to invest in these stocks but keep my exp[osure to 10% of my entire portfolio, though. The ultimate goal will be to reach 100 shares of each to be able to sell covered calls.


Monetizing stock holdings goal

 
My goal with all my stock holdings is to reach 100 shares so I can start selling covered calls against these positions. I will be also selling strangles (and strive to cover them, to have enough cash to cover the put side, and own 100 shares to cover the call side. In 2021, trading strangles and covered calls was my biggest moneymaker. I will continue to do so in 2022 although at a slower pace.

At the top of this blog, I state “making 45% annually trading options against dividend growth stocks”. In 2021 I made over 62%. In 2022, I plan to achieve 30%.
 

LEAPS goal

 
In 2020 and 2021 I added SPY LEAPS contracts to my holdings. The 2020 LEAPS is my biggest gainer. It is unrealized gain, though I will be rolling the LEAPS further away at some point cashing my gains. In 2022 I plan on adding one or two more contracts of the SPY LEAPS to my portfolio.
 

That’s all for 2022. I will be reporting progress on this goal regularly:

Every week, I will report my overall portfolio progress and achievements the same way as I did last year.
I will also report my SPX sub-account progress every week.
Every month, I will report HFEA and Challenge account progress.
 

I would like to ask you if you could write me in the comments what you want to see in my reports or if you want to see them modified and how. Also, please hit the like button under this post so I know you liked the content and that you want to see more of it in the future. Thank you!


We all want to hear your opinion on the article above:
2 Comments


Posted by Martin January 08, 2022
No Comments


2022 Week 01 investing and trading report


The new year 2022 hasn’t started very well as the FED released its meeting minutes that spooked the markets rushing away from tech stocks. As I will present in this investing and trading report our account lost 5% in the first week of the new year while the market lost only about 1.8%. But I am optimistic and once the market calms down, the account will be going up again. Why? Because although the account lost net-liq value, we still made over $3k in options trading and great dividend income! The value is depressed because of the violent panic in the market.
 

Here is our investing and trading report:


Account Value: $98,730.94 -$5,913.70 -5.65%
Options trading results
Options Premiums Received: $3,856.00    
01 January 2022 Options: $3,856.00 +3.91%  
Options Premiums YTD: $3,856.00 +3.91%  
Dividend income results
Dividends Received: $136.25    
01 January 2022 Dividends: $136.25    
Dividends YTD: $136.25    
Portfolio metrics
Portfolio Yield: 4.63%    
Portfolio Dividend Growth: 8.80%    
Ann. Div Income & YOC in 10 yrs: $24,305.74 20.09%  
Ann. Div Income & YOC in 20 yrs: $252,342.20 208.58%  
Ann. Div Income & YOC in 25 yrs: $1,417,526.31 1171.71%  
Ann. Div Income & YOC in 30 yrs: $14,049,264.41 11,612.94%  
Portfolio Alpha: -2.59%    
Portfolio Weighted Beta: 0.61    
CAGR: 548.29%    
AROC: 3.91%    
TROC: 14.70%    
Our 2022 Goal
2022 Dividend Goal: $4,800.00 2.84% In Progress
2022 Portfolio Value Goal: $151,638.03 65.11% In Progress
6-year Portfolio Value Goal: $175,000.00 56.42% In Progress
10-year Portfolio Value Goal: $1,000,000.00 9.87% In Progress


Dividend Investing and Trading Report

 
Last week we have received $136.25 in dividends bringing January’s dividend income to $136.25.

We bought 20 shares of RYLD.

Here you can see our dividend income per stock holding:

 
Annual Dividend Payout week 01


Growth stocks Investing and Trading Report


Last week we didn’t buy any new positions in growth stocks.


Options Investing and Trading Report

 
Last week we rolled many strangle trades to keep our account safe. Each time the stock moved up or down towards one or the other strike price, it consumed our buying power. Rolling the trade to the center of our strangle, we brought in credit and released buying power.

These adjustments delivered our January income by $3,856.00 bringing January total to $3,856.00.
 

We were actively trading our SPX strategy that delivered $455.00 weekly income.

You can watch all our trades in this spreadsheet. You can watch the spreadsheet and look for a “NEW” indication next to the trading date. When the indicator shows up, it is typically good for up to 3 days to follow that trade.
 

Expected Future Dividend Income

 
We have received $136.25 in dividends last week. Our portfolio currently yields 4.63% at $98,730.94 market value.

 
Our projected annual dividend income in 10 years is $24,305.74 but that projection is if we do absolutely nothing and let our positions grow on their own without adding new positions or reinvesting the dividends.

We are also set to receive a $4,838.36 annual dividend income. We are 19.91% of our 10 year goal of $24,305.74 dividend income.

 
Future Divi on YOC week 01
 

The chart above shows how our future dividend income is based on the future yield on cost and what dividend income we may expect in the future. The expected dividend growth depends on what stocks we are adding to our portfolio and the stocks’ 3 years average dividend growth rate. It is interesting to see what passive income we may enjoy 10, 20, 25, or 30 years from now.


Market value of our holdings

 
Our non-adjusted stock holdings market value decreased from $133,469.78 to $131,541.85 last week.

In 2022 we plan on accumulating dividend stocks, monetizing these positions, HFEA strategy, and SPX trading. We plan on raising more of our holdings to 100 shares so we can start selling covered calls. However, in the first week of January 2022, we couldn’t buy any new shares as the buying power was very volatile and we are raising cash (by letting old trades expire and not reopening them, or closing trades that are almost at a full profit but a long time to expiration – for example, trade has only five cents left but 30 or 40 days to expiration. It makes no sense to wait for $5 for another 30 to 40 days. So, we closed such trades).

 
Stock holdings week 01
 

Our goal is to accumulate 100 shares of dividend growth stocks we liked and then start selling covered calls or strangles around those positions. We also planed on reinvesting all dividends back to those holdings.
 

Investing and trading ROI


Our options trading delivered a 3.91% monthly ROI in January 2022, totaling a 3.91% ROI YTD. We hope that in 2022 we exceed our 45% annual revenue selling options against dividend stocks target!

Our entire account is down -5.65% underperforming our projections and the market.
 

Our options trading averaged $3,856.00 per month this year. If this trend continues, we are on track to make $46,272.00 trading options in 2022. As of today, we have made $3,856.00 trading options.
 

Old SPX trades repair


This week, we didn’t adjust our old SPX trades. Our goal is to reach a level where we will be eligible for portfolio margin (PM). Once that happens, we plan on converting the existing SPX Iron Condors to strangles and trade these positions as strangles.

With RegT margin, the capital requirements would be approx. $66,586.06 and that is beyond our means. With PM the requirement for margin would drop to around $10k. That is doable in our account. Once we reach this level, we will start adjusting our SPX trades accordingly. Until then, we will just roll these trades around.

We however traded our SPX put credit spread strategy which you will be able to review in my next report.


Market Outlook


The stock market struggled to break through the $4,800 resistance. It broke above it for a little while but then FED sparked a selloff and the entire market dropped below $4,720 support. However, it seems the selloff is exhausted and we may see some recovery. It is, however, too early to say. Next week can be a good indicator the where the market will go. In the short term, the market is negative and poised for a downturn. In a long term, we are still bullish. I still expect the market to reach $5,000 mark in the next month or two.

If you want to learn more about the stock market, events that moved the market last week and will likely impact it in the near future, I recommend you to subscribe to our weekly newsletter. Knowing where the market is heading and knowing when you should expect its reversal can benefit your trading and investing. Subscribe and you get one month free.


Investing and trading report in charts


Account Net-Liq


TW Account Net-Liq week 01


Account Stocks holding

 
TW Account holdings week 01
 

Last week, S&P 500 grew 61.68% since we opened our portfolio while our portfolio grew 28.24%. On YTD basis, the S&P 500 fell -3.08% and our portfolio -1.53%.

The numbers above apply to our stock holdings only. Our overall account net-liq dropped by -5.65% this year.
 

Stock holdings Growth YTD

 
TW Account holdings Growth YTD
 

I expect our stock holdings to start outperforming the market hopefully soon.
 

Our 10-year goal is to grow this account to $1,000,000.00 value in ten years. We are in year two and we accomplished 9.87% of that goal.
 

Our 6-year goal is to reach $175,000 account value to be eligible for portfolio margin (PM) and today we accomplished 56.42% of that goal.
 

Our 2022 year goal is to grow this account to a $151,638.03. and today we accomplished 65.11% of this goal.


Investing and Trading Report – Options Monthly Income

 
TW Options Income week 01
 

Investing and Trading Report – Options Annual Income


TW Options Annual Income week 01
 

Our dividend goal and future dividends


TW Received vs Projected Dividends week 01
 

We planned to make $4,800.00 in dividend income in 2022. As of today, we received $136.25. We accumulated enough shares to start making $4,838.36 a year.
 

TW Received vs Future Dividends week 01


Our account cumulative return


The chart below indicates our cumulative adjusted return.
 

TW cumulative return wk 01
 

TW win ratio wk 01
 

As of today, our account cumulative return is 47.63% (note, data in this section are since March 13, 2021, only as that is the date we started tracking these metrics. Thus the results are skewed a bit and will show full picture next year.).

I have a favor to ask. If you like this report, please, hit the like like button button so I know that there is enough audience that like this content. Also if there is something you want to know or you want me to change this report to a different format, let me know in the comments section.


We all want to hear your opinion on the article above:
No Comments


Posted by Martin January 08, 2022
No Comments


2022 SPX put credit spreads trading review – week 01


The first week of 2022 didn’t start well yet our SPX strategy performed satisfactorily last week. FED released its FOMC notes and apparently, the notes said something different than what investors could hear at the FED conference talk. So the market sold off. Our signals turned negative and we reversed some of the put spreads into call spreads. If the signals stay negative, we will not be opening new trades next week.

Last week, the account increased 8.72% while SPX decreased by -1.87%.


Initial trade set ups


For my SPX strategy, I dedicated a $3,600 initial amount that will be used to trade SPX PCS strategy per week. If this amount is depleted, I will evaluate the strategy if to continue or change it. If I grow this amount, I will scale up the trading.
 

WHAT WILL WE TRADE?    
DAY DTE TYPE
MONDAY 7 DTE Put Credit Spread
TUESDAY 30 DTE Put Credit Spread
WEDNESDAY 7 DTE Put Credit Spread
FRIDAY 60 DTE Put Credit Spread
EVERY MONTH 120 DTE Put Debit Spread – HEDGE


Last week trading


DAY SIGNAL TYPE TRADE STATUS
MONDAY Positive New 7 DTE trade opened
credit: $310
Exp: Jan10
Reversed to CCS
TUESDAY Positive New 30 DTE trade opened
credit: $255
Exp: Feb4
Reversed to CCS
WEDNESDAY Negative New 7 DTE CCS trade opened
credit: $430
Exp: Jan12
FRIDAY Negative New 60 DTE trade opened
credit: $95
Exp: Mar18
EVERY MONTH New January 22 hedge trade opened


On Monday, our entry signal was positive so we opened a new 7 DTE trade. On Wednesday, the signal turned negative and the trade got in the money after the market’s selloff. We closed the put spread and reopened a new call spread. We are currently sitting in a call spread that is set to expire on Monday if the market stays down.

On Tuesday, our entry signal was positive so we opened a new 30 DTE trade. We also reversed this trade into a call spread.

On Wednesday, the market turned negative. We decided to open a new 7 DTE call credit spread trade. The trade will expire next Wednesday if the market stays down.

On Friday, the signal for the 60 DTE trade was still negative however, we opened a new 60 DTE credit spread. We also opened a new 120 DTE debit hedging trade this week as we will be opening the hedge monthly only.
 

Here are our delayed open trades:
 

SPX PCS delayed trades week 1
SPX PCS delayed trades
 

The trades are two weeks delayed. If you want to see the most recent trades or receive alerts, subscribe to our SPX alerts.
 

Overall, the strategy resulted in a $455.00 gain last week. Note that the gain might be unrealized as some or all trades may be still open.
 

Initial account value (since inception: 12/07/2021): $3,600.00
Last week beginning value: $5,215.00
Last week ending value: $5,670.00
The highest capital requirements to trade this strategy: $8,975
Unrealized Gain: $1,035 (+11.53%)
Realized Gain: $1,035 (+11.53%)
Total Gain: $2,070 (+23.06%)


SPX PCS account value
 

SPX PCS account vs SPX
SPX PCS account vs SPX index
 

If you want to receive trade alerts whenever we open a new SPX put credit spread or a hedge trade, you can subscribe to our service:


Note, if you wish to subscribe to multiple levels, you can do so by subscribing to one level only and then send us an email that you want to be added to other levels too.


We all want to hear your opinion on the article above:
No Comments


Posted by Martin January 06, 2022
No Comments


Buying LEAPS for great returns


Last year, my portfolio gained 400%. But, again, it was stocks and options contributing to such great returns. And LEAPS calls were among those options that contributed significantly.
 

What inspired me to trading LEAPS?

 
I was always interested in leveraging my portfolio. And I was always thinking about how to achieve high income faster to be reinvested to grow my portfolio. Finally, in 2021, I believe I will accomplish that goal. I hope I will be able to repeat it in 2022, too, although the start of the year wasn’t perfect so far.

In my hunt for fast and increased returns than what the standard investments offer I came across a book by Ian Ayres and Barry Nalebuff “Lifecycle Investing“. It is a great book about leveraging portfolios. The authors look at leveraging over the entire lifespan of an investor. It is interesting, but there was one thing I liked the most.

The first chapter starts with a story of Andrew Verstein, a law school student, who in January 2009 (in the middle of a financial crisis) did something everyone would be scared to death to do: he bought SPY LEAPS using all his savings. Three years later, his investment turned into $17,600 turning his $4,770 into $12,830 profit (269% return, or 89% annualized return).

Even today, if you bought SPY LEAPS in January 2019, you would get similar returns by December 2021:
 

LEAPS backtest
 

What LEAPS to trade?

 
Heureka! This is what I was looking for! Free money! I realized that this was the right vehicle for me. But I also learned that I can trade LEAPS against indexes only. Why?

The index will likely go up over time!

The index offers up to 4 years of LEAPS. It is almost guaranteed to have the index up. See the backtest above, I gained great returns even during the volatile 2019 year and 2020 covid slump. Four years is a long enough time to give SPY time to grow. Stocks do not offer that benefit.

The index will go up for sure. If you do not believe me, look at any index chart. Stocks may have a bad year and lose value. They can stay down for a very long time. Just look at BABA.
 

BABA LEAPS

 
Your LEAPS would be worthless today.
 

Managing the LEAPS

 
To wrap it up: I buy at the money LEAPS against indexes and hold them for their entire lifespan. Sometimes, I sell covered calls against those LEAPS (but in 2020 and 2021 it was tricky selling the calls as the market was relentlessly rallying and I had to continuously roll, very frustrating).

Then, 90 days to expiration, I roll, now in the money, LEAPS back up to “at the money and 700+ days to expiration. That way I cash out my profits and start with a new cycle.

And in the meantime, I ignore all the noise at Wall Street, all the media hysteria, and investors’ digestions of all sorts of fears…


We all want to hear your opinion on the article above:
No Comments


Posted by Martin January 05, 2022
No Comments


The market was weak and hopeful but today it broke


I prepare my newsletter about the market outlook during the week and I wrote this yesterday:

So far, this market has shown weakness. But a few things may turn this around – 4Q earnings season and good retail sales reports that will propagate into the earnings results and estimates. If that doesn’t save us, nothing will, and we go down.

If down we go is what we will see, then there will be a few stops. The first stop can be at $4,720, and the second at $4,520 level (or nearby). That was a pretty good stop before, so I expect it to hold if we see this. If not, further down we go. However, there is no catalyst for such a selloff.

Yesterday, little I knew that today, the stock market wouldn’t like what FED said at today’s FOMC meeting. The market sold off hard and quickly cleared the $4,720 support.

Because of today’s selloff, I reversed some of the SPX put spreads into call spreads (Monday and Tuesday put spreads), and adjusted a few stock strangles to stay delta neutral. But it can bite:
 

SPX market selloff

 
If the market is retesting the previous resistance at $4720 and we bounce from here, all those adjustments may give us trouble.


We all want to hear your opinion on the article above:
No Comments


Posted by Martin January 04, 2022
No Comments


Why I like trading strangle strategies


Why do I like trading strangle strategies? The simple answer is – because I can roll them for credit. And it is easier to manage.


Why trading strangle is better?

 
Yes, any other strategy out there – spreads, be it Condors, single side spreads or even a single option such as call or put options are difficult to roll for a credit. And when rolling options trades, you want to roll them for credit! Always!
 

Exception to trading strangle strategies

 
There is only one exception to this rule when it is OK to roll for a debit – to a certain extent – covered calls. Why covered calls are OK to roll for a debit? You can do it as long as the gain on your stock offsets the debit while rolling the call. Otherwise, it is better to let your share be called away.

For example. You have a covered call with a $60 strike price and the stock moves to $65 a share. You do not want to have your shares called away and so you decided to roll your call away and up. You decide to roll into the next month and $70 strike. You pay a 0.39 premium to do it. Was it worth doing it? Well, you gave your stock a new ceiling. It trades at $65 and now you are willing to sell it at $70 a share. that is 0.50 gain per share or $50 for 100 shares. You paid 0.39 per share or $39 for 100 shares to roll the call. You are still positive. You can do it.

But what if you would have to pay a 2.89 premium (or $289) to roll the call? Well, now you are paying money out of your pocket and when you get called away at $70 a share, you still may see a loss (or at least reduced gains). And that is what I personally do not like to do. What to do then? Use strangles.
 

Rolling strangles

 
When selling strangles, you sell both sides. It is an Iron Condor but without protective long legs. People are extremely scared of using naked options but they are actually safer and easier to manage. When one side gets breached, you can roll your trade, and even if one side is a debit trade, the other side will be a credit trade, and most of the time that credit will be large enough to offset the debit side. Most of the time, you can roll a trade up and down as the market fluctuates, and many times, you will be able to do it within the same expiration cycle.

Here is an example of a rolling trade I did today:
 

Trading strangle - rolling

 
As you can see above, I could roll the existing strangle within the same expiration cycle, higher, and for credit. No other structure can do this for you. And when at some point I cannot roll within the same expiration cycle for credit, then I move the strangle trade to the next expiration cycle.

Sometimes, when the market is volatile, I roll my strangles multiple times. When you check my trading journal, you will see 20 or more rolls and expiration dates moved far away. Some people do not like it. They say that by doing so, I block too much capital for too long. True, but I also protect my capital. With strangles, the losses can be large if left alone without any management.

To me, once the trade goes bust, it is no longer about gains and percentages. It is now about preservation. If you do not want to manage a trade, then yes, trade spreads. Once a spread goes bust, you can convert it to an Iron Condor by adding the opposite side. That will help to bring enough credit to offset a roll so you may roll the touched side. Then you have one more management tool – converting your Condor to Iron Fly by moving untouched side close to your touched side so your shorts become a straddle (same strikes) which will bring some more credit, and after that, you are done. Let it go.

Not my cup of tea.

I have read (and heard) that there are some traders who roll their trades as long as they work for them and then they go out. If it means rolling some trades indefinitely, so be it. And I am one of those traders.
 

What are the disadvantages of trading strangles?

 
There are a few caveats to trading strangles. Although I love them, they are not always so great.
 

Trading strangles is expensive

 
Trading strangles is expensive. So it is better to use margin or if you have a large enough account, use covered strangle. What does that mean? Basically, trade cash-secured put side and covered call side. That’s it. But even with that, it still will be capital requirement heavy trading.
 

Naked strangles can be very volatile

 
If you decide to use margin trading strangles, be prepared for volatility. I am fighting with volatility all the time (partially because I am not disciplined and overtrade). And when volatility spikes, strangles can give you a really hard time. Many times, I had to roll a trade to make it neutral and release buying power, which on one hand is great – no margin call, on the other hand, hurts my trade by prolonging it or moving a trade that is not necessary to move, and makes my broker happy as he collects more fees. And sometimes, when volatility spikes, adjusting a trade won’t help at all. So, if you decide to use margin, keep enough cash in your account.
 

Risk to the upside

 
Although the downside (put side) is somewhat limited, the call side is unlimited. Although your broker tells you that the put side has unlimited risk, it is not true. The underlying stock can go to zero only, so your loss will be equivalent to the loss of a stock whether you get assigned or not. if your stock is trading at $30 a share and you sell $30 strike put and the stock goes to zero, you lose $3,000. You will never lose more than that.

On the other hand, the call side is truly unlimited. The stock can go from $30 a share to $300,000 a share and your losses can be more than what you have. So always try to trade strangles with your call side covered and if you cannot hold 100 shares, use stocks that are relatively safe – established companies, for example. Never trade it using penny stocks or high-flying meme stocks, or you may get busted.

Once I have read about a trader who sold a bunch of naked calls against a pharmaceutical stock that was trading for $3 a share. The trader was expecting the stock to go belly up and he would pocket nice profits on his worthless calls. But overnight, another company announced a merge and the penny stock opened at $37 a share in the morning. His losses were in hundreds of thousands of dollars. With no way to fix it.

Although this scenario is unlikely when trading established good quality stocks, the risk is still there. As an old adage says: anything can happen. So if you see your stock going up, roll your strangle with the stock to keep it delta neutral (or close to it) or start buying shares (that’s what big money funds do).
 

Hope this helps to explain why strangles are not as dangerous as many try to tell you and in fact, can be safer.

Did you like this post? Hit the like button for me, please. And if you hated it as full of hogwash, hit that dislike button for me too. I won’t write hogwashes anymore if too many dislikes are hit. I promise.


We all want to hear your opinion on the article above:
No Comments


Posted by Martin January 02, 2022
No Comments


December 2021 $100 Challenge account review


Although the year 2021 is over, our Challenge account program’s fiscal year will end in May 2022. We are in month 7 of the program and as you will see below, we are tracking our goal as projected so far. The start of the options trading in the account was a bit challenging as our only position (AES) got increasingly volatile from day one and that threw a wrench into our trading. Later, the stock finally settled down and now it behaves as expected.

 
AES in Challenge account

 
At first, a sudden selloff in AES forced us to adjust our trade down to keep it safe. Then a huge recovery and rally up shook our trade again as we had to adjust again to the upside to avoid margin calls before the stock finally settled down again and worked in our favor. But these are occurrences that will be happening and every investor and trader must be prepared and have a plan B or a strategy in his/her sleeve to apply. No matter what the stock market throws at you, you must know what to do and accept any outcome.

Why? Because I have seen many impatient investors or traders that wanted results immediately. They are not willing to wait and give the stock or trade position required time to work in your favor. I have seen investors shocked seeing some of my trades with 200 or more days to expiration and saying that they would not block their money for such a long time. But when a situation like this happens and you have to roll your trade, it is then about capital preservation. If you can fix trade and give it more time to work out, I will do it. Mainly in an account where we cannot afford assignments because we are still too small to buy 100 shares of an underlying stock. That is the risk when trading a small account. As I said at the very beginning when trading small accounts, be prepared for everything in the stock market world to be set against you. Everything.

But we are progressing well and within our scheduled goal.


Accumulation phase

 
The account is slightly underperforming our goal but it is on the path to success. We are now trading small trades (strangles) and we will continue accumulating shares for our next options trade. The strangle trades are consuming collateral buying power but as they near towards expiration we will see a jump in BP and net-liq.

We are trading strangles because they are easier to manage compared to Iron Condors or spreads. It is why we are not engaged in trading SPX credit put spreads yet because these can be profitable but one trade against us can wipe our account. We are simply too small and undercapitalized for these types of trades. Strangles are also a bit more expensive as far as capital requirements go. That is why choosing good stocks to trade is crucial. Choose safe, stable stocks, providing enough premium and stability. And that is what we are doing.
 

October 2021 Challenge account review


MONTH GOAL $$ ACTUAL $$
June 2021: $203.00 $202.67
July 2021: $306.00 $334.75
August 2021: $409.00 $397.71
September 2021: $512.00 $476.91
October 2021: $615.00 $632.37
November 2021: $718.00 $659.00
December 2021: $821.00 $802.08
January 2022: $924.00  
February 2022: $1,027.00  
March 2022: $1,130.00  
April 2022: $1,233.00  
May 2022: $1,336.00  


$100 Challenge account review

 
From the chart above, the red dot (line) indicates the current account value, compared to the blue line (plan). Our account is trailing our goal. When trading naked options, expect volatility in your net-liq. That can be seen by some as a disadvantage. When trading spreads, your net-liq will be stabilized by neutralizing delta. With naked options, you would have to choose other instruments to do so, for example owning stocks to neutralize your call side. We do not have this yet as our account is small, but we are building our position.
 

October 2021 Overall Challenge account review

 
The chart below indicates our account value compared to the overall goal and plan to grow $100 investment into a $75,000 portfolio. As of today, we are at the beginning of our journey.

YEAR CONTRIBUTIONS $$ GOAL $$ ACTUAL $$
Year 0: $100.00 $100.00 $100.00
Year 1: $1,300.00 $1,336.00 $802.08
Year 2: $2,500.00 $3,016.96  
Year 3: $3,700.00 $5,303.07  
Year 4: $4,900.00 $8,412.17  
Year 5: $6,100.00 $12,640.55  
Year 6: $7,300.00 $18,391.15  
Year 7: $8,500.00 $26,211.96  
Year 8: $9,700.00 $36,848.27  
Year 9: $10,900.00 $51,313.64  
Year 10: $12,100.00 $70,986.56  


$100 Challenge account review goal


September 2021 Challenge account Income


Total Invested in Stocks $54.60
Total Unrealized Profit -$0.48
Total Realized Profit -$1.17
Strangles Income $259.00
Dividends Income $11.94
Deposits Total $800.00
Cash $1,119.96
Net-Liq $802.08


August 2021 Cumulative return Challenge account review


As of today, our challenge account provided a -5.97% monthly cumulative return.
 

$100 Challenge account review goal

 
$100 Challenge account review goal


If you want to see what investments we take, what trades and strategies we will use to grow this small account join our program today and grow your money too. We engage in safe investments, select strategies to maximize winning trades, and grow our portfolio. And you can do it too, today! We do not provide quick rich promises, gambling, or reckless strategies. We want our portfolio to grow steadily and preserve our capital while maximizing returns.
 

As a member, you will have access to the following features:


We all want to hear your opinion on the article above:
No Comments


Posted by Martin January 01, 2022
No Comments


2021 SPX put credit spreads trading review – week 52


The last week of the year 2021 was still positive with a bull market intact for our SPX trading. Also, our indicators were bullish, so we opened new trades although these trades are now in the money (not all of them, just two of the most recent trades), we think they will recover because the indicators are unchanged despite the market’s minor pullback. If they do not recover and the market continues down, we will close the positions.

Last week, the account increased 25% while SPX increased a little over 0.85%.


Initial trade set ups


For my SPX strategy, I dedicated a $3,600 initial amount that will be used to trade SPX PCS strategy per week. If this amount is depleted, I will evaluate the strategy if to continue or change it. If I grow this amount, I will scale up the trading.
 

WHAT WILL WE TRADE?    
DAY DTE TYPE
MONDAY 7 DTE Put Credit Spread
TUESDAY 30 DTE Put Credit Spread
WEDNESDAY 7 DTE Put Credit Spread
FRIDAY 60 DTE Put Credit Spread
EVERY MONTH 120 DTE Put Debit Spread – HEDGE


Last week trading


DAY SIGNAL TYPE TRADE STATUS
MONDAY Positive New 7 DTE trade opened
credit: $285
Exp: Jan3
TUESDAY Positive New 30 DTE trade opened
credit: $315
Exp: Jan28
WEDNESDAY Positive New 7 DTE trade opened
credit: $360
Exp: Jan5
FRIDAY Positive New 60 DTE trade opened
credit: $85
Exp: Feb28
EVERY MONTH No new trade


On Monday, our entry signal was positive so we opened a new 7 DTE trade. That trade is still out of the money but the market sits near the short strike. If on Monday selling continues, we will have to close the trade for a loss. If the market rallies, it will expire for a full profit.

On Tuesday, our entry signal was positive so we opened a new 30 DTE trade. The short strike is now in the money but the trade has 27 days to expiration. Since all indicators are bullish, we will wait.

On Wednesday, the market was positive and we opened a new 7 DTE trade. That trade is now fully in the money (both strikes). If the market continues down next week, we will have to close the trade for a loss.

On Friday, the signal for the 60 DTE trade was positive, so we opened a new 60 DTE credit spread. We didn’t open a new 120 DTE debit hedging trade this week as we will be opening the hedge monthly only.
 

Here are our delayed open trades:
 

SPX PCS delayed trades
 

The trades are two weeks delayed. If you want to see the most recent trades or receive alerts, subscribe to our SPX alerts.
 

Overall, the strategy resulted in a $1,045.00 gain last week. Note that the gain might be unrealized as some or all trades may be still open.
 

Initial account value (since inception: 12/07/2021): $3,600.00
Last week beginning value: $4,170.00
Last week ending value: $5,215.00
The highest capital requirements to trade this strategy: $6,490.00
Unrealized Gain: $1,510 (+23.27%)
Realized Gain: $105 (+1.62%)
Total Gain: $1,615 (+24.88%)


SPX PCS account value
 

SPX PCS account vs SPX
SPX PCS account vs SPX index
 

If you want to receive trade alerts whenever we open a new SPX put credit spread or a hedge trade, you can subscribe to our service:


Note, if you wish to subscribe to multiple levels, you can do so by subscribing to one level only and then send us an email that you want to be added to other levels too.


We all want to hear your opinion on the article above:
No Comments


Posted by Martin December 31, 2021
4 Comments


2021 Week 52 investing and trading report – End of the year!


Wow, the year 2021 is over. I wish all my readers Happy New Year 2022! It was exceptionally good year. I made a lot of money this year trading options, buying dividend growth stocks, and reinvesting the dividends.

Overall, I achieved 60% ROI trading options, but if we take into account that I started the account with $20,572.35 and made $62,026 trading options, I achieved 301.50% revenue trading options!
 

Here is a picture from my tracking spreadsheet:
 

Options trading End of the year

 
So, as you can see, I was doing pretty well in 2021 trading options. Along with the stock holdings, that delivered an astonishing 408.67% Net-Liq growth in 2021. I hope, I will have 2022 as successful as 2021 although I do not expect it because, honestly, my trading was quite aggressive and I want to slow down next year.
 

Here is our investing and trading report:


Account Value: $104,644.64 +$2,395.35 +2.34%
Options trading results
Options Premiums Received: -$1,411.00    
01 January 2021 Options: $4,209.00 +16.65%  
02 February 2021 Options: $4,884.00 +15.41%  
03 March 2021 Options: $5,258.00 +12.79%  
04 April 2021 Options: $2,336.00 +4.30%  
05 May 2021 Options: $6,346.00 +9.22%  
06 June 2021 Options: $4,677.00 +6.37%  
07 July 2021 Options: $3,865.00 +5.14%  
08 August 2021 Options: $6,133.00 +7.40%  
09 September 2021 Options: $2,353.00 +2.97%  
10 October 2021 Options: $8,721.00 +9.27%  
11 November 2021 Options: $4,577.00 +5.24%  
12 December 2021 Options: $8,667.00 +8.28%  
Options Premiums YTD: $62,026.00 +62.04%  
Dividend income results
Dividends Received: $9.46    
01 January 2021 Dividends: $53.04    
02 February 2021 Dividends: $63.00    
03 March 2021 Dividends: $30.31    
04 April 2021 Dividends: $139.70    
05 May 2021 Dividends: $167.45    
06 June 2021 Dividends: $168.56    
07 July 2021 Dividends: $228.62    
08 August 2021 Dividends: $780.09    
09 September 2021 Dividends: $176.60    
10 October 2021 Dividends: $256.73    
11 November 2021 Dividends: $463.90    
12 December 2021 Dividends: $200.20    
Dividends YTD: $2,785.53    
Portfolio metrics
Portfolio Yield: 4.70%    
Portfolio Dividend Growth: 8.80%    
Ann. Div Income & YOC in 10 yrs: $24,969.22 20.57%  
Ann. Div Income & YOC in 20 yrs: $264,575.96 217.95%  
Ann. Div Income & YOC in 25 yrs: $1,511,555.24 1245.17%  
Ann. Div Income & YOC in 30 yrs: $15,328,917.11 12,627.44%  
Portfolio Alpha: 52.97%    
Portfolio Weighted Beta: 0.58    
CAGR: 572.13%    
AROC: 61.11%    
TROC: 9.16%    
Our 2021 Goal
2021 Dividend Goal: $1,071.42 259.10% Accomplished
2021 Portfolio Value Goal: $42,344.06 247.13% Accomplished
6-year Portfolio Value Goal: $175,000.00 59.80%  
10-year Portfolio Value Goal: $1,000,000.00 10.46%  


Dividend Investing and Trading Report

 
Last week we have received $9.46 in dividends bringing December’s dividend income to $200.20. We didn’t buy any shares of dividend growth stocks last week. We only traded SPX credit spreads.

Here you can see our dividend income per stock holding:

 
Annual Dividend Payout week 52


Growth stocks Investing and Trading Report


Last week we didn’t buy any new positions in growth stocks.


Options Investing and Trading Report

 
Last week we rolled some of the trades that got their call sides breached as the market rallied. But we also bought a protective put against our BABA strangle trade. I no longer feel comfortable holding BABA naked. I think BABA will eventually go to $30 a share. BABA jumped up almost 10% last week but then it started selling again. Buying the protective put reduced our risk in case I am right and the stock goes bust (and I am no longer going to defend the position) unless the Chinese government changes their investment rules so they will be similar to the western countries rules, not necessarily those in the US. Until then, any Chinese company listed in the US is a tremendous risk to me and I am not willing to take it.

These adjustments and buying the protective put lowered our December income by -$1,411.00 bringing December at $8,667.00.
 

We were actively trading our SPX strategy that delivered $1,045.00 weekly income. However, the market stalled at the $4,800 level that acts as resistance. It then bounced down and some of our SPX positions are in the money. If the selling continues we may be closing those positions at a loss.

You can watch all our trades in this spreadsheet. You can watch the spreadsheet and look for a “NEW” indication next to the trading date. When the indicator shows up, it is typically good for up to 3 days to follow that trade.
 

Expected Future Dividend Income

 
We have received $9.46 in dividends last week. Our portfolio currently yields 4.70% at $104,644.64 market value.

 
Our projected annual dividend income in 10 years is $24,969.22 but that projection is if we do absolutely nothing and let our positions grow on their own without adding new positions or reinvesting the dividends.

We are also set to receive a $4,825.62 annual dividend income. We are 19.33% of our 10 year goal of $24,969.22 dividend income.

 
Future Divi on YOC week 52
 

The chart above shows how our future dividend income is based on the future yield on cost and what dividend income we may expect in the future. The expected dividend growth depends on what stocks we are adding to our portfolio and the stocks’ 3 years average dividend growth rate. It is interesting to see what passive income we may enjoy 10, 20, 25, or 30 years from now.


Market value of our holdings

 
Our non-adjusted stock holdings market value increased from $132,669.29 to $133,469.78 last week.

This is another great achievement of our 2021 investing journey. We diligently reinvested all our dividends and options premiums buying stocks and creating a snowball.

Here is another view of our investing progress and stock holdings growth:

 
Stock holdings growth
 

As you can see, we started the year with an $18,179.67 stock holdings value and grew our positions to $133,469.78.

 
Stock holdings week 52
 

Our goal was to accumulate 100 shares of dividend growth stocks we liked and then start selling covered calls or strangles around those positions. We also planed on reinvesting all dividends back to those holdings. We fulfilled our goal at 66%.

Here is what our goal was at the beginning of 2021:

 
Our 2021 goal
 

And here is how our goal evolved over time and how we accomplished it:

 
Our 2021 goal EOY
 

I am happy with the result but I hoped I could achieve more and buy more shares. But the goal was evolving and I focused on adding new strategies that postponed the goal too. Later when the markets became volatile I had to keep buying power available to sustain the swings (and sometimes I had hard times keeping my BP positive). Overall, I consider this a good achievement.

I will be moving unfinished goals into the 2022 year.


Investing and trading ROI


Our options trading delivered a 8.28% monthly ROI in December 2021, totaling a 59.27% ROI YTD. We again exceeded our 45% annual revenue selling options against dividend stocks target!

Our account grew by 408.67% beating our projections and the market.
 

Our options trading averaged $5,168.83 per month this year. If this trend continues, we are on track to make $62,026.00 trading options in 2021. As of today, we have made $62,026.00 trading options.
 

Old SPX trades repair


This week, we didn’t adjust our old SPX trades. Our goal is to reach a level where we will be eligible for portfolio margin (PM). Once that happens, we plan on converting the existing SPX Iron Condors to strangles and trade these positions as strangles.

With RegT margin, the capital requirements would be approx. $66,586.06 and that is beyond our means. With PM the requirement for margin would drop to around $10k. That is doable in our account. Once we reach this level, we will start adjusting our SPX trades accordingly. Until then, we will just roll these trades around.

We however traded our SPX put credit spread strategy which you will be able to review in my next report.


Market Outlook


The market rallied to the $4,800 mark as we predicted in our newsletter and then stalled. The $,800 level happened to become a strong resistance. Almost a book perfect resistance. The market tried to go above but retreated. But trading was light and pretty much quiet. VIX was down and the VIX structure indicates no troubles, also all our SPX trading signals were positive. So I think there is no need to worry. The current price action seems to be just a consolidation. But we need to wait for the next week.

If you want to learn more about the stock market, events that moved the market last week and will likely impact it in the near future, I recommend you to subscribe to our weekly newsletter. Knowing where the market is heading and knowing when you should expect its reversal can benefit your trading and investing. Subscribe and you get one month free.


Investing and trading report in charts


Account Net-Liq


TW Account Net-Liq week 52


Account Stocks holding

 
TW Account holdings week 52
 

Last week, S&P 500 grew 64.76% since we opened our portfolio while our portfolio grew 29.80%. On YTD basis, the S&P 500 grew 34.92% and our portfolio 22.82%.

The numbers above apply to our stock holdings only. Our overall account net-liq grew by 408.67% this year! This is thanks to options trading that generates income. It can be also seen how the options help lower our cost basis. Just compare the P&L in the regular (left) column with the P&L in the “Options adjusted” column. For example, our AES holding would be a loser as of today (down -7.31%), but we generated enough income (we can call it also a return of our invested capital) and that position is 133.29% up.
 

Stock holdings Growth YTD

 
TW Account holdings Growth YTD
 

I expect our stock holdings to start outperforming the market hopefully soon. The entire portfolio beats the market by far thanks to monetizing those positions.

Our 10-year goal is to grow this account to $1,000,000.00 value in ten years. We are in year two and we accomplished 10.46% of that goal.

Our 6-year goal is to reach $175,000 account value to be eligible for portfolio margin (PM) and today we accomplished 59.80% of that goal.

Our 2021 year goal is to grow this account to a $42,344.00. We already accomplished this goal.


Investing and Trading Report – Options Monthly Income

 
TW Options Income week 52
 

Investing and Trading Report – Options Annual Income


TW Options Annual Income week 52
 

Our dividend goal and future dividends


TW Received vs Projected Dividends week 52
 

We have accomplished our dividend income goal. We planned to make $1,071 of dividend income this year and we finished receiving $2,785.53. However, we accumulated enough shares to start making $4,825.62 a year.

Also, it is amazing to see, that on monthly basis, we received $53 in dividends and grew our account and now we are receiving $400 in dividends.
 

TW Received vs Future Dividends week 52


Our account cumulative return


The chart below indicates our cumulative adjusted return.
 

TW cumulative return wk 52
 

TW win ratio wk 51
 

As of today, our account cumulative return is 56.47% (note, data in this section are since March 13, 2021, only as that is the date we started tracking these metrics. Thus the results are skewed a bit and will show full picture next year.).

I have a favor to ask. If you like this report, please, hit the like like button button so I know that there is enough audience that like this content. Also if there is something you want to know or you want me to change this report to a different format, let me know in the comments section.


We all want to hear your opinion on the article above:
4 Comments


Posted by Martin December 25, 2021
2 Comments


2021 Week 51 investing and trading report


One more week and the year 2021 will be over. So far, it was a very good year investing and trading in dividend growth stocks and options monetizing my positions. This investing and trading report will show our effort in achieving our goals.

As Santa rally came to the town, our Net-Liq recovered form last week selloff by +3.45%, our options income increased in December by +9.86% and our dividend income is in line with our monthly goal.

December became our best month in options trading income.
 

Here is our investing and trading report:


Account Value: $102,249.29 +$3,414.29 +3.45%
Options trading results
Options Premiums Received: $3,909.00    
01 January 2021 Options: $4,209.00 +16.65%  
02 February 2021 Options: $4,884.00 +15.41%  
03 March 2021 Options: $5,258.00 +12.79%  
04 April 2021 Options: $2,336.00 +4.30%  
05 May 2021 Options: $6,346.00 +9.22%  
06 June 2021 Options: $4,677.00 +6.37%  
07 July 2021 Options: $3,865.00 +5.14%  
08 August 2021 Options: $6,133.00 +7.40%  
09 September 2021 Options: $2,353.00 +2.97%  
10 October 2021 Options: $8,721.00 +9.27%  
11 November 2021 Options: $4,577.00 +5.24%  
12 December 2021 Options: $10,078.00 +9.86%  
Options Premiums YTD: $63,437.00 +62.04%  
Dividend income results
Dividends Received: $54.51    
01 January 2021 Dividends: $53.04    
02 February 2021 Dividends: $63.00    
03 March 2021 Dividends: $30.31    
04 April 2021 Dividends: $139.70    
05 May 2021 Dividends: $167.45    
06 June 2021 Dividends: $168.56    
07 July 2021 Dividends: $228.62    
08 August 2021 Dividends: $780.09    
09 September 2021 Dividends: $176.60    
10 October 2021 Dividends: $256.73    
11 November 2021 Dividends: $463.90    
12 December 2021 Dividends: $190.74    
Dividends YTD: $2,776.07    
Portfolio metrics
Portfolio Yield: 4.49%    
Portfolio Dividend Growth: 8.80%    
Ann. Div Income & YOC in 10 yrs: $23,510.42 19.13%  
Ann. Div Income & YOC in 20 yrs: $231,237.94 190.49%  
Ann. Div Income & YOC in 25 yrs: $1,254,627.39 1033.53%  
Ann. Div Income & YOC in 30 yrs: $11,860,339.38 9,770.24%  
Portfolio Alpha: 55.76%    
Portfolio Weighted Beta: 0.58    
CAGR: 574.14%    
AROC: 49.32%    
TROC: 9.88%    
Our 2021 Goal
2021 Dividend Goal: $1,071.42 259.10% Accomplished
2021 Portfolio Value Goal: $42,344.06 241.47% Accomplished
6-year Portfolio Value Goal: $175,000.00 58.43%  
10-year Portfolio Value Goal: $1,000,000.00 10.22%  


Dividend Investing and Trading Report

 
Last week we have received $54.51 in dividends bringing December’s dividend income to $190.74. We didn’t buy any shares of dividend growth stocks last week, but as we completed our HFEA accumulation goal, we will now focus on accumulating dividend growth and high-yield dividend stocks.

Our goal is to accumulate enough shares of RYLD this year and next year so the dividends will cover our mortgage monthly payments. At first, we will reinvest all dividends and premiums until we reach a $300 monthly payment (HELOC loan). Once we reach this goal, we will use the dividends to pay off our HELOC. At the current RYLD price and yield, we need to accumulate $36,000 and buy 1470 shares.

Here you can see our dividend income per stock holding:

 
Annual Dividend Payout week 51


Growth stocks Investing and Trading Report


Last week we didn’t buy any new positions of growth stocks.


Options Investing and Trading Report

 
Last week we rolled some of the trades that got their call sides breached as the market rallied.

These adjustments delivered $3,909.00 of additional options income bringing December at $6,169.00.
 

We were actively trading our SPX strategy that delivered $715.00 weekly income.

You can watch all our trades in this spreadsheet. You can watch the spreadsheet and look for a “NEW” indication next to the trading date. When the indicator shows up, it is typically good for up to 3 days to follow that trade.
 

Expected Future Dividend Income

 
We have received $54.51 in dividends last week. Our portfolio currently yields 4.49% at $102,249.29 market value.

 
Our projected annual dividend income in 10 years is $23,510.42 but that projection is if we do absolutely nothing and let our positions grow on their own without adding new positions or reinvesting the dividends.

We are also set to receive a $4,836.21 annual dividend income. We are 20.57% of our 10 year goal of $23,510.42 dividend income.

 
Future Divi on YOC week 51
 

The chart above shows how our future dividend income is based on the future yield on cost and what dividend income we may expect in the future. The expected dividend growth depends on what stocks we are adding to our portfolio and the stocks’ 3 years average dividend growth rate. It is interesting to see what passive income we may enjoy 10, 20, 25, or 30 years from now.


Market value of our holdings

 
Our non-adjusted stock holdings market value increased from $129,178.85 to $132,669.29 last week.

 
Stock holdings week 51
 

Our goal is to accumulate 100 shares of dividend growth stocks we like and then start selling covered calls or strangles around those positions. We also plan on reinvesting all dividends back to those holdings. I plan on doing this until the portfolio can deliver enough income to cover all living expenses and then start trading full-time.
 

Investing and trading ROI


Our options trading delivered a 9.86% monthly ROI in December 2021, totaling a 62.04% ROI YTD. We again exceeded our 45% annual revenue selling options against dividend stocks target!

Our account grew by 397.02% beating our projections and the market.
 

Our options trading averaged $5,286.42 per month this year. If this trend continues, we are on track to make $63,437.00 trading options in 2021. As of today, we have made $63,437.00 trading options.
 

Old SPX trades repair


This week, we didn’t adjust our old SPX trades. Our goal is to reach a level where we will be eligible for portfolio margin (PM). Once that happens, we plan on converting the existing SPX Iron Condors to strangles and trade these positions as strangles.

With RegT margin, the capital requirements would be approx. $66,586.06 and that is beyond our means. With PM the requirement for margin would drop to around $10k. That is doable in our account. Once we reach this level, we will start adjusting our SPX trades accordingly. Until then, we will just roll these trades around.

We however traded our SPX put credit spread strategy which you can overview in this report.


Market Outlook


Santa Claus finally arrived in the town and delivered its rally. Stocks recovered losses from previous weeks and with it, our net-liq recovered too. It was obvious that the selloff had no legs as the fear indicators showed that the market didn’t really care about Omicron or any other BS out there. I will write about this in my newsletter. So, if you want to know why I knew that the market will not repeat December 2018 selloff, subscribe to the newsletter.

If you want to learn more about the stock market, events that moved the market last week and will likely impact it in the near future, I recommend you to subscribe to our weekly newsletter. Knowing where the market is heading and knowing when you should expect its reversal can benefit your trading and investing. Subscribe and you get one month free.


Investing and trading report in charts


Account Net-Liq


TW Account Net-Liq week 51


Account Stocks holding

 
TW Account holdings week 51
 

Last week, S&P 500 grew 63.37% since we opened our portfolio while our portfolio grew 29.00%. On YTD basis, the S&P 500 grew 33.52% and our portfolio 22.01%.

The numbers above apply to our stock holdings only. Our overall account net-liq grew by 397.02% this year! This is thanks to options trading that generates income. It can be also seen how the options help lower our cost basis. Just compare the P&L in the regular (left) column with the P&L in the “Options adjusted” column. For example, our AES holding would be a loser as of today (down -10.17%), but we generated enough income (we can call it also a return of our invested capital) and that position is 126.09% up.
 

Stock holdings Growth YTD

 
TW Account holdings Growth YTD
 

I expect our stock holdings to start outperforming the market hopefully soon. The entire portfolio beats the market by far thanks to monetizing those positions.

Our 10-year goal is to grow this account to $1,000,000.00 value in ten years. We are in year two and we accomplished 10.22% of that goal.

Our 6-year goal is to reach $175,000 account value to be eligible for portfolio margin (PM) and today we accomplished 58.43% of that goal.

Our 2021 year goal is to grow this account to a $42,344.00. We already accomplished this goal.


Investing and Trading Report – Options Monthly Income

 
TW Options Income week 51
 

Investing and Trading Report – Options Annual Income


TW Options Annual Income week 51
 

Our dividend goal and future dividends


TW Received vs Projected Dividends week 51
 

We have accomplished our dividend income goal. We planned to make $1,071 of dividend income this year and we finished receiving $2,776.07. However, we accumulated enough shares to start making $4,836.21 a year.

Also, it is amazing to see, that on monthly basis, we received $53 in dividends and grew our account and now we are receiving $400 in dividends.
 

TW Received vs Future Dividends week 51


Our account cumulative return


The chart below indicates our cumulative adjusted return.
 

TW cumulative return wk 51
 

TW win ratio wk 51
 

As of today, our account cumulative return is 52.89% (note, data in this section are since March 13, 2021, only as that is the date we started tracking these metrics. Thus the results are skewed a bit and will show full picture next year.).

We will report our next week’s results next Saturday. Until then, good luck and good trading!


We all want to hear your opinion on the article above:
2 Comments


This site has been fine-tuned by 14 WordPress Tweaks