Weekly Newsletter   Challenge account   Weekly Newsletter   


Posted by Martin October 09, 2021
No Comments


2021 Week 40 investing and trading report


October 2021 has started last week and it started on a good note. Our account has recovered fully and went on a growth mode again. Our net-liquidating value, as you will see in this investing and trading report jumped up significantly, our buying power also went up allowing us to open a few new trades, and we continued accumulating speculative stocks that we believe will ensure rapid portfolio growth over the long run.

There is still a lot of fear out there, people worrying about things that are either not important or exaggerating issues that are not a problem yet. As you will see, and if you are a subscriber to our newsletter, you will learn more details, that the US economy is still humming well and set on the growth track. It is stunning to see people being blinded by a fact that the economy is running in waves and you have small waves and big waves. We should be worried about the big waves and not the small ones and I strongly believe, that the September pullback is a small wave of a typical economic cycle. Even if we see it as an economic pullback, it will rebound and continue higher.

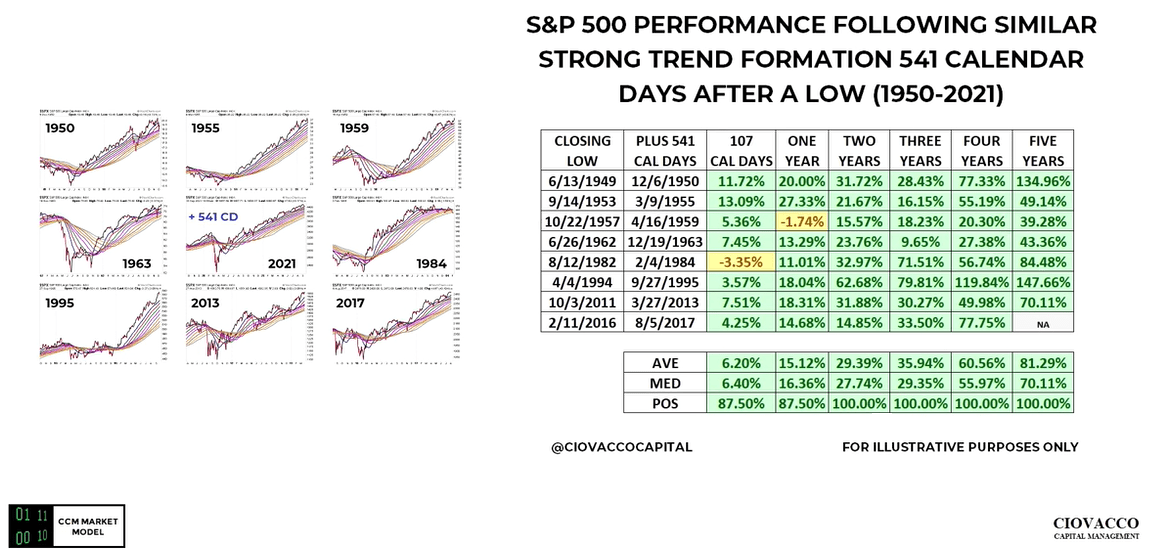
Study the market’s history, the last secular bull market took 20 years (1980 – 2000), we are in a secular market that has taken 12 years only. And it is pretty normal that you will see cyclical bears, pullbacks, and corrections in between. Don’t freak out where you do not need to.

And, in the meantime, please, enjoy our weekly investing and trading report.


Here is our investing and trading report:


Account Value: $85,025.27 $5,804.79 7.33%
Options trading results
Options Premiums Received: $1,396.00    
01 January 2021 Options: $4,209.00 +16.65%  
02 February 2021 Options: $4,884.00 +15.41%  
03 March 2021 Options: $5,258.00 +12.79%  
04 April 2021 Options: $2,336.00 +4.30%  
05 May 2021 Options: $6,346.00 +9.22%  
06 June 2021 Options: $4,677.00 +6.37%  
07 July 2021 Options: $3,865.00 +5.14%  
08 August 2021 Options: $6,133.00 +7.40%  
09 September 2021 Options: $2,353.00 +2.97%  
10 October 2021 Options: $1,396.00 +1.64%  
Options Premiums YTD: $41,457.00 +48.76%  
Dividend income results
Dividends Received: $65.14    
01 January 2021 Dividends: $53.04    
02 February 2021 Dividends: $63.00    
03 March 2021 Dividends: $30.31    
04 April 2021 Dividends: $139.70    
05 May 2021 Dividends: $167.45    
06 June 2021 Dividends: $168.56    
07 July 2021 Dividends: $228.62    
08 August 2021 Dividends: $780.09    
09 September 2021 Dividends: $176.60    
10 October 2021 Dividends: $65.14    
Dividends YTD: $1,913.99    
Portfolio metrics
Portfolio Yield: 4.18%    
Portfolio Dividend Growth: 8.13%    
Ann. Div Income & YOC in 10 yrs: $16,336.97 15.77%  
Ann. Div Income & YOC in 20 yrs: $124,089.30 119.82%  
Ann. Div Income & YOC in 25 yrs: $525,647.30 507.55%  
Ann. Div Income & YOC in 30 yrs: $3,436,221.65 3,317.94%  
Portfolio Alpha: 41.48%    
Portfolio Weighted Beta: 0.69    
CAGR: 635.14%    
AROC: 37.10%    
TROC: 16.78%    
Our 2021 Goal
2021 Dividend Goal: $1,071.42 178.64% Accomplished
2021 Portfolio Value Goal: $42,344.06 200.80% Accomplished
6-year Portfolio Value Goal: $175,000.00 48.59%  
10-year Portfolio Value Goal: $1,000,000.00 8.50%  


Dividend Investing and Trading Report

 
Last week, as the markets have shown some recovery, we grew our net-liq value by 7.33%. If the trend in S&P500 continues I expect rapid growth (mostly due to SSO and SPXL holdings) of our net liq in the coming weeks. If the current trend doesn’t hold (see our market outlook below or subscribe to our newsletter for a full market outlook analysis), our net-liq may drop again. But it will be a temporary drop. A good opportunity to buy more shares.

Our dividend income was steady, we have received $65.14 in dividends last week, making October at $65.14 dividend income.

Here are our holdings today:

 
Annual Dividend Payout week 40
 

Options Investing and Trading Report

 
Our options income started great in October. We generated $1,396.00 options income so far this month and we expect to generate more. I hope, the market would stay pressured for a while so I can keep buying cheaper stocks and making more money on options.

Last week our buying power (BP) went above the $2,000 limit we set for October and that allowed us to open new trades. We sold strangles against AAPL, WBA, KBE, and BAC stocks.

Other than that, we rolled our strangles against AAPL, KBE, MU, OXY, XOM, and we rolled our KBE covered call higher (for a credit).
 

You can watch all our trades in this spreadsheet. You can watch the spreadsheet and look for a “NEW” indication next to the trading date. When the indicator shows up, it is typically good for up to 3 days to follow that trade.
 

Expected Future Dividend Income

 
We received $65.14 in dividends last week. It is still slow that I would like to see but we are still in an accumulation phase so I do not care much about the total amount of dividends I am receiving today. I am building a portfolio with the expectation of getting large dividends in the future. And in the meantime, I learned how to trade option to generate consistent income today.

 
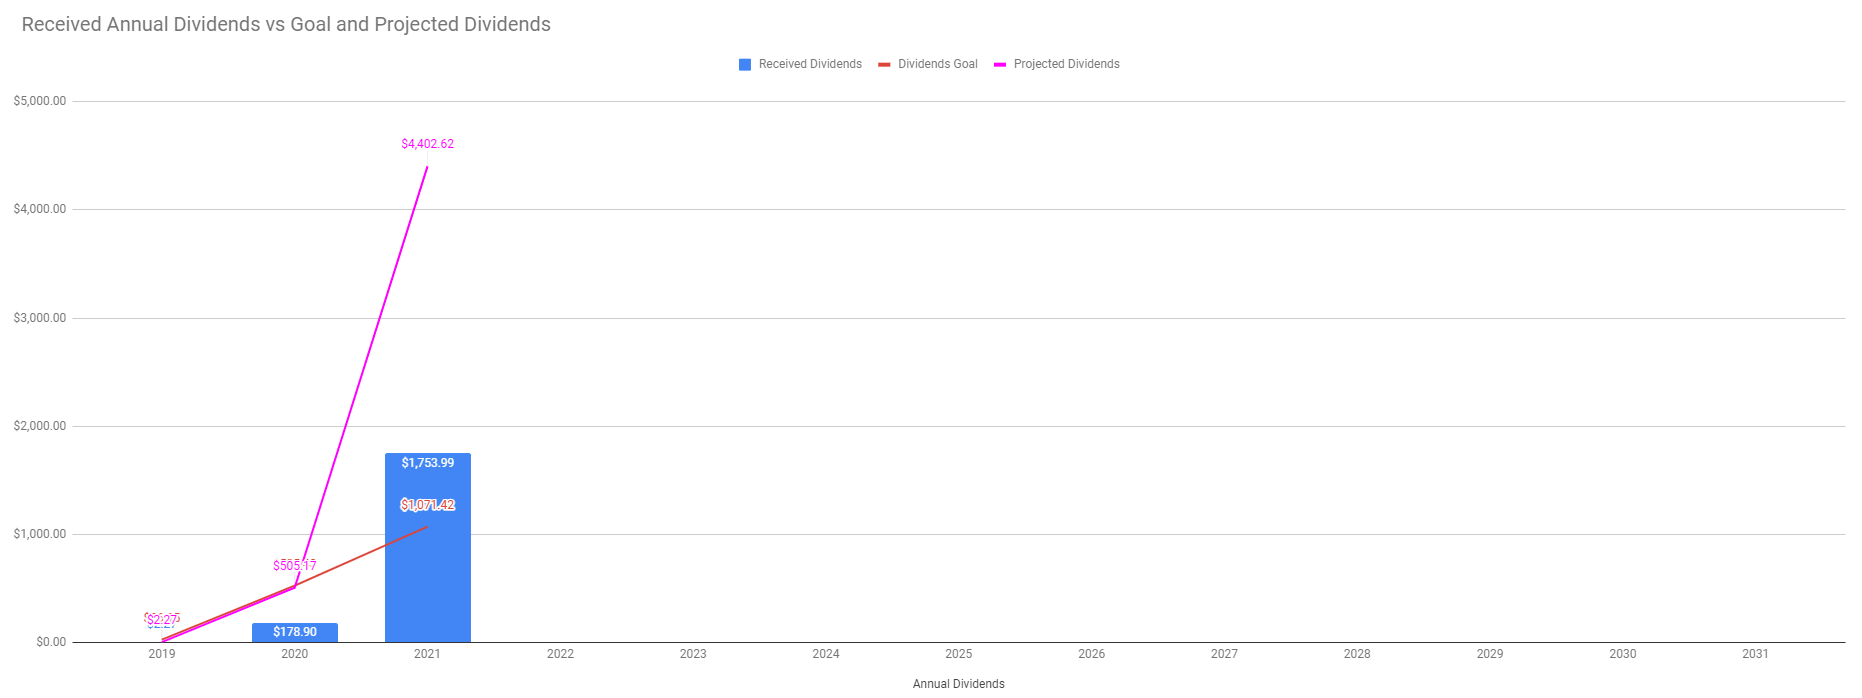
Our projected annual dividend income in 10 years is $16,336.97 but that is if we do absolutely nothing and let our positions grow on their own.

We are also set to receive a $3,940.36 annual dividend income. We are 24.12% of our 10 year goal.

 
Future Divi on YOC week 40
 

The chart above shows how our future dividend income is based on the future yield on cost and what dividend income we may expect in the future. The expected dividend growth depends on what stocks we are adding to our portfolio and the stocks’ 3 years average dividend growth rate. It is interesting to see what passive income we may enjoy 10, 20, 25, or 30 years from now.


Market value of our holdings

 
Our non-adjusted stock holdings market value increased from $108,138.05 to $111,297.56 last week.

However, we still expect the value of our holdings to grow and outperform the market long term. Many positions in our portfolio are new and “young” and they did not have enough time to show gains yet. We were building cash reserves to buy depressed stocks during selloffs and corrections as well as negative analysts reports (as long as the company is still good long term).

 
Stock holdings week 40
 

Our goal is to accumulate 100 shares of each stock of our interest and we are getting to that goal.
 

Investing and trading ROI


Our options trading delivered a 1.64% monthly ROI in October 2021, totaling a 48.76% ROI YTD. We again exceeded our 45% annual revenue selling options against dividend stocks target!

Our account grew by 313.30% beating our projections and the market.
 

Our options trading averaged $4,145.70 per month this year. If this trend continues, we are on track to make $49,748.40 trading options in 2021. As of today, we have made $41,457.00 trading options.
 

Old SPX trades repair


This week, we didn’t adjust any SPX trades. Our goal is to reach a level that we will be eligible for portfolio margin (PM). Once that happens, we plan on converting the existing SPX Iron Condors to strangles and trade these positions as strangles.

With RegT margin, the capital requirements would be approx. $66,586.06 and that is beyond our means. With PM the requirement for margin would drop to around $10k. That is doable in our account. Once we reach this level, we will start adjusting our SPX trades accordingly. Until then, we will just roll these trades around.


Accumulating Growth Stocks


Last week we have added 5 shares of SSO and 9 shares of SPXL to our holdings according to our plan and rules. Our goal for the nearest future is to accumulate 25% of our net-liq in these shares and maintain the weight. If the weight goes above 25% we will start trimming the positions, and when the weight goes below 25% we will start accumulating the positions. Any leftovers will be reinvested to the dividend growth stocks, options trades, or reserves.


Accumulating Rules


Our rule is to buy shares of growth stocks using 20% of any BP value that is above the $2,000 limit. For example, if our BP ends at $2,900, we can buy shares using 20% of $900 or $180 to accumulate shares of any growth stocks.

Why such a rule? Up to today, I was scaling up my trades and portfolio. That resulted in rapid growth but also all our proceeds were constantly locked in the trades. If we want to live off of our dividends and options income, we cannot have them locked by new trades. We need to start accumulating “cash available to withdraw”. Therefore, I am shifting my trading to trade the same amount of contracts and invest only a certain excess of the accumulated cash.


Accumulating Dividend Growth Stocks


Last week, we didn’t add any new dividend growth stocks.

Our goal is to reach 100 shares of high-quality dividend stocks and build a weekly dividend income as per this calendar, but we have made no changes to this goal last week:
 

Weekly dividends income calendar
 
You can see the entire spreadsheet here.


Market Outlook


The stock market rallied most of the last week and reached the upper trend line of a downward sloping channel. We need the market to break above that level and move higher. If it doesn’t, expect more selling. We are seeing the market creating lower highs and lower lows. From the TA perspective, it is a bearish trend. We need that trend to be broken.


Although anything can happen in the stock market at any time, I do not see this trend break but either continue going lower or wobbling sideways with the slight downward push. My expectation for the upcoming week is still down to the $4,230 level unless some good economic news (such as better job report, consumer index, PPI, or retail sales) comes that would push the market up. The market can also run on the ceiling debt optimism (rumors) and then pull back on the news on October 18th.

Definitely, we are at crossroads and have to wait. But, these lower prices are a great opportunity.
 

If you want to learn more about the stock market, events that moved the market last week and will likely impact it in the near future, I recommend you to subscribe to our weekly newsletter. Knowing where the market is heading and knowing when you should expect its reversal can benefit your trading and investing. Subscribe and you get one month free.


Investing and trading report in charts


Account Net-Liq


TW Account Net-Liq week 40


Account Stocks holding

 
TW Account holdings week 40
 

Our stock holdings still do not beat the market, although when I was preparing this report and updating our Watch list page, I noticed an interesting discrepancy (if I can call it that way) between the market’s return and our account stock holdings return.

I compared our stock holdings at the end of August (week 35 report) and saw that the market returned 56.79% since 04/01/2019 (it is the inception date of our portfolio) and our stock holdings returned 20.94% at that time.

Today, the market is returning 51.81% but our portfolio stock holdings returned 24.66%. Putting it together, the market return went down, while our stock holdings return went up.

Last week, S&P 500 grew 51.81% since we opened our portfolio while our portfolio grew 24.66%. On YTD basis, the S&P 500 grew 21.96% and our portfolio 17.67%.

But the numbers above apply to our stock holdings in our account, not the overall account net-liq growth. Our overall account beats the market growing by 313.30%!
 

Stock holdings Growth YTD

 
TW Account holdings Growth YTD
 

I expect our stock holdings to start outperforming the market as they mature. However, these are just our stock holdings. The entire portfolio beats the market by far thanks to monetizing those positions.

Our 10-year goal is to grow this account to $1,000,000.00 value in ten years. We are in year two and we accomplished 8.50% of that goal.

Our 6-year goal is to reach $175,000 account value to be eligible for portfolio margin (PM) and today we accomplished 48.59% of that goal.

Our 2021 year goal is to grow this account to a $42,344.00. We already accomplished this goal.


Investing and Trading Report – Options Monthly Income

 
TW Options Income week 40
 

Investing and Trading Report – Options Annual Income


TW Options Annual Income week 40
 

Our dividend goal and future dividends


TW Received vs Projected Dividends week 40
 

We have accomplished our dividend income goal. We planned to make $1,071 of dividend income this year and we finished receiving $1,913.99. However, we accumulated enough shares to start making $3,940.36 a year.
 

TW Received vs Future Dividends week 40


Our account cumulative return


The chart below indicates our cumulative adjusted return. It shows how the last week’s selloff shook down our returns but we are recovering along with the market.
 

TW cumulative return wk 40
 

TW win ratio wk 40
 

As of today, our account cumulative return is 41.20% (note, data in this section are since March 13, 2021, only as that is the date we started tracking these metrics. Thus the results are skewed a bit and will show full picture next year.).


Conclusion of our investing and trading report


This week our options trading was within our expectations and I believe, the rest of the month will be even better.

We will continue accumulating the dividend growth stocks in our portfolio to reach 100 shares and continue building our cash reserves so we have enough cash to sustain any market corrections and be able to buy depressed stocks.

We will report our next week’s results next Saturday. Until then, good luck and good trading!


We all want to hear your opinion on the article above:
No Comments


Posted by Martin October 09, 2021
No Comments


Dividend Growth Stocks to Accumulate in October 2021


October 2021 is starting and here is a list of stocks we would like to focus on accumulating. We have the entire watch list of stocks we like but in that watch list, not all stocks are a buy. They are just candidates. We then narrow that list down to stocks we want to trade options against and stocks we want to be buying.

But this time our accumulation program will be slightly different as we need to narrow our focus down a bit. This list became too broad and it was difficult to focus on the goal. On top of it, we imposed rules on when we can accumulate the stocks. We can use 20% of any cash above the $2,000 limit.


Dividend growth stocks to accumulate in October 2021


Here is the list we would like to focus on this month. It also contains our progress from previous months. We pick a stock in the list and keep buying until we reach 100 shares. This helps me to focus on the goal and not get distracted too much by other stocks and tips. Sometimes, when I have money available to invest, I get paralyzed asking myself, what am I going to buy now? This list helps me to buy stocks I previously selected as good stocks to buy.

But since the list is getting broad, we are narrowing it to accumulating SPXL and SSO stocks in October only. No other shares will be purchased until we accumulate 25% of the entire account net-liq.

 
October 2021 dividend growth stocks
 

If you are interested in knowing how we select stocks to our watch list, you need to subscribe to our challenge account program where we will be explaining the process.

Do your own due diligence if you decide to invest in these stocks. The information here is believed to be accurate but may have changed since publishing.
 

We will hold these stocks forever. We will sell them only when they no longer meet our dividend investing criteria (for example the company cuts the dividend) or the stock significantly underperform and better opportunities present themselves. If these companies keep paying dividends and increasing them, we will hold.

We will also sell options around these positions to offset our cost basis. During selloffs and recoveries, we may also buy call options to capture the recovery. If you are interested to see what we are buying and what options we are selling/buying, subscribe to our program.


We all want to hear your opinion on the article above:
No Comments


Posted by Martin October 03, 2021
No Comments


September 2021 $100 Challenge account review


September 2021 is over and we continue building our challenge account. We are currently tracking our goal, our metrics are slightly below the goal but we are moving higher.

As I mentioned before, building a small account is a slow process but as time goes by, it will speed up and you will be pleased with the results.

We started this program six months ago and it is intended for people who have a small account and very little money to invest. Every month we deposit $100 to our account and invest in stocks to generate income. That income is then used to trade options and generate even more income that can be reinvested.


Accumulation phase

 
The account is slightly underperforming our goal but it is on the path to success. We are now trading small trades (strangles) and we will continue accumulating shares for our next options trade. The strangle trades are consuming collateral buying power but as they near towards expiration we will see a jump in BP and net-liq.

We are trading strangles because they are easier to manage compared to Iron Condors, but they are also a bit more expensive as far as capital requirements go. That is why choosing good stocks to trade is crucial. Choose safe, stable stocks, providing enough premium and stability. And that is what we are doing.
 

September 2021 Challenge account review


MONTH GOAL $$ ACTUAL $$
June 2021: $203.00 $202.67
July 2021: $306.00 $334.75
August 2021: $409.00 $397.71
September 2021: $512.00 $476.91
October 2021: $615.00  
November 2021: $718.00  
December 2021: $821.00  
January 2022: $924.00  
February 2022: $1,027.00  
March 2022: $1,130.00  
April 2022: $1,233.00  
May 2022: $1,336.00  


$100 Challenge account review

 
From the chart above, the red dot (line) indicates the current account value, compared to the blue line (plan). Our account is trailing our goal. When trading naked options, expect volatility in your net-liq. That can be seen by some as a disadvantage. When trading spreads, your net-liq will be stabilized by neutralizing delta. With naked options, you would have to choose other instruments to do so, for example owning stocks to neutralize your call side. We do not have this yet as our account is small, but we are building our position.
 

September 2021 Overall Challenge account review

 
The chart below indicates our account value compared to the overall goal and plan to grow $100 investment into a $75,000 portfolio. As of today, we are at the beginning of our journey.

YEAR CONTRIBUTIONS $$ GOAL $$ ACTUAL $$
Year 0: $100.00 $100.00 $100.00
Year 1: $1,300.00 $1,336.00 $476.91
Year 2: $2,500.00 $3,016.96  
Year 3: $3,700.00 $5,303.07  
Year 4: $4,900.00 $8,412.17  
Year 5: $6,100.00 $12,640.55  
Year 6: $7,300.00 $18,391.15  
Year 7: $8,500.00 $26,211.96  
Year 8: $9,700.00 $36,848.27  
Year 9: $10,900.00 $51,313.64  
Year 10: $12,100.00 $70,986.56  


$100 Challenge account review goal


September 2021 Challenge account Income


Total Invested in Stocks $193.57
Total Unrealized Profit -$6.33
Total Realized Profit $2.21
Strangles Income $92.00
Dividends Income $6.46


August 2021 Cumulative return Challenge account review


As of today, our challenge account provided a -7.47% monthly cumulative return.
 

$100 Challenge account review goal

 
$100 Challenge account review goal


If you want to see what investments we take, what trades and strategies we will use to grow this small account join our program today and grow your money too. We engage in safe investments, select strategies to maximize winning trades, and grow our portfolio. And you can do it too, today! We do not provide quick rich promises, gambling, or reckless strategies. We want our portfolio to grow steadily and preserving our capital while maximizing returns.


We all want to hear your opinion on the article above:
No Comments


Posted by Martin October 02, 2021
No Comments


2021 Week 39 investing and trading report


September is over! What a month! We were used to sharp declines and even sharper recoveries but in September, this was a slow and dreadful decline. That’s why it possibly felt so painful. The market was literally declining the entire month. We only had a few green days that were sold off the very next day. The dip buyers simply refused to step in and buy the dip on all sorts of fears, bogus or real. In this investing and trading report, we will report our performance, investing and trading in stocks and options, and how we dealt with this market.


Here is our investing and trading report:


Account Value: $79,220.48 -$2,269.94 -2.79%
Options trading results
Options Premiums Received: $1,176.00    
01 January 2021 Options: $4,209.00 +16.65%  
02 February 2021 Options: $4,884.00 +15.41%  
03 March 2021 Options: $5,258.00 +12.79%  
04 April 2021 Options: $2,336.00 +4.30%  
05 May 2021 Options: $6,346.00 +9.22%  
06 June 2021 Options: $4,677.00 +6.37%  
07 July 2021 Options: $3,865.00 +5.14%  
08 August 2021 Options: $6,133.00 +7.40%  
09 September 2021 Options: $2,353.00 +2.97%  
Options Premiums YTD: $40,061.00 +50.57%  
Dividend income results
Dividends Received: $45.86    
01 January 2021 Dividends: $53.04    
02 February 2021 Dividends: $63.00    
03 March 2021 Dividends: $30.31    
04 April 2021 Dividends: $139.70    
05 May 2021 Dividends: $167.45    
06 June 2021 Dividends: $168.56    
07 July 2021 Dividends: $228.62    
08 August 2021 Dividends: $780.09    
09 September 2021 Dividends: $176.60    
Dividends YTD: $1,848.85    
Portfolio metrics
Portfolio Yield: 4.37%    
Portfolio Dividend Growth: 8.13%    
Ann. Div Income & YOC in 10 yrs: $17,185.57 16.86%  
Ann. Div Income & YOC in 20 yrs: $137,415.75 134.80%  
Ann. Div Income & YOC in 25 yrs: $606,843.94 595.28%  
Ann. Div Income & YOC in 30 yrs: $4,196,753.15 4,116.81%  
Portfolio Alpha: 43.24%    
Portfolio Weighted Beta: 0.70    
CAGR: 625.66%    
AROC: 50.85%    
TROC: 16.49%    
Our 2021 Goal
2021 Dividend Goal: $1,071.42 172.56% Accomplished
2021 Portfolio Value Goal: $42,344.06 187.09% Accomplished
6-year Portfolio Value Goal: $175,000.00 45.27%  
10-year Portfolio Value Goal: $1,000,000.00 7.92%  


Dividend Investing and Trading Report

 
Two weeks ago, the market started looking great as we were recovering from the prior selling. But then it all went down the hill last Monday. As is typical for the markets, what you see was an overreaction. The media was telling us that the markets are afraid of inflation, labor shortage, high-interest rates, a slowing economy, Powell, China, debt ceiling, and ghosts. But many of the fears are typically bogus or part of a typical economic cycle. Nothing goes up forever. Be happy if it just slows down.

Last week we lost our net-liq value by 2.79%. Overall, in September our account lost -4.41% which is less than the entire market. The S&P 500 lost -5.7%. In this perspective, our account beat the market.

Our dividend income was steady, we have received $45.86 in dividends last week, closing September at $176.60 dividend income. However, our dividend projections changed from last week. Our overall future annual dividend income dipped. The culprit was OMF which was showing $743 annual dividend income for many weeks and it suddenly dropped to $280 a year dividend income. I couldn’t find any reason, the dividend has not been cut, so I can guess that in the previous weeks, special dividends were included. I will investigate more.

Here is what our dividend income looked like in the previous weeks, and here are our holdings today:

 
Annual Dividend Payout week 39
 

Options Investing and Trading Report

 
Our options income was spectacular in September. We closed the month with $2,353.00 options income but that is after we purchased LEAPS options worth $5,000.00. If we haven’t bought those options, our September income would have been $7,353.00 making it the best month ever. But we had to take the opportunity of the market selloff.

That’s why I like these selloffs as they truly present a great opportunity. Great income opportunity and great chance to buy more positions cheap.

Last week we didn’t trade any new trades although we could open 2 trades that expired in the last expiration cycle. According to our rules, we can reopen expired trades only but only if the buying power is above $2,000 or more and the new trades won’t drop the BP below that limit.

The entire last week, our BP was below that limit the entire week. Thus we couldn’t open any new trades.

We only rolled a few existing trades that were slipping and lowering our BP. Rolling those trades helped to release that BP. We rolled AES, AXP, BA, DKNG, KBE, MO, O, PBCT, SPY, TSN, and WEN strangles and spreads. All trades delivered great premiums and helped to release our buying power.

We only opened one new protective butterfly against SPY as a hedge. If S&P500 drops to $4,100 a share and the trade will be close to expiration, we will bank a nice premium that should offset any portfolio unrealized losses.
 

You can watch all our trades in this spreadsheet. You can watch the spreadsheet and look for a “NEW” indication next to the trading date. When the indicator shows up, it is typically good for up to 3 days to follow that trade.
 

Expected Future Dividend Income

 
Our dividend income was slower last week. We received $45.86 only for dividends but I am still happy with it. We are in an accumulation phase so I do not care much about the total amount of dividends I am receiving. I am building the portfolio and I know it will bring fruits later.

 
Our projected annual dividend income in 10 years is $17,185.57 but that is if we do absolutely nothing and let our positions grow on their own.

We are also set to receive a $3,948.98 annual dividend income. We are 22.98% of our 10 year goal. This is however a drop from our previous weeks due to OMF dividend reporting.

 
Future Divi on YOC week 39
 

The chart above shows how our future dividend income is based on the future yield on cost and what dividend income we may expect in the future. The expected dividend growth depends on what stocks we are adding to our portfolio and the stocks’ 3 years average dividend growth rate. It is interesting to see what passive income we may enjoy 10, 20, 25, or 30 years from now.


Market value of our holdings

 
Our non-adjusted stock holdings market value decreased from $109,309.61 to $108,138.05 last week due to the market selloff.

However, we still expect the value of our holdings to grow and outperform the market long term. Many positions in our portfolio are new and “young” and they did not have enough time to show gains yet. We were building cash reserves to buy depressed stocks during selloffs and corrections as well as negative analysts reports (as long as the company is still good long term).

 
Stock holdings week 39
 

Our goal is to accumulate 100 shares of each stock of our interest and we are getting to that goal.
 

Investing and trading ROI


Our options trading delivered a 2.97% monthly ROI in September 2021, totaling a 50.57% ROI YTD. We again exceeded our 45% annual revenue selling options against dividend stocks target!

Our account grew by 285.08% beating our projections and the market.
 

Our options trading averaged $4,451.22 per month this year. If this trend continues, we are on track to make $53,414.67 trading options in 2021. As of today, we have made $40,061.00 trading options.
 

Old SPX trades repair


This week, we didn’t adjust any SPX trades. Our goal is to reach a level that we will be eligible for portfolio margin (PM). Once that happens, we plan on converting the existing SPX Iron Condors to strangles and trade these positions as strangles.

With RegT margin, the capital requirements would be approx. $66,586.06 and that is beyond our means. With PM the requirement for margin would drop to around $10k. That is doable in our account. Once we reach this level, we will start adjusting our SPX trades accordingly. Until then, we will just roll these trades around.


Accumulating Growth Stocks


Last week we have not bought any growth stocks because our BP value was below the $2,000 limit.


Accumulating Rules


Our rule is to buy shares of growth stocks using 20% of any BP value that is above the $2,000 limit. For example, if our BP ends at $2,900, we can buy shares using 20% of $900 or $180 to accumulate shares of any growth stocks.

Why such a rule? Up to today, I was scaling up my trades and portfolio. That resulted in rapid growth but also all our proceeds were constantly locked in the trades. If we want to live off of our dividends and options income, we cannot have them locked by new trades. We need to start accumulating “cash available to withdraw”. Therefore, I am shifting my trading to trade the same amount of contracts and invest only a certain excess of the accumulated cash.


Accumulating Dividend Growth Stocks


Last week, we didn’t add any new dividend growth stocks because our BP was below the limit the entire week. See our rules above.

Our goal is to reach 100 shares of high-quality dividend stocks and build a weekly dividend income as per this calendar, but we have made no changes to this goal last week:
 

Weekly dividends income calendar
 
You can see the entire spreadsheet here.


Market Outlook


The stock market sold off again last week reversing the previous recovery. The rest of the week was ugly. Historically, October is one of the best months, so if history repeats itself, we should see a nice EOY rally starting in October.

According to LPL Research, Octobers are not that bad and should initiate a rally well into November with some cool-off in December.
 

SPX prediction next week

 
But that doesn’t mean, the beginning of October can be ugly. Mainly when the market morphed into a short-term downtrend channel. This is significant technical damage. We are now creating lower lows and lower highs and that is not good. It would take a lot of effort to break this channel and move higher. There is still a good chance that this will happen. Even historically after very ugly downtrends in 1998, 2000, 2004, 2007, 2010, 2015, 2018, and 2020, the market printed very good performance after for 1 year, 3 years, and 5 years periods to come.


We briefly approach close to the $4,500 target but the market didn’t have the strength to reach it or exceed it. We broke below $4,300 support and as of today, it appears that we will be going lower towards the 200-day moving average.
 

If you want to learn more about the stock market, events that moved the market last week and will likely impact it in the near future, I recommend you to subscribe to our weekly newsletter. Knowing where the market is heading and knowing when you should expect its reversal can benefit your trading and investing. Subscribe and you get one month free.


Investing and trading report in charts


Account Net-Liq


TW Account Net-Liq week 39


Account Stocks holding

 
TW Account holdings week 39
 

Our stock holdings still do not beat the market but I am positive that the growth will pick up and exceeds the market. We just need time and continue reinvesting the proceeds. S&P 500 grew 50.62% since we opened our portfolio while our portfolio grew 22.30% only. On YTD basis, the S&P 500 grew 20.78% and our portfolio 15.32%.

But the numbers above apply to our stock holdings in our account, not the overall account net-liq growth. Our overall account beats the market growing by 285.08%!
 

Stock holdings Growth YTD

 
TW Account holdings Growth YTD
 

I expect our stock holdings to start outperforming the market as they mature. However, these are just our stock holdings. The entire portfolio beats the market by far thanks to monetizing those positions.

Our 10-year goal is to grow this account to $1,000,000.00 value in ten years. We are in year two and we accomplished 7.92% of that goal.

Our 6-year goal is to reach $175,000 account value to be eligible for portfolio margin (PM) and today we accomplished 45.27% of that goal.

Our 2021 year goal is to grow this account to a $42,344.00. We already accomplished this goal.


Investing and Trading Report – Options Monthly Income

 
TW Options Income week 39
 

Investing and Trading Report – Options Annual Income


TW Options Annual Income week 39
 

Our dividend goal and future dividends


TW Received vs Projected Dividends week 39
 

We have accomplished our dividend income goal. We planned to make $1,071 of dividend income this year and we finished receiving $1,848.85. However, we accumulated enough shares to start making $3,948.98 a year.
 

TW Received vs Future Dividends week 39


Our account cumulative return


The chart below indicates our cumulative adjusted return. It shows how the last week’s selloff shook down our returns but we are recovering along with the market.
 

TW cumulative return wk 39
 

TW win ratio wk 39
 

As of today, our account cumulative return is 38.06% (note, data in this section are since March 13, 2021, only as that is the date we started tracking these metrics. Thus the results are skewed a bit and will show full picture next year.).


Conclusion of our investing and trading report


This week our options trading was within our expectations and I believe, the rest of the month will be even better.

We will continue accumulating the dividend growth stocks in our portfolio to reach 100 shares and continue building our cash reserves so we have enough cash to sustain any market corrections and be able to buy depressed stocks.

We will report our next week’s results next Saturday. Until then, good luck and good trading!


We all want to hear your opinion on the article above:
No Comments


Posted by Martin September 28, 2021
No Comments


Interest rates sending the stocks down


For the entire year of 2019, the interest rates were dropping like a rock and for the entire 2020, the rates were trading flat. That was a reason behind a great rally in 2020 when the high-flying, hi P/E tech stocks like EV stocks, innovation stocks, genomic stocks, 3D printing stocks, SPACS, and all stocks that were flying high despite making now product, having no sales, no revenue whatsoever. Only promises of future changes and disruption.

But then, early in January – February 2021 the rates started rising again sending the tech stocks and high P/E stocks to the abyss. From June to September 2021 the rates dropped and traded flat. That calmed the tech stocks market.

 
Treasuries
 

But, last few days we are seeing the interest rates spiking up again and it has had a negative impact on the stocks. Higher rates impact multiples and slash them down.

Here is a chart showing 10-years Treasuries compared to ARKK ETF and there you can see the correlation of interest rates and the fund that invests primarily into the high-flying, disruptive, but unprofitable stocks. The chart illustrates the point of interest rates impacting the PE and sending stocks down.

 
Treasuries
 

As long as the rates keep rising, expect pressure on the stock market and a downward move.


We all want to hear your opinion on the article above:
No Comments


Posted by Martin September 25, 2021
No Comments


2021 Week 38 investing and trading report


The month is almost over and it was a bumpy one for sure. But our account survived the market weakness with flying colors as you will be able to see in this weekly investing and trading report.
At first, when the September selling started and mainly continued for two weeks and even spilled in the third week, I was not sure what to think about. Everyone out there was freaking out and selling. People were predicting the end of the world (and they still are) yet we only saw a barely 5% decline. It was difficult to keep your head clear and think. What is the reason for selling? And how does it affect the market?

You know me, I keep saying that the market follows earnings. It doesn’t care about anything else. And if any news or event out there rocks the market, you need to look at the earnings. Was it affected? Or could it be affected? If not, ignore that news and consider the selling to be just a dip you can ignore (and buy). So when the sky was falling, I was checking what the analysts and businesses were doing about their outlooks and estimates. I only found two companies issuing their earnings warnings last week. Two! Out of, what, ten thousand? Fifty thousand? A million? Two companies do not make the US economy. Everybody else held their ranks. It started to be obvious that this selling was just a dip. No matter how scary it may have appeared.


Here is our investing and trading report:


Account Value: $81,490.42 -$152.39 -0.19%
Options trading results
Options Premiums Received: $2,909.00    
01 January 2021 Options: $4,209.00 +16.65%  
02 February 2021 Options: $4,884.00 +15.41%  
03 March 2021 Options: $5,258.00 +12.79%  
04 April 2021 Options: $2,336.00 +4.30%  
05 May 2021 Options: $6,346.00 +9.22%  
06 June 2021 Options: $4,677.00 +6.37%  
07 July 2021 Options: $3,865.00 +5.14%  
08 August 2021 Options: $6,133.00 +7.40%  
09 September 2021 Options: $1,177.00 +1.44%  
Options Premiums YTD: $38,885.00 +44.07%  
Dividend income results
Dividends Received: $49.00    
01 January 2021 Dividends: $53.04    
02 February 2021 Dividends: $63.00    
03 March 2021 Dividends: $30.31    
04 April 2021 Dividends: $139.70    
05 May 2021 Dividends: $167.45    
06 June 2021 Dividends: $168.56    
07 July 2021 Dividends: $228.62    
08 August 2021 Dividends: $780.09    
09 September 2021 Dividends: $130.74    
Dividends YTD: $1,802.99    
Portfolio metrics
Portfolio Yield: 4.59%    
Portfolio Dividend Growth: 8.13%    
Ann. Div Income & YOC in 10 yrs: $18,571.43 18.22%  
Ann. Div Income & YOC in 20 yrs: $157,914.52 154.91%  
Ann. Div Income & YOC in 25 yrs: $732,878.63 718.92%  
Ann. Div Income & YOC in 30 yrs: $5,419,297.84 5,316.07%  
Portfolio Alpha: 40.39%    
Portfolio Weighted Beta: 0.70    
CAGR: 645.31%    
AROC: 48.77%    
TROC: 15.59%    
Our 2021 Goal
2021 Dividend Goal: $1,071.42 168.28% Accomplished
2021 Portfolio Value Goal: $42,344.06 192.45% Accomplished

I love selling days as we saw in the last three weeks. I make most of my money these days. I usually adjust my trades to release my buying power as the stocks decline and my put side of the trades got in danger and that is when I make a lot of money. And when the stocks start recovering, I roll again, this time higher, and make more money. That’s why I could make a $2,909.00 premium this week and offset last week’s negative premium that happened when I bought SPY LEAPS. Now I have a positive options premium income to report and hold SPY LEAPS that will make me tons of money long term.


Dividend Investing and Trading Report

 
Our net-liquidating value got a hit last week when the market tanked. We dropped to $75k from $82k. That was an 8.5% dip, more than the market. The market dipped 5.4% only. But I didn’t flinch, held my positions, and more importantly continued buying more shares. That will pay a lot in the future!

As I mentioned above, we have received a great deal of options premiums when adjusting the positions. We were also reopening the expired positions last week. We still have a few positions to reopen but I have to wait for the buying power to rise to be able to start opening those new trades. My rules – see below about these rules.

Our dividend income got smaller than expected. Looks like, we have received all the dividend income in August and very little in September. Either, I have my tracking of dividend income wrong, or this was just an anomaly this season. I will leave it for now. The truth is, we only made $49 in dividends totaling $130 for September. Our expectation was to receive $411 in September.

Here are our stock holdings that contribute to our dividend income:

 
Annual Dividend Payout week 38
 

Options Investing and Trading Report

 
Last week we rolled AAPL, BA, OMF, PMT, OXY, AXP, MU, XOM, BABA, and AES strangles. All trades delivered great premiums while kept our buying power positive at all times. No margin call whatsoever.

We also opened new strangles against trades that expired last week, such as AES, MU, KBE, DKNG, OXY, and OMF.


You can watch all our trades in this spreadsheet. You can watch the spreadsheet and look for a “NEW” indication next to the trading date. When the indicator shows up, it is typically good for up to 3 days to follow that trade.
 

Expected Future Dividend Income

 
Our dividend income was slower last week. We received $49 only for dividends but I am still happy with it. We are in an accumulation phase so I do not care much about the total amount of dividends I am receiving. I am building the portfolio and I know it will bring fruits later.

 
Our projected annual dividend income in 10 years is $18,571.43 but that is if we do absolutely nothing and let our positions grow on their own.

We are also set to receive a $4,404.54 annual dividend income. We are 24.20% of our 10 year goal!

 
Future Divi on YOC week 38
 

The chart above shows how our future dividend income is based on the future yield on cost and what dividend income we may expect in the future. The expected dividend growth depends on what stocks we are adding to our portfolio and the stocks’ 3 years average dividend growth rate. It is interesting to see what passive income we may enjoy 10, 20, 25, or 30 years from now.


Market value of our holdings

 
Last week we aggressively bought shares that would ensure the future growth of our portfolio. We want growth that would outperform SPY and deliver great income. So we added SSO and SPXL leveraged ETFs into our portfolio and started accumulating these funds. It is a risky proposition but profitable in the long run. I made a goal to accumulate 25% of our portfolio in these funds and accumulate whenever they drop below 25% and sell anything above 25% and reinvest the proceeds elsewhere.

I am also accumulating SPY LEAPS but LEAPS are expensive so we have to wait to save cash first. Unfortunately, the LEAPS do not contribute to our stock holdings performance so it looks like they do not exist.

And of course, we keep accumulating dividend growth stocks, high yield dividend stocks, and growth stocks to boost the portfolio growth.

I used to accumulate cash in the ICSH fund but realized that it is a waste of money to keep a large holding in this fund making only a little above the savings account. Therefore, I split our holdings between ICSH and SPY. We still will be saving cash in the ICSH fund but also in the SPY ETF.

Our non-adjusted stock holdings market value increased from $106,589.22 to $109,309.61.

We still expect the value of our holdings to grow and outperform the market long term. Many positions in our portfolio are new and “young” and they did not have enough time to show gains yet. We were building cash reserves to buy depressed stocks during selloffs and corrections as well as negative analysts reports (as long as the company is still good long term).

 
Stock holdings week 38
 

Our goal is to accumulate 100 shares of each stock of our interest and we are getting to that goal.
 

Investing and trading ROI


Our options trading delivered a 1.44% monthly ROI in September 2021, totaling a 47.72% ROI YTD. We again exceeded our 45% annual revenue selling options against dividend stocks target!

Our account grew by 296.12% beating our projections and the market.
 

Our options trading averaged $4,320.56 per month this year. If this trend continues, we are on track to make $51,846.67 trading options in 2021. As of today, we have made $38,885.00 trading options. This was an increase from previous weeks and months.
 

Old SPX trades repair


This week, we didn’t adjust any SPX trades. Our goal is to reach a level that we will be eligible for portfolio margin (PM). Once that happens, we plan on converting the existing SPX Iron Condors to strangles and trade these positions as strangles.

With RegT margin, the capital requirements would be approx. $66,586.06 and that is beyond our means. With PM the requirement for margin would drop to around $10k. That is doable in our account. Once we reach this level, we will start adjusting our SPX trades accordingly. Until then, we will just roll these trades around.


Accumulating Growth Stocks


We started accumulating SPXL and SSO leveraged ETFs. We were stopped out last week but we bought back in when the stocks dropped further. So we are in these positions on a cheaper cost basis. We will continue purchasing these funds and we hope and plan to raise holdings in these stocks to 25% of our entire portfolio.

Once we reach that level, we will be trimming our position in SSO and SPXL if they exceed the 25% mark (price appreciation) or buy more when they drop below the 25% mark. As of today, we hold 5.48% of our net-liq in these shares.

We also added shares of AAPL to our current holdings.


Accumulating Rules


I still have issues with the rules when managing our portfolio. It is simple and easy to set the rules and say “stick to it”. But it is difficult to do so. I created a spreadsheet to track my portfolio, my trading, and my stock accumulation process. Yet I have a hard time sticking to the rules. What am I doing wrong?

I was thinking about it and realized I may have been making mistakes. I set up goals, but I set up too many of them. Then it is hard to follow them and hard to focus on them. And my mind and habits are not trained for it. I am not trained to keep a single rule!

So, I need to break those rules to even smaller tasks and focus on only one task.

The task for this season then is to trade only strangles against trades I have already open. Reopen them only when they expire (rolling to protect them is OK) and maintain my buying power at or above $2,000 at all times. At the end of any trading session, my BP must be above that level.


Accumulating Dividend Growth Stocks


Last week, we didn’t add any new dividend growth stocks.

In the upcoming weeks, we will continue to accumulate the higher yield income stocks to boost our income and reinvest the proceeds but following our accumulation rules as described in the above section.

Our goal is to reach 100 shares of high-quality dividend stocks and build a weekly dividend income as per this calendar, but we have made no changes to this goal last week:
 

Weekly dividends income calendar
 
You can see the entire spreadsheet here.


Market Outlook


The stock market sold off again on Monday last week but on Tuesday the market printed an inverted hammer. That is typically a reversal hammer if followed through. Given that the market underlying fundamentals haven’t changed, I realized that the selling was over.
 

SPX prediction next week

 
And sure enough. In the next three trading sessions, we had a strong rally. On Friday the rally was a bit muted but I think it will continue in the next few weeks and end of the year despite people still refusing to believe it and waiting for a correction that may never come.
 

SPX prediction next week

 
So what is our expectation for the future? This secular bull market has not ended and it will not end for a long time. The stock market follows earnings and earnings estimates for the rest of the year are another 28% growth for 3Q and 21% for 4Q. The recent selloff hasn’t changed that outlook.

Recently, Ryan Detrick posted on Twitter about the December lows indicator:

As we noted at the end of Q1 when the S&P 500 doesn’t violate the December lows in Q1, the rest of the yr is usually extremely strong (higher 94.3% of the time). In fact, for the full yr, the SPX is up an average of 18.4% when the Dec low isn’t violated in Q1. The S&P 500 is up 18.5% YTD.

Other technical analysts I follow agree with this outlook and predict this market to continue higher. Here is what Chirs Ciovacco posted in his weekly Youtube videos (great work by the way):
 

SPX prediction next week

 
From this table above you may want to be open for further run upwards. The same expectation was provided by Tom Lee recently in his interview with CNBC.

Bank of America also issued its prediction for next year’s earnings. They predict 30% growth. That has not been revised recently. Thus you may expect a bullish outcome in the near future.

My expectation for the next week is that S&P 500 will reach $4,500 again.
 

If you want to learn more about the stock market, events that moved the market last week and will likely impact it in the near future, I recommend you to subscribe to our weekly newsletter. Knowing where the market is heading and knowing when you should expect its reversal can benefit your trading and investing. Subscribe and you get one month free.


Investing and trading report in charts


Account Net-Liq


TW Account Net-Liq week 36


Account Stocks holding

 
TW Account holdings week 38
 

Our stock holdings still do not beat the market but I am positive that the growth will pick up and exceeds the market. We just need time and continue reinvesting the proceeds. S&P 500 grew 54.02% since we opened our portfolio while our portfolio grew 22.89% only. On YTD basis, the S&P 500 grew 24.18% and our portfolio 15.91%.

But the numbers above apply to our stock holdings in our account, not the overall account net-liq growth. Our overall account beats the market growing by 296.12%!
 

Stock holdings Growth YTD

 
TW Account holdings Growth YTD
 

I expect our stock holdings to start outperforming the market as they mature. However, these are just our stock holdings. The entire portfolio beats the market by far thanks to monetizing those positions.

Our goal is to grow this account to $1,000,000.00 value in ten years. We are in year two and we are accomplishing this goal by 8.15%.
Our goal is to grow this account to a $42,344.00 value in 2021. We already accomplished this goal.


Investing and Trading Report – Options Monthly Income

 
TW Options Income week 38
 

Last week, we bought SPY LEAPS, and the chart showed a negative September. Thanks to the selloff in the market last week, we rolled many trades and generated large income that fully offset last week’s negative report. We are in a positive income again.
 

Investing and Trading Report – Options Annual Income


TW Options Annual Income week 38
 

Our dividend goal and future dividends


TW Received vs Projected Dividends week 38
 

We have accomplished our dividend income goal. We planned to make $1,071 of dividend income this year and we finished receiving $1,802.99. However, we accumulated enough shares to start making $4,404.54 a year.
 

TW Received vs Future Dividends week 38


Our account cumulative return


The chart below indicates our cumulative adjusted return. It shows how the last week’s selloff shook down our returns but we are recovering along with the market.
 

TW cumulative return wk 38
 

TW win ratio wk 37
 

As of today, our account cumulative return is 42.01% (note, data in this section are since March 13, 2021, only as that is the date we started tracking these metrics. Thus the results are skewed a bit and will show full picture next year.).


Conclusion of our investing and trading report


This week our options trading was within our expectations and I believe, the rest of the month will be even better.

We will continue accumulating the dividend growth stocks in our portfolio to reach 100 shares and continue building our cash reserves so we have enough cash to sustain any market corrections and be able to buy depressed stocks.

We will report our next week’s results next Saturday. Until then, good luck and good trading!


We all want to hear your opinion on the article above:
No Comments


Posted by Martin September 23, 2021
1 Comment


Why selling is over, at least for now


Yesterday, I posted why selling is over on Reddit. Moderators deleted that post later during the day and I do not know why. I can only assume that it was because the post sparked so much controversy, mockery, and hatred from other users.

 
“Yesterday, we got an inverted hammer. That is typically a reversal candle. Today’s strong follow-up can become a recovery. If we survive FED today and tomorrow we have a follow-through, this 5% pullback is done for now.”

 
Inverted hammer
 

That simple post caused a lot of controversy and mockery. The users were telling me that the selling hasn’t started yet and it is all coming, some were comparing my note about the inverted hammer to astrology (“inverted hammer aligned with Mercury and Venus will not stop selling), markets are due for a selloff, people rely on technical analysis too much, and many other responses that indicated to me that those who were reacting didn’t understand the market and forces that move it.
 

I was thinking about it and decided to address some of those responses and indicate why I think this selling is really over. Of course, there still may be some sort of black swan news or any other event that may reverse the course of the market and it still can go down but I think it is very unlikely.
 

Here are my thoughts on each argument and why this selling is over:
 

The selling is not over yet, it has not started yet

 
I have seen this argument from many investors and traders who are anticipating more selling to come. The market has been selling off for 20 days now. Yet it was not able to crash. There is simply no catalyst or fundamental reason for the market to tank. If there was an underlying fundamental problem, the market would already tank hard. Yet, for the last 20 days, it was wobbling around a 5% decline.

In March last year, the market lost 30% in 20 days. This year, we barely got 5%. This indicates that bulls and long-term investors didn’t see any problem and decided to hold their positions and didn’t join the selling spree.
 

The market is overvalued and long, long, long due for a large correction

 
Yes, the market is overvalued but it is not an issue. The valuation is caused by FED’s easy money, not by the exuberance of the market participants. The market can stay overvalued for years (in fact, it will as long as FED keeps interest rates down). But generally, the market follows earnings, not a P/E value, and as long as earnings are growing and estimates are in positive territory, the market will not care about valuation. It will care about it once FED raises the rates or earnings will start going down. As of today, earnings estimates are pointing to 30% growth next year. I only found two companies issuing warnings about their future earnings. That still doesn’t mean the market will crash.
 

P/E of S&P 500 is at historical levels

 
P/E… the favorite mantra of the bears. But the P/E is only one part of an equation. The second part is earnings. If you are a subscriber to my weekly newsletter, I write about my market outlook every week and show the relationship between the P/E and earnings to come up with the market valuation.

But moreover, looking at the current P/E, you are referring to ancient history. That P/E has been derived from historical data, from the past, from something that no longer exists. The market doesn’t care about history. It cares about the future. Today’s P/E is irrelevant.

The same goes with the Schiller P/E. It is a moving average of the multiple P/Es. And looking at it and saying: “market is overvalued and will crash” is like looking at 50-day MA and say the market will go up because the price is above the 50-day MA. Although it may go up, the moving average doesn’t have a predictive function as well as P/E doesn’t possess such predictive power.
 

FED

 
Another indication of this selling end is FED and the recent FOMC meeting notes released yesterday. Our friendly neighbor Jerome-man indicated 6 to 7 interest hikes by 2024. And the market didn’t flinch! Remember when Powell said that they would raise the rates in 2018 and the market tanked? Trump was furious at that time and was even thinking of replacing Powell for it. Today, the market ended the session with a 1.3% rally.
 

Wait for FED tapering and interest rates hike!

 
As I said above, FED announced the rates hikes. Six or seven of them! But will they actually do it?

This indicates one thing and that is that the FED expects our economy to prosper. It sees it as in good shape and growing through 2024. That alone will prop the markets for the near future, or at least until the FED actually raises the rates. So far, they have been talking about tapering and raising the rates since 2009. They were setting all sorts of limits after which they will do it. For example, Janett Yellen was talking for years about raising the rates once inflation hits the 2% mark. Today, inflation is at a 5%+ mark. So here came the “transitory” explanation to excuse no tapering and no rates raise (although I think this inflation is really transitory; I agree with Lacy Hunt on this).

So will FED do it and raise the rates? I personally doubt it. I think FED is scared itself of any market selloffs and they will do whatever it takes to make the markets flow above the water and step in every time the market’s boat gets shaky.
 

What’s next?

 
I do not rely on technical analysis only. I, in fact, suck in technical analysis. But when I saw the market printing the inverted hammer candle and knowing these fundamental relationships of the P/E, earnings, the reluctance of further selling from investors, I realized that this selling was finally over.

It doesn’t mean that there will be no more selling in the future. No, we may see another selloff next week, or next month (but most likely next year). I do not have a crystal ball to predict the next selloff (I wish I had one) but I can say with certainty that this particular selling is done. Expect a path to recovery.

I like to follow Chris Ciovacco and his weekly market analysis. He does a great job identifying past occurrences of what is happening today (or similarities). In his last video he identified similar market trends since 1950 up to today and he looked at what happened next and compared it with what is happening today.

Although this is not a prediction, it can set one’s expectations of a possible future outcome.

 
SPX historical trends
 

Can this outcome change and be different from those similar past occurrences? Of course, it can. There is no guarantee to it. As an old adage says, past performance is not a guarantee of the future outcome. But this adage is a CYA note from the brokers and investment advisors to protect themselves while the market and its behavior are about human psychology. And humans repeat themselves very often.


We all want to hear your opinion on the article above:
1 Comment


Posted by Martin September 18, 2021
No Comments


2021 Week 37 investing and trading report


Two weeks of weakness and selling in September are behind us. It was interesting to see the indecisiveness of the markets and a constant battle between bears and bulls. But the bears-bulls war is not over yet. We need to see who will win the final battle. What we experienced was that all rallies were sold but shortly it turned around and all drops were bought, just to turn around again and see, once again, all rallies sold. In this investing and trading report, we will once again review our results and plans for the next upcoming weeks.

This week’s investing and trading was successful despite the selling in Wall Street and that the numbers in this report may not indicate it. Let’s look at the numbers first:


Here is our investing and trading report:


Account Value: $81,642.81 $844.16 1.04%
Options trading results
Options Premiums Received: -$3,112.00    
01 January 2021 Options: $4,209.00 +16.65%  
02 February 2021 Options: $4,884.00 +15.41%  
03 March 2021 Options: $5,258.00 +12.79%  
04 April 2021 Options: $2,336.00 +4.30%  
05 May 2021 Options: $6,346.00 +9.22%  
06 June 2021 Options: $4,677.00 +6.37%  
07 July 2021 Options: $3,865.00 +5.14%  
08 August 2021 Options: $6,133.00 +7.40%  
09 September 2021 Options: -$1,732.00 -2.12%  
Options Premiums YTD: $35,976.00 +44.07%  
Dividend income results
Dividends Received: $38.43    
01 January 2021 Dividends: $53.04    
02 February 2021 Dividends: $63.00    
03 March 2021 Dividends: $30.31    
04 April 2021 Dividends: $139.70    
05 May 2021 Dividends: $167.45    
06 June 2021 Dividends: $168.56    
07 July 2021 Dividends: $228.62    
08 August 2021 Dividends: $780.09    
09 September 2021 Dividends: $81.74    
Dividends YTD: $1,753.99    
Portfolio metrics
Portfolio Yield: 4.61%    
Portfolio Dividend Growth: 8.13%    
Ann. Div Income & YOC in 10 yrs: $18,193.65 18.37%  
Ann. Div Income & YOC in 20 yrs: $155,736.41 157.24%  
Ann. Div Income & YOC in 25 yrs: $726,662.32 733.67%  
Ann. Div Income & YOC in 30 yrs: $5,412,297.37 5,464.52%  
Portfolio Alpha: 36.59%    
Portfolio Weighted Beta: 0.72    
CAGR: 657.65%    
AROC: 44.65%    
TROC: 15.13%    
Our 2021 Goal
2021 Dividend Goal: $1,071.42 163.71% Accomplished
2021 Portfolio Value Goal: $42,344.06 192.81% Accomplished

Our Net-Liq (net liquidating value) actually went up by 1.04% despite the markets selling and losing -1.16% last week.

Since I believe, this bull market is not over yet and soon we will see a year-end rally, we bought SPY LEAPS last week. That had an impact on our premiums income. Normally, we sell options for income, but from time to time we purchase options, LEAPS are one of them. In the table above, we see our options income be negative -$1,732.00 and that we lost -$3,112.00 this week. But that is skewed by the options purchase. SPY options are expensive. We bought LEAPS worth over $5,000 last week. Without SPY LEAPS purchase, our income would be +$1,956 this week landing overall September income at $3,336.


Dividend Investing and Trading Report

 
Our Net-Liq (net liquidating value) actually went up by 1.04% despite the markets selling and losing -1.16% last week.

Since I believe, this bull market is not over yet and soon we will see a year-end rally, we bought SPY LEAPS last week. That had an impact on our premiums income. Normally, we sell options for income, but from time to time we purchase options, LEAPS are one of them. In the table above, we see our options income be negative -$1,732.00 and that we lost -$3,112.00 this week. But that is skewed by the options purchase. SPY options are expensive. We bought LEAPS worth over $5,000 last week. Without SPY LEAPS purchase, our income would be +$1,956 this week landing overall September income at $3,336.

Our dividend income was consistent and as expected. We expect it to continue in the near future and actually grow.

Here are our stock holdings that contribute to our dividend income:

 
Annual Dividend Payout week 37
 

Options Investing and Trading Report

 
Last week we rolled CROX strangle. It was a great opportunity to roll it as the stock jumped up strong and premiums were inflated. We adjusted that trade slightly and received $1,447 in premiums. We also rolled WEN trade as the stock continued slipping down and our put option was at the money. We lowered the trade and centered the stock price in between our strikes.

The rest of the week we only closed old trades that were about to expire that week anyway.

We took an opportunity of the selling market and bought 853 DTE SPY LEAPS. I believe, this bull market is not over and that after this selling it will go up again. We just need to survive the September and October volatility and fear. If the market slips even more than what we experienced in the last two weeks, I am prepared to buy more LEAPS down the road.

We also sold short calls against the LEAPS to generate income and we plan to sell covered calls (converting our trade to a PMCC (poor man’s covered call).


You can watch all our trades in this spreadsheet. You can watch the spreadsheet and look for a “NEW” indication next to the trading date. When the indicator shows up, it is typically good for up to 3 days to follow that trade.
 

Expected Future Dividend Income

 
As the table at the beginning of this report indicates, our aggressive dividend growth stocks accumulation is showing significant progress in our current and future dividends income. Our portfolio dividend yield and dividend growth will be bringing us almost $155,736.41 in 20 years and $5,412,297.37 in 30 years. It looks a bit unrealistic, but I verified the formula behind calculating the future value several times and got the same results. Nevertheless, I wish, I had that $5.4 million income now. But that is the fate of dividend growth investing. It is not a quick rich scheme and building an account takes time.

We will keep aggressively accumulating dividend growth stocks to generate liveable income sooner than in 20 years. And the portfolio is starting to show this to be happening. In just 10 years, we will start receiving $18,193.65 in today’s dollars. It is not bad considering that in March 2021 it was only $3,202.52 in projected future dividends.

 
Our projected annual dividend income in 10 years is $18,193.65 but that is if we do absolutely nothing and let our positions grow on their own.

We are also set to receive a $4,402.62 annual dividend income. We are 24.20% of our 10 year goal!

 
Future Divi on YOC week 37
 

The chart above shows how our future dividend income is based on the future yield on cost and what dividend income we may expect in the future. The expected dividend growth depends on what stocks we are adding to our portfolio and the stocks’ 3 years average dividend growth rate. It is interesting to see what passive income we may enjoy 10, 20, 25, or 30 years from now.


Market value of our holdings

 
We were not buying any new stock positions last week. We only re-allocated some of our holdings. We used ICSH to save money but later on, I realized that I was holding too much cash in that fund that makes no money, and long term, SPY investment will be a better cash holder than ICSH despite potential future market drops, selloffs, and recessions (remember, we have extremely friendly FED).

Therefore, I split our holdings between ICSH and SPY. We still will be saving cash in the ICSH fund but also in the SPY ETF.

Our non-adjusted stock holdings market value decreased from $115,443.70 to $106,589.22. This was caused by reallocating ICSH (a stock holding) into SPY LEAPS (options holding) plus market valuation decrease.

We still expect the value of our holdings to grow and outperform the market long term. Many positions in our portfolio are new and “young” and they did not have enough time to show gains yet. We were building cash reserves to buy depressed stocks during selloffs and corrections as well as negative analysts reports (as long as the company is still good long term). We used those reserves last week to buy LEAPS. If the market continues down in the next few weeks, we may use more reserves.

 
Stock holdings week 37
 

Our goal is to accumulate 100 shares of each stock of our interest and we are getting to that goal.
 

Investing and trading ROI


Our options trading delivered a -2.12% monthly ROI in September 2021, totaling a 44.07% ROI YTD. That dropped below our 45% annual revenue selling options against dividend stocks target!

Our account grew by 296.86% beating our projections and the market.
 

Our options trading averaged $3,997.33 per month this year. If this trend continues, we are on track to make $47,968.00 trading options in 2021. As of today, we have made $35,976.00 trading options. This was a decrease from previous weeks and months but again, that was due to options purchases.
 

Old SPX trades repair


This week, we didn’t adjust any SPX trades. Our goal is to reach a level that we will be eligible for portfolio margin (PM). Once that happens, we plan on converting the existing SPX Iron Condors to strangles and trade these positions as strangles.

With RegT margin, the capital requirements would be approx. $66,586.06 and that is beyond our means. With PM the requirement for margin would drop to around $10k. That is doable in our account. Once we reach this level, we will start adjusting our SPX trades accordingly. Until then, we will just roll these trades around.


Accumulating Growth Stocks


We started accumulating SPXL and SSO leveraged ETFs. We were stopped out last week but we bought back in when the stocks dropped further. So we are in these positions on a cheaper cost basis. We will continue purchasing these funds and we hope and plan to raise holdings in these stocks to 25% of our entire portfolio.

Once we reach that level, we will be trimming our position in SSO and SPXL if they exceed the 25% mark (price appreciation) or buy more when they drop below the 25% mark.


Accumulating Rules


I have two issues I need to focus on and improve. One is financial discipline. I tend to jump in buying new positions, accumulating stocks, despite not having enough buying power. Sometimes I get so enthusiastic that I simply go and buy. But then the market turns around and my positions start hurting me. Although I had cash reserves in the ICSH that I could sell and release the BP, I do not want that situation of receiving a maintenance call that has happened last week.

My second issue is that I am aspiring to start trading for a living. And at this point, all my income is tight to the open positions and cannot be withdrawn. That is not good if I want to live on that income. This is because I immediately reinvest and reopen the expired positions. This needs to be addressed in my trading so my income will be available to withdraw when I start trading for a living.

I have a plan for both dividend and growth stocks accumulation and options trading to address these two topics mentioned above. I also need to force myself to follow those rules strictly (I am violating them recently).


Stocks Accumulating Rules


The rule is to buy dividend or growth stocks using only 20% of any available BP that is above the minimum limit. The current minimum BP limit for September is $2,000. That is the amount which must be available at all times. I can buy stocks worth 20% of any amount above this limit.

Today, the BP is $1,324.00, $676 below the limit.


Options Trading Rules


Trading options will follow the same rules as accumulating stocks. But because trading options is our main income-generating strategy, this will actually be a strategy setting our BP limits.

We will be reopening trades that expire every month but only if the BP is above the limit and reopening new trades won’t drop the BP below the limit. If a new trade would cause the BP to drop below the limit, the trade can not be reopened and we will have to wait for the market or stocks appreciation or income from already opened trades to generate more income. We will be raising the limit every three months by $1,000 to build cash reserves.


Accumulating Dividend Growth Stocks


Last week, we didn’t add any new dividend growth stocks.

In the upcoming weeks, we will continue to accumulate the higher yield income stocks to boost our income and reinvest the proceeds but following our accumulation rules as described in the above section.

Our goal is to reach 100 shares of high-quality dividend stocks and build a weekly dividend income as per this calendar, but we have made no changes to this goal last week:
 

Weekly dividends income calendar
 
You can see the entire spreadsheet here.


Market Outlook


The stock market sold off again last week. There is a lot of fear and uncertainty out there. Many people and analysts are suddenly bearish, while just two weeks ago they were bullish. But this fear and selling could be expected. Historically, we can see up to an 8% drop. On average, the markets drop just 3% though. The 6% and 8% were extremes that occurred only two times in the past in similar markets like today.

People and investors are worried about Covid, economic slowdown, FED tapering, and taxes increase. In my opinion, none is an issue but the markets sometimes freak out about nonissues. Today, it all seems to be an issue, tomorrow, it will be a nonissue.

In this market state of indecision, it is hard to say where the market will go next. We are still in an uptrend but we are starting to see some technical damage to the trend. It can be just a bear trap, but it may spill into more selling. The issue here is that many people who were buying the dips before are no longer buying the dips and waiting for a bigger drop, (source: Vanda Research). Well, we have to wait for the markets to calm down and big money to start buying again. Retails will follow.

My expectations are the same as in previous weeks. I do not think we will see a large drop. We do not have a reason for it. There is no fundamental economic catalyst for it (it may change though but it has not changed yet). Instead, I think, this market will drift. It could be adrift down, or sideways. My expectation for the week ahead is unclear. I see no clear path or conviction. We closed below the 50-day MA and that can spike more selling next week, or computers may jump in next week and start buying. We need to sit tight and wait for the market’s decision.
 

SPX prediction next week


If you want to learn more about the stock market, events that moved the market last week and will likely impact it in the near future, I recommend you to subscribe to our weekly newsletter. Knowing where the market is heading and knowing when you should expect its reversal can benefit your trading and investing. Subscribe and you get one month free.


Investing and trading report in charts


Account Net-Liq


TW Account Net-Liq week 36


Account Stocks holding

 
TW Account holdings week 37
 

Our stock holdings still do not beat the market but I am positive that the growth will pick up and exceeds the market. We just need time and continue reinvesting the proceeds. S&P 500 grew 53.25% since we opened our portfolio while our portfolio grew 21.98% only. On YTD basis, the S&P 500 grew 23.40% and our portfolio 15.00%. We actually did better this week than the market.

But the numbers above apply to our stock holdings in our account, not the overall account net-liq growth. Our overall account beats the market growing by 296.86%!
 

Stock holdings Growth YTD

 
TW Account holdings Growth YTD
 

I expect our stock holdings to start outperforming the market as they mature. However, these are just our stock holdings. The entire portfolio beats the market by far thanks to monetizing those positions.

Our goal is to grow this account to $1,000,000.00 value in ten years. We are in year two.


Investing and Trading Report – Options Monthly Income

 
TW Options Income week 37
 

The chart above shows September negative due to purchasing options LEAPS. We will gain more income when those LEAPS appreciate over time and we start rolling them.
 

Investing and Trading Report – Options Annual Income


TW Options Annual Income week 37
 

Our dividend goal and future dividends


TW Received vs Projected Dividends week 37
 

We have accomplished our dividend income goal. We planned to make $1,071 of dividend income this year and we finished receiving $1,753.99. However, we accumulated enough shares to start making $4,401.22 a year.
 

TW Received vs Future Dividends week 37


Our account cumulative return


The chart below indicates our cumulative adjusted return. It shows how the last week’s selloff shook down our returns but we are recovering along with the market.
 

TW cumulative return wk 37
 

TW win ratio wk 37
 

As of today, our account cumulative return is 42.28% (note, data in this section are since March 13, 2021, only as that is the date we started tracking these metrics. Thus the results are skewed a bit and will show full picture next year.).


Conclusion of our investing and trading report


This week our options trading was within our expectations and I believe, the rest of the month will be even better.

We will continue accumulating the dividend growth stocks in our portfolio to reach 100 shares and continue building our cash reserves so we have enough cash to sustain any market corrections and be able to buy depressed stocks.

We will report our next week’s results next Saturday. Until then, good luck and good trading!


We all want to hear your opinion on the article above:
No Comments


Posted by Martin September 11, 2021
No Comments


2021 Week 36 investing and trading report


The second week of September turned out to be a volatile month. After the markets hit the new all-time high last week, we lost ground and retreated. I tried to find any information on why the markets went down but the only reason I could find was the economy and Covid fear. As I will write in this week’s investing and trading report, it had some impact on our account but not very much. And if you are a subscriber to our weekly newsletter, I will be writing in my weekly newsletter why I think this fear is unjustified and selling will possibly end sometimes soon.

The selloff in the market had an impact on our net-liquidating value that dropped -2.50% over the week while the S&P 500 lost -1.90% only. From that perspective, the market’s loss is a blip. We made only $5.71 in dividends and $911.00 in options premiums.


Here is our investing and trading report:


Account Value: $80,798.65 -$2,073.20 -2.50%
Options trading results
Options Premiums Received: $911.00    
01 January 2021 Options: $4,209.00 +16.65%  
02 February 2021 Options: $4,884.00 +15.41%  
03 March 2021 Options: $5,258.00 +12.79%  
04 April 2021 Options: $2,336.00 +4.30%  
05 May 2021 Options: $6,346.00 +9.22%  
06 June 2021 Options: $4,677.00 +6.37%  
07 July 2021 Options: $3,865.00 +5.14%  
08 August 2021 Options: $6,133.00 +7.40%  
09 September 2021 Options: $1,380.00 +1.71%  
Options Premiums YTD: $39,088.00 +48.38%  
Dividend income results
Dividends Received: $5.71    
01 January 2021 Dividends: $53.04    
02 February 2021 Dividends: $63.00    
03 March 2021 Dividends: $30.31    
04 April 2021 Dividends: $139.70    
05 May 2021 Dividends: $167.45    
06 June 2021 Dividends: $168.56    
07 July 2021 Dividends: $228.62    
08 August 2021 Dividends: $780.09    
09 September 2021 Dividends: $43.31    
Dividends YTD: $1,715.56    
Portfolio metrics
Portfolio Yield: 4.90%    
Portfolio Dividend Growth: 8.13%    
Ann. Div Income & YOC in 10 yrs: $21,877.05 20.24%  
Ann. Div Income & YOC in 20 yrs: $202,734.28 187.56%  
Ann. Div Income & YOC in 25 yrs: $1,008,288.49 932.83%  
Ann. Div Income & YOC in 30 yrs: $8,181,486.64 7,569.20%  
Portfolio Alpha: 41.39%    
Portfolio Weighted Beta: 0.66    
CAGR: 668.28%    
AROC: 48.67%    
TROC: 19.41%    
Our 2021 Goal
2021 Dividend Goal: $1,071.42 160.12% Accomplished
2021 Portfolio Value Goal: $42,344.06 190.81% Accomplished


Dividend Investing and Trading Report

 
Last week, we have received a $5.71 dividends income. We have enough stock holdings to generate a $4,471.22 annual dividend income.

Last week, our dividend income reached 160.12% of our dividend income goal. We projected to receive $1,071 in dividends in 2021. Our growth was fast and we have received $1,715.56.

Accumulating ABBV as it went down on FDA warning and Biden drugs price fears had a positive impact on our overall dividend growth and future dividend income. Yes, the regulation risk is here and I might be worried but on the other hand, how many past administrations were threatening to regulate the drug market? Just the last one, the Trump administration, also pledged that they would regulate drug prices. Yet nothing has happened. The Congress is so corrupt that the strong pharmaceutical lobby would most likely have no problem buying enough votes to put any bill off the table. It has happened before, it probably will happen again. So the market is overreacting. And I am buying.

Here are our stock holdings that contribute to our dividend income:

 
Annual Dividend Payout week 36
 

Options Investing and Trading Report

 
ABBV continued its decline on FDA warning about the side effects of a drug ABBV is manufacturing. It was not the only drug warning, so I assume it was a sort of a “bulletin of everything” warning. I have not seen it or read it so not sure what it looked like that it was so horrible to spook investors to start selling ABBV. The Biden poured more oil into the fire with his drug regulation proposal and the stock nose-dived. So I had to roll ABBV strangles down to protect my put side.

We also rolled a few other trades, such as SNOW. We converted our call spread of our Iron Condor into a put spread as the stock continued higher among all the red sea of stocks out there. We turned our at-the-money spread into the in-the-money puts. These puts are now OTM.

We rolled PPL, XOM, TSN, AXP, OMF, and O strangles. Mostly to the downside. Only a PPL strangle had to be rolled up.

And lastly, we opened a new call butterfly against Verizon (VZ).

Overall, I broke all my rules last week on accumulating stocks and scaling up the trades. That got me into trouble with available buying power. With pressure out there and increasing volatility, my BP is slashed and if the selling continues next week, I might be in trouble. So, it is time to get back to follow my rules and accumulate cash.
 

You can watch all our trades in this spreadsheet. You can watch the spreadsheet and look for a “NEW” indication next to the trading date. When the indicator shows up, it is typically good for up to 3 days to follow that trade.
 

Expected Future Dividend Income

 
As the table at the beginning of this report indicates, our aggressive dividend growth stocks accumulation is showing significant progress in our current and future dividends income. Our portfolio dividend yield and dividend growth will be bringing us almost $202,734.28 in 20 years and $8,181,486.64 in 30 years. It looks a bit unrealistic, but I verified the formula behind calculating the future value several times and got the same results. Nevertheless, I wish, I had that $8.2 million income now. But that is the fate of dividend growth investing. It is not a quick rich scheme and building an account takes time.

We will keep aggressively accumulating dividend growth stocks to generate liveable income sooner than in 20 years. And the portfolio is starting to show this to be happening. In just 10 years, we will start receiving $21,877.05 in today’s dollars. It is not bad considering that in March 2021 it was only $3,202.52 in projected future dividends.

 
Our projected annual dividend income in 10 years is $21,877.05 but that is if we do absolutely nothing and let our positions grow on their own.

We are also set to receive a $4,471.22 annual dividend income. We are 20.44% of our 10 year goal!

 
Future Divi on YOC week 36
 

The chart above shows how our future dividend income is based on the future yield on cost and what dividend income we may expect in the future. The expected dividend growth depends on what stocks we are adding to our portfolio and the stocks’ 3 years average dividend growth rate. It is interesting to see what passive income we may enjoy 10, 20, 25, or 30 years from now.


Market value of our holdings

 
We were accumulating ABBV but we were also stopped out from our speculative positions. That caused our non-adjusted stock holdings market value decreasing from $118,145.31 to $115,443.70.

Despite selling, mainly stocks like ABBV and AES, it is nice to see how options help our stock holdings. Without trading options, our stock holdings would be up by $7,354.48 only. With options that offset our cost basis, our stock holdings are up by $19,124.05.

Our ABBV position would be showing -4.98% overall loss now, but monetizing the position using options we could return some of the invested capital and offset the cost basis, so ABBV is still 15.45% up! And AES would be down -9.33% but with options, we are up 68.74%.

However, over time, we expect the value of our holdings to grow and outperform the market. We are also building cash reserves to buy depressed stocks during selloffs and corrections as well as negative analysts reports (as long as the company is still good long term). We didn’t have to use those reserves yet.

 
Stock holdings week 36
 

Our goal is to accumulate 100 shares of each stock of our interest and we are getting to that goal.
 

Investing and trading ROI


Our options trading delivered a 1.71% monthly ROI in September 2021, totaling a 48.38% ROI YTD. We exceeded our 45% annual revenue selling options against dividend stocks target!

Our account grew by 292.75% beating our projections and the market.
 

Our options trading averaged $4,343.11 per month this year. If this trend continues, we are on track to make $52,117.33 trading options in 2021. As of today, we have made $39,088.00 trading options. We are reaching our projected annual options income. Also, this is the largest options income we have ever achieved. So, now will be time to preserve that income.
 

Old SPX trades repair


This week, we didn’t adjust any SPX trades. Our goal is to reach a level that we will be eligible for portfolio margin (PM). Once that happens, we plan on converting the existing SPX Iron Condors to strangles and trade these positions as strangles.

With RegT margin, the capital requirements would be approx. $66,586.06 and that is beyond our means. With PM the requirement for margin would drop to around $10k. That is doable in our account. Once we reach this level, we will start adjusting our SPX trades accordingly. Until then, we will just roll these trades around.


Accumulating Growth Stocks


We started accumulating SPXL and SSO leveraged ETFs. But because these ETFs can be also very damaging to the downside, we placed a stop loss to protect our account. On Friday last week, the stop losses were hit and we were out of the positions with a small loss. If the selling continues next week, we will sit tight. But if it stops, we may reenter those positions.

We also closed our GBOX position as it no longer fits our investing narrative.


Accumulating Dividend Growth Stocks


Last week, we added another 10 shares of ABBV taking the advantage of the stock’s selloff.

In the upcoming weeks, we will continue to accumulate the higher yield income stocks to boost our income and reinvest the proceeds but within our share purchasing plan for the rest of the year (see above section).

Our goal is to reach 100 shares of high-quality dividend stocks and build a weekly dividend income as per this calendar, but we have made no changes to this goal last week:
 

Weekly dividends income calendar
 
You can see the entire spreadsheet here.


Market Outlook


The market retreated sooner than I expected but it still holds its uptrend intact. I am still bullish on the stocks. But it may be a bumpy road. I am still maintaining the $4,570 price target for September.
 

SPX prediction next week


If you want to learn more about the stock market, events that moved the market last week and will likely impact it in the near future, I recommend you to subscribe to our weekly newsletter. Knowing where the market is heading and knowing when you should expect its reversal can benefit your trading and investing. Subscribe and you get one month free.


Investing and trading report in charts


Account Net-Liq


TW Account Net-Liq week 36


Account Stocks holding

 
TW Account holdings week 36
 

Our stock holdings still do not beat the market but I am positive that the growth will pick up and exceeds the market. We just need time and continue reinvesting the proceeds. S&P 500 grew 54.13% since we opened our portfolio while our portfolio grew 19.85% only. On YTD basis, the S&P 500 grew 24.29% and our portfolio 12.87%.

But the numbers above apply to our stock holdings in our account, not the overall account net-liq growth. Our overall account beats the market growing by 292.75%!
 

Stock holdings Growth YTD

 
TW Account holdings Growth YTD
 

I expect our stock holdings to start outperforming the market as they mature. However, these are just our stock holdings. The entire portfolio beats the market by far thanks to monetizing those positions.

Our goal is to grow this account to $1,000,000.00 value in ten years. We are in year two.


Investing and Trading Report – Options Monthly Income

 
TW Options Income week 36
 

Investing and Trading Report – Options Annual Income


TW Options Annual Income week 36
 

Our dividend goal and future dividends


TW Received vs Projected Dividends week 36
 

We have accomplished our dividend income goal. We planned to make $1,071 of dividend income this year and we finished receiving $1,715.56. However, we accumulated enough shares to start making $4,471.22 a year.
 

TW Received vs Future Dividends week 36


Our account cumulative return


The chart below indicates our cumulative adjusted return. It shows how the last week’s selloff shook down our returns but we are recovering along with the market.
 

TW cumulative return wk 36
 

TW win ratio wk 35
 

As of today, our account cumulative return is 40.81% (note, data in this section are since March 13, 2021, only as that is the date we started tracking these metrics. Thus the results are skewed a bit and will show full picture next year.).


Conclusion of our investing and trading report


This week our options trading was within our expectations and I believe, the rest of the month will be even better.

We will continue accumulating the dividend growth stocks in our portfolio to reach 100 shares and continue building our cash reserves so we have enough cash to sustain any market corrections and be able to buy depressed stocks.

We will report our next week’s results next Saturday. Until then, good luck and good trading!


We all want to hear your opinion on the article above:
No Comments


Posted by Martin September 06, 2021
No Comments


Dividend Growth Stocks to Accumulate in September 2021


Another month is beginning and here is a list of stocks we would like to focus on accumulating. We have the entire watch list of stocks we like but in that watch list, not all stocks are a buy. They are just candidates. We then narrow that list down to stocks we want to trade options against and stocks we want to be buying.


Dividend growth stocks to accumulate in September 2021


Here is the list we would like to focus on this month. It also contains our progress from previous months. We pick a stock in the list and keep buying until we reach 100 shares. This helps me to focus on the goal and not get distracted too much by other stocks and tips. Sometimes, when I have money available to invest, I get paralyzed asking myself, what am I going to buy now? This list helps me to buy stocks I previously selected as good stocks to buy.

 
September 2021 dividend growth stocks
 

We are adding Virtus InfraCap U.S. Preferred Stock ETF (PFFA) stock. The fund invests in preferred stocks. I do not have much experience in investing into preferred stocks and when doing some research I found that it can damage your investments if not done well. Since I do not have any experience, I decided to get exposure to preferred stocks via an ETF.
 

If you are interested in knowing how we select stocks to our watch list, you need to subscribe to our challenge account program where we will be explaining the process.

Do your own due diligence if you decide to invest in these stocks. The information here is believed to be accurate but may have changed since publishing.
 

We will hold these stocks forever. We will sell them only when they no longer meet our dividend investing criteria (for example the company cuts the dividend) or the stock significantly underperform and better opportunities present themselves. If these companies keep paying dividends and increasing them, we will hold.

We will also sell options around these positions to offset our cost basis. During selloffs and recoveries, we may also buy call options to capture the recovery. If you are interested to see what we are buying and what options we are selling/buying, subscribe to our program.


We all want to hear your opinion on the article above:
No Comments


This site has been fine-tuned by 14 WordPress Tweaks