Weekly Newsletter   Challenge account   Weekly Newsletter   


Posted by Martin May 08, 2021
No Comments


2021 Week 18 investing and trading report


May 2021 started in a similar manner as the previous months – slowly. We only made about $551 trading options in the first week of May. Honestly, it was a surprise to me as I expected less due to the stock market slowdown and selling pressure. So, this income is a nice surprise. In today’s trading report, I will once again, show what stocks we were trading options, what stocks we were accumulating and why, our goals, and the market outlook for the next week and beyond.

Let’s go and review this week’s investing and trading.


Here is our investing and trading report:


Account Value: $55,037.21 +$727.03 +1.34%
Options trading results
Options Premiums Received: $551.00    
01 January 2021 Options: $4,209.00 +16.65%  
02 February 2021 Options: $4,884.00 +15.41%  
03 March 2021 Options: $5,258.00 +12.79%  
04 April 2021 Options: $2,336.00 +4.30%  
05 May 2021 Options: $551.00 +1.00%  
Options Premiums YTD: $17,238.00 +31.32%  
Dividend income results
Dividends Received: $74.64    
01 January 2021 Dividends: $53.04    
02 February 2021 Dividends: $63.00    
03 March 2021 Dividends: $30.31    
04 April 2021 Dividends: $179.10    
05 May 2021 Dividends: $74.64    
Dividends YTD: $400.09    
Portfolio metrics
Portfolio Yield: 4.39%    
Portfolio Dividend Growth: 7.47%    
Ann. Div Income & YOC in 10 yrs: $8,677.62 15.70%  
Ann. Div Income & YOC in 20 yrs: $59,028.67 106.78%  
Ann. Div Income & YOC in 25 yrs: $224,164.94 405.49%  
Ann. Div Income & YOC in 30 yrs: $1,231,947.22 2,228.47%  
Portfolio Alpha: 21.59%    
Portfolio Weighted Beta: 0.97    
CAGR: 795.16%    
AROC: 31.11%    
TROC: 19.12%    
Our 2021 Goal
2021 Dividend Goal: $1,071.42 37.34%  
2021 Portfolio Value Goal: $42,344.06 129.98% Accomplished


Dividend Income Report

 
Our dividend income picked up. We are seeing larger dividends coming to our account. We have received $74.64 in dividends in the first week of May and I expect more dividends coming in the following weeks as we keep building our weekly dividend income.

The chart below indicates our current annual dividend payout from our dividend stock holdings. I am adding it to show how each stock contributes to our income. It is important for a dividend growth investor to be aware of this payout from each stock. The chart indicates that some stocks contribute (or will be contributing to our income with large sums while others contribute very little. That can be a problem. If a company that contributes with large dividends suddenly cuts the dividend, it will have a very significant impact on our income (for example, if OMF cuts the dividend, or suspends it, the impact on our portfolio dividend income will be significant.

During the accumulation phase, I am OK with this imbalance but plan to address it in the next phase of cultivating our portfolio.

Last week, our dividend income reached 37.34% of our dividend income goal.

 
Annual Dividend Payout week 18
 

Options Income Report

 
Last week we continued trading options against the stocks we either already own or plan to buy in the near future. We opened new short strangles against OMF, OXY, and rolled short strangles against ABBV, AFL, and APPL as these trades got one side of the trade into danger and we had to adjust.

We also rolled (adjusted) our TSLA spreads as tech stocks continued their selloff last week and the put side got also into trouble.

The new trades and adjustments delivered $551.00 options premiums last week.
 

Expected Future Dividend Income

 
As the table above indicates, our aggressive dividend growth stocks accumulation is starting to show significant progress in our future dividends income. Our portfolio dividend yield and dividend growth will be bringing us almost $60,000 in 25 years and $1,231,947.22 in 30 years. Of course, we want to be able to generate liveable income sooner than in 25 years. And the portfolio is starting to show this to be happening.

Comparing this trading report with our previous reports you will be able to see that although our Yield on Cost (YOC) is decreasing, our future dividend income is actually increasing. With this trend, we should be able to achieve a passive dividend income sooner.
 

Market value of our holdings

 
Our non-adjusted stock holdings market value increased from $59,324.59 to $60,327.92. Many of our positions show nice profits and on an adjusted basis, our only losing position is SNOW. All other stocks are in green.

 
Stock holdings week 18
 
Our goal is to accumulate 100 shares of each stock of our interest and we are getting to that goal. However, as mentioned above, this has a negative impact on our dividend payout. Therefore, once we reach this goal (which we set because of the ability to trade covered calls), we will start accumulating these shares to equalize our dividend income rather than have an equal amount of shares.
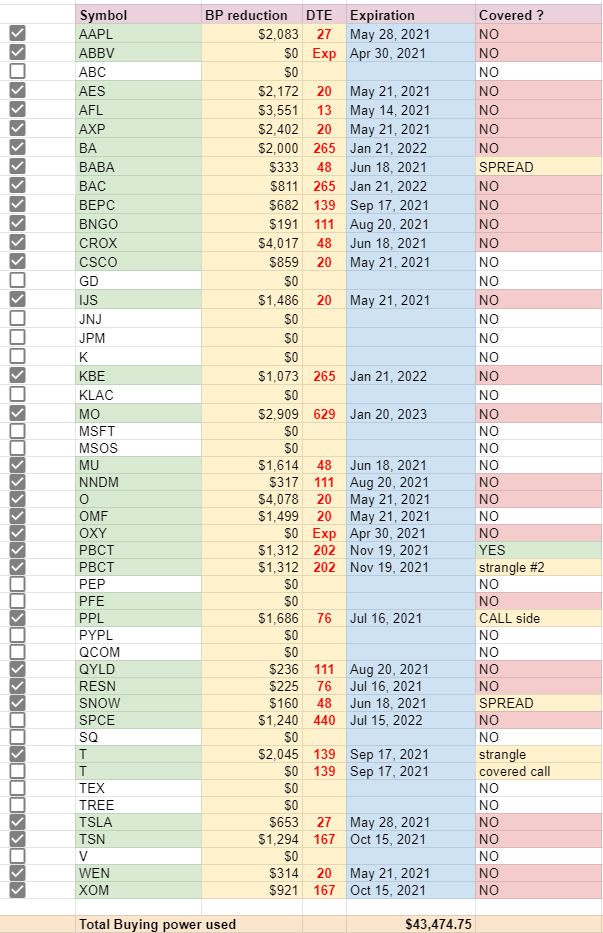
 

Open trades

 
Investing and trading report
 

The table above shows our open trades (in a simplified version) and the margin or buying power required for those trades. I keep track of this to see what trades I have open and when these trades are set to expire. It helps me to see all trades in one place and I can review them all at one glance rather than browsing through all positions in a brokerage account trying to figure out which trade needs my attention. I also use this to keep an eye on my buying power to make sure that I do not get myself into trouble overtrading. So far, this doesn’t work as I was not able to figure out how Tasty Work manages buying power and maintenance requirements. It appears to me, that they do it manually for every client and their requirements are zig-zagging from one extreme to another.

With new trades and trade adjustments, our BP reduction increased by 10% from $43,474.75 to $48,167.40 (+$4,692.65), yet our BP usage dropped from 167.00% to 125.60% (a 25% drop). How come?


Investing and trading ROI


Our options trading delivered a 1.00% monthly ROI in May 2021, totaling a 31.32% ROI YTD.

Our account grew by 167.53% this year.
 

Our options trading averaged $3,447.60 per month this year. If this trend continues, we are on track to make $41,371.20 trading options in 2021.
 

Old SPX trades repair


This week we have not done any adjustments to our old SPX trades. We are still sitting on those trades and waiting for the untouched side to close so we can roll the trades again. The goal will be to roll the trades until we will be able to close them for at least break even and release the buying power. We will keep doing this only if the resulting trade will be a credit trade or a very small debit. If adjusting these trades would require adding more new money, we would rather close these trades and move on.


Accumulating Growth Stocks


Last week, we took advantage of tech selloff and added 1 share of SNOW and 1 share of TSLA to our positions. I know, it’s just one share. But these are expensive stocks and I can afford to accumulate these stocks slowly. We still want to accumulate 100 shares of this stock and start selling covered calls. As of now, we trade Iron Condors against this stock, but once we accumulate shares, we will switch to a CC.


Accumulating Dividend Growth Stocks


Our primary goal of our investing and trading strategy is to accumulate high-quality dividend growth stocks. Last week, we added 10 shares of OMF and increased our positions in this company:
 
OMF (80 shares).
 

Our goal is to reach 100 shares of high-quality dividend stocks and build a weekly dividend income as per this calendar:
 

Weekly dividends income calendar
 

We are reaching our weekly dividend income goal as almost all weeks are filled with dividend income.


Market Outlook


The stock market continued trading sideways for the most part of the week. We shortly broke above the narrow tight range but then started drifting lower. The big companies reported earnings (AAPL, Tesla, Amazon, etc.) yet these companies sold off heavily. That made many people wondering how was that possible when the companies delivered better than expected results.

You need to understand that the market is forward-looking and when companies report earnings, most of the time, the stock market reacts to the future outlook than the current report. The current report is the past. It is history. And no one cares about history. Everyone cares about the future. So, if a company was expected to report 70% growth and it grew 70% as reported in the most current earnings, then there will be a selloff. Investors will take their profits. The goal was met, there is no need to stay in the position longer unless the company provides an even better outlook that makes the stock participants maintaining their position.

But then, on top of all that, Janet Yellen got on TV and forgot that she was no longer a FED chair and proclaimed that “we may need to raise interest rates to prevent our economy to overheat.” Jerome came quickly to deny it and Yellen backed off. But the damage was done and the stock market dropped (Nasdaq over 2%).

 
SPX May 8 2021 outlook
 
When the storm was evaded, the market recovered quickly and rallied on Thursday and Friday last week. We broke up from the consolidation pattern and based on that, I expect this market to continue rallying higher for the next few months. Based on similar market behavior since 1982, we may expect a further rally until the end of the year (possibly August) where we may experience a significant correction.

My new target is $4,430. It may take some time to get to that level, and we may see bounces and pullbacks on the road (a 5% pullback would be normal).


Investing and trading in charts


Account Net-Liq


TW Account Net-Liq week 18


Account Stocks holding

 
TW Account holdings week 18
 

The table above shows our current holdings and gains. The “Options Adjusted” columns indicate how options help to boost (or ruin) our stock holdings appreciation, or in other words, lowering the cost basis. Without options, our holdings would be up 9.13%. With options, our holdings are up 16.77% (from inception on 4/1/2019). The SPX is up 46.32% since inception.

Our options adjusted stock holdings underperform the overall market (up only 16.77% vs SPX 46.32%). On a YTD basis, the market gained 16.47% while our options-adjusted stock holdings grew 9.79%.
 

Account Growth YTD

 
TW Account holdings Growth YTD
 

The stock holdings growth slowed down because we added many new stock positions and these positions didn’t have time to grow yet, so I expect the growth trend to improve over time and beat the market.
 

Trading Report – Options Monthly Income

 
TW Options Income week 18
 

Trading Report – Options Annual Income


TW Options Annual Income week 18
 

Our dividend goal and future dividends


TW Received vs Projected Dividends week 18
 

Our portfolio still doesn’t represent the true dividend income potential but we are seeing the results of our accumulation effort already. We are on track to accomplish our dividend income goal, currently, we are at 37.34% of the goal to reach $1,071 of dividend income this year.

However, the chart below indicates that our dividend income will possibly exceed this goal as we accumulated enough shares to receive $2,858.04 in dividends.
 

TW Received vs Future Dividends week 18


Our account cumulative return


This is another metric I started tracking (since March 13, 2021) recently.
 

TW cumulative return wk 18
 

As of today, our account cumulative return is 26.07% (since March 13, 2021).


Conclusion of our investing and trading report


This week our options trading exceeded our expectations. I hope, the rest of the month will be even better.

We will continue accumulating the dividend growth stocks in our portfolio to reach 100 shares. We will also replenish our cash reserves to bring them back to 25% of our current net-liq value.

We will report our next week’s results next Saturday. Until then, good luck and good trading!


We all want to hear your opinion on the article above:
No Comments


Posted by Martin May 07, 2021
No Comments


How do you determine which stocks to buy?


Recently an investor on social media asked me this question. It is a good question many new investors struggle with. I also have seen it in my daughters when I was teaching them how to invest. Where do you go to find the stocks, how do you determine which stocks to buy?
 

Which stocks to buy?

 
Here was my response:
 

  1. I go to dividend aristocrats list.
  2. I pick the stocks I like and want to own and also have a high dividend yield.
  3. I also go after some high dividend payers, mostly ETFs that are selling bonds (like municipal bonds that are tax-exempt) and also that are involved in options strategies such as QYLD, and lately, I found NUSI and ARCC (but I have not researched them yet).
  4. Then I use Fastgraphs to evaluate these stocks and determine which are undervalued and which are overvalued.
  5. I start accumulating those that are undervalued and keep them in my watchlist in case they reverse to the means.
  6. Those stocks that are overvalued I trade options around them but do not buy the shares.


Of course, there are a few exceptions such as AAPL that is way overvalued but I decided to accumulate anyway because I think the stock will trade at a premium from now on for a long period of time (like Amazon does) and waiting for the right valuation would mean missing on the company’s growth.


We all want to hear your opinion on the article above:
No Comments


Posted by Martin May 06, 2021
No Comments


Dividend Growth Stocks to Accumulate in May 2021


Our primary goal in our portfolio is to accumulate dividend growth stocks. Our secondary goal is to trade options around those stocks to generate income and reinvest that income to accumulate even more dividend growth stocks.

To find a proper strategy that would get me to my goal, I needed to answer a simple question: How to invest to achieve my goal? How to achieve a large enough income that can buy more stocks that would generate even more income? The answer was dividend growth stocks.

I was not satisfied with just dividends. An income from dividends is small and grows slowly. At least, at the beginning of the accumulation phase. So, I added an options strategy to generate even more income selling options and collecting premiums. But I wanted more. So, I started looking for speculative but safe high yielding dividend stocks (mostly ETFs and closed-end funds “CEF”). These stocks, unlike the dividend growth stocks, can be bought, but also sold out from our portfolio. The dividend growth stocks are the only stocks we plan to hold forever (unless they cut the dividend due to insufficient earnings or free cash flow).
 

Dividend growth stocks to accumulate in May 2021

Ticker Name Today’s
Price
Estimated
Annual
Dividend
Estimated
Yield
Accumulated
AFL Aflac 56.18 1.32 2.38% 100.0%
OMF OneMain Holdings 56.00 7.43 13.38% 75.0%
APAM Artisan Partners 56.35 3.35 6.16% 0.0%
ASG Liberty All-Star 9.08 0.72 7.96% 100.0%
QYLD Global X NASDAQ Cov Calls 22.33 0.72 11.73% 100.0%
CHI Calamos Convertible Opps 15.03 1.14 7.62% 100.0%
CSQ Calamos Total Return 18.00 1.23 6.85% 0.0%
NEWT Newtek Business Services 27.91 2.11 7.42% 0.0%
ADC Agree Realty Corporation 69.85 2.60 3.74% 0.0%
STAG STAG Industrial 35.80 1.45 4.15% 0.0%
MAIN Main Street Capital Corporation 41.58 2.46 5.85% 0.0%
O Realty Income Corporation 67.55 2.82 4.20% 100.0%
RYLD Global X Russell 2000 Cov Call 24.84 2.88 10.58% 0.0%
ABBV AbbVie Inc. 116.08 5.20 4.49% 40.0%
AES The AES Corporation 25.45 0.60 2.27% 100.0%
AAPL Apple Inc. 129.74 0.88 0.69% 20.0%
EVN * Eaton Vance Muni Income 13.96 0.57 4.11% 0.0%
PMX * PIMCO Muni Income 12.54 0.55 4.40% 100.0%
EIM * Eaton Vance Muni Bond 13.57 0.60 4.40% 0.0%
FLMN Falcon Minerals Corporation 4.98 0.20 4.16% 0.0%
NEV * Nuveen Enhanced Muni 16.29 0.73 4.49% 0.0%

(Prices and yields as of May 6th, 2021)
* Dividends are exempt from federal income tax
 

Do your own due diligence if you decide to invest in these stocks. The information here is believed to be accurate but may have changed since publishing.


We all want to hear your opinion on the article above:
No Comments


Posted by Martin May 01, 2021
No Comments


2021 Week 17 investing and trading report


April is over and it is time to write our weekly investing and trading report. But before we proceed, let’s mention that today is a day when Berkshire Hathaway and Warren Buffett with Charlie Munger have their annual meeting. I plan to visit the next year’s meeting if it will be opened to the public again (this meeting is still online only).


April 2021 was a weak month. We only made $84 dollars in premiums last week and the entire month ended with $2,336 options income. But, in the stock market, you cannot force it. You force it, you lose it. We were fully invested, we had to roll some trades and that prevented us from reopening new trades to increase our income. But, a few trades expired this week and next week I expect re-opening new trades.

On the other hand, our dividend income started bringing fruits from our aggressive dividend growth stocks accumulation. Our income jumped from $30 – $60 to $200 of income, so that is a bright spot in the entire April’s trading and investing results.


Here is our investing and trading report:


Account Value: $54,310.18 +$872.80 +1.63%
Options trading results
Options Premiums Received: $84.00    
01 January 2021 Options: $4,209.00 +16.65%  
02 February 2021 Options: $4,884.00 +15.41%  
03 March 2021 Options: $5,258.00 +12.79%  
04 April 2021 Options: $2,336.00 +4.30%  
Options Premiums YTD: $16,687.00 +30.73%  
Dividend income results
Dividends Received: $119.08    
01 January 2021 Dividends: $53.04    
02 February 2021 Dividends: $63.00    
03 March 2021 Dividends: $30.31    
04 April 2021 Dividends: $179.10    
Dividends YTD: $325.45    
Portfolio metrics
Portfolio Yield: 4.37%    
Portfolio Dividend Growth: 7.47%    
Ann. Div Income & YOC in 10 yrs: $8,569.31 15.72%  
Ann. Div Income & YOC in 20 yrs: $58,366.63 107.10%  
Ann. Div Income & YOC in 25 yrs: $221,874.11 407.13%  
Ann. Div Income & YOC in 30 yrs: $1,220,992.87 2,240.49%  
Portfolio Alpha: 21.14%    
Portfolio Weighted Beta: 0.95    
CAGR: 805.01%    
AROC: 25.23%    
TROC: 19.57%    
Our 2021 Goal
2021 Dividend Goal: $1,071.42 30.38%  
2021 Portfolio Value Goal: $42,344.06 128.26% Accomplished


We continued accumulating dividend growth stocks to achieve our dividend weekly dividend income. We accumulated shares of ABBV, OMF, and AAPL. Our non-adjusted stock holdings market value decreased from $68,258.17 to $59,324.59. This was possibly caused by our broker’s weird Buying power manipulation. We had our BP growing and we parked our available cash and BP into the ICSH fund, but apparently, according to Tasty Works, they provided me with a $13,000 cash allowance to maintain a position (I do not know which) and once I closed the position, this allowance was taken away and my account got into a margin call. So I had to adjust my cash holdings to accommodate the call (glad I was creating cash reserves) to do so. This also prevented us from more trading last week.

 
Stock holdings week 17
 

Last week, we adjusted a few options trades and opened a few new trades against AES, and OMF. We started creating a ladder in these tickers opening strangles against those stocks. We picked these stocks because the capital requirements for these trades are very low (about $300 per strangle) and I want to see how these trades would work in case the position would go completely against me. Will I be able to manage them all? Or will I get busted? If I get busted, it will not be very costly. Once I gain some confidence, I can keep creating ladders against other positions too. For the entire April 2021, we received $2,336.00 premiums only. I hope, May will be a better month.
 

Open trades

 
Investing and trading report
 

The table above shows all our open trades and expirations. It is just a simplified tracking and buying power reduction. Our goal is to trade a set amount of equity strangles in what I call perpetual strangle trading. It is nothing fancy. I just have a list of equities I like to trade options around them, I like to eventually own and I accumulate these stocks. Once a trade expires (or nears expiration) I re-open the trade or roll it into the next expiration (mostly trades that a stock is near the short strike and there is a risk of getting in the money).

We did open a few new trades last week and some trades expired this week. The BP reduction decreased from $44,388.11 to $43,474.75, a decrease by -$913.36 (-2.06%). This represents 157.80% of margin usage.


Investing and trading ROI


Our options trading delivered a 4.30% monthly ROI, totaling a 30.73% ROI.

Our account grew by 159.75% this year.
 

Our options trading averaged $4,171.75 per month this year. If this trend continues, we are on track to make $50,061.00 trading options in 2021.
 

We are still on track to complete goals in our portfolio. We made slight adjustments and we are providing our comments to our goals and tasks we set up in the week 6 report:
 

Old SPX trades repair


This week we have not done any adjustments to our old SPX trades. We are still sitting on those trades and waiting for the untouched side to close so we can roll the trades again. The goal will be to roll the trades until we will be able to close them for at least break even and release the buying power. We will keep doing this only if the resulting trade will be a credit trade or a very small debit. If adjusting these trades would require adding more new money, we would rather close these trades and move on.


Accumulating Growth Stocks


Last week, we added SNOW to our positions. We still want to accumulate 100 shares of this stock and start selling covered calls. As of now, we trade Iron Condors against this stock, but once we accumulate shares, we will switch to a CC.

We also plan on accumulating Tesla (TSLA) and do the same as with SNOW.


Accumulating Dividend Growth Stocks


Our primary goal, and strategy, is to accumulate high-quality dividend growth stocks. We continued accumulating the following dividend stocks and as of today hold the following shares:
 

AAPL (20), ABBV (40), and OMF (70).
 

Our goal is to not only reach 100 shares of high-quality dividend stocks. We also want to build a weekly dividend income as per this calendar:
 

Weekly dividends income calendar
 

We are reaching our weekly dividend income goal as almost all weeks are filled with dividend income.


Market Outlook


The market is still in its consolidation pattern. It tried to continue higher but retreated at the end of the last week. It continues in an indecisive pattern and we have to wait for the market to tell us what to do next. If we break up, expect a more bullish run. If we reverse and go down, expect the bearish move to $4,000 level or around it.

nbsp;
SPX April 31 2021 outlook


Trading options


We continue trading options around the stocks we own or plan to own in the future. I call it monetizing our positions. If you look at our holdings table below, there are two column sections. The right section is “Options adjusted”. That section applies options premiums to the cost basis of our stocks. And there you can see how beneficial it is. It will make a significant difference when the market is falling yet our stocks will still be in green.


Investing and trading in charts


TW Account Net-Liq week 17

 
TW Account holdings week 17
 

The table above shows our current holdings and gains on those holdings. Adjusted columns indicate how options help to boost (or ruin) our stock holdings appreciation, or in other words, lowering the cost basis. Without options, our holdings would be up 8.86%. With options, our holdings are up 16.11% (from inception on 4/1/2019). The SPX is up 44.54% since inception. Since the inception of our portfolio, our stock holdings underperform the overall market (up only 16.11% on a cumulative basis). This week, our adjusted stock holdings underperformed the market. The market gained 14.70% YTD, our portfolio options-adjusted stock holdings grew by 9.13% YTD. This includes stock holdings adjusted by options trading, not the entire account. If we include the entire portfolio and options trading, we beat the market significantly (up 164.00%).
 

TW Account holdings Growth YTD
 

The stock holdings growth slowed down because we added many new stock positions and these positions didn’t have time to grow yet, so I expect the growth trend to improve over time and beat the market.

 
TW Options Income week 17
 

TW Options Annual Income week 17


Our dividend goal and future dividends


TW Received vs Projected Dividends week 17
 

Our portfolio still doesn’t represent the true dividend income potential, but this last week we started seeing the results of our accumulation effort kicking in. Our dividend income jumped up by 33%. We are on track to accomplish our dividend income goal, currently, we are at 30% of the goal. The $1,071 of dividend income is our goal based on the expected stock accumulation we set at the beginning of the year. It is our goal we want to achieve.

The chart below, on the other hand, indicates the dividend income of stocks we already accumulated. That means, that if we do nothing and everything stays the same for the rest of the year, we should receive $2,747.27 in dividends.
 

TW Received vs Future Dividends week 17


Our account cumulative return


This is another metric I started tracking (since March 13, 2021) recently.
 

TW cumulative return wk 17
 

As of today, our account cumulative return is 25.56% (since March 13, 2021).


Conclusion of our investing and trading report


This week our options trading was great and we created a lot of income making March our best month so far.

We will continue accumulating the dividend growth stocks in our portfolio to reach 100 shares. We will also replenish our cash reserves to bring them back to 25% of our current net-liq value.

We will report our next week’s results next Saturday. Until then, good luck and good trading!


We all want to hear your opinion on the article above:
No Comments


Posted by Martin April 24, 2021
2 Comments


2021 Week 16 investing and trading report


April is heading to its end and I am providing my weekly investing and trading report to show how our account grew last week, what trades we took and where we are in accomplishing our goals. April was slow trading stock options and our income for the whole month appears to be low and below average. But I do not expect every month to be a heyday. Last week, we focused on managing the existing trades, opened a few new ones, but mostly continued accumulating dividend stocks. We also significantly increased cash reserves.


Here is our investing and trading report:


Account Value: $53,437.38 +$6,185.87 +13.09%
Options trading results
Options Premiums Received: $810.00    
01 January 2021 Options: $4,209.00 +16.65%  
02 February 2021 Options: $4,884.00 +15.41%  
03 March 2021 Options: $5,258.00 +12.79%  
04 April 2021 Options: $2,252.00 +4.21%  
Options Premiums YTD: $16,603.00 +31.07%  
Dividend income results
Dividends Received: $9.50    
01 January 2021 Dividends: $53.04    
02 February 2021 Dividends: $63.00    
03 March 2021 Dividends: $30.31    
04 April 2021 Dividends: $60.02    
Dividends YTD: $206.37    
Portfolio metrics
Portfolio Yield: 4.00%    
Portfolio Dividend Growth: 7.47%    
Ann. Div Income & YOC in 10 yrs: $8,658.28 13.65%  
Ann. Div Income & YOC in 20 yrs: $53,311.28 84.05%  
Ann. Div Income & YOC in 25 yrs: $187,163.95 295.09%  
Ann. Div Income & YOC in 30 yrs: $926,263.52 1,460.36%  
Portfolio Alpha: 23.06%    
Portfolio Weighted Beta: 0.78    
CAGR: 816.54%    
AROC: 24.05%    
TROC: 21.29%    
Our 2021 Goal
2021 Dividend Goal: $1,071.42 19.26%  
2021 Portfolio Value Goal: $42,344.06 126.20% Accomplished


We continued accumulating dividend growth stocks to achieve our dividend weekly dividend income. We accumulated shares in ABBV, OMF, T, and TSN. Our non-adjusted stock holdings market value increased from $47,486.85 to $68,258.17. We parked available cash in the ICSH fund which we use as cash reserves. The fund holds value during volatile markets and it pays a dividend. It used to pay 1.90% but lately, the yield dropped to 1.09%. Still, a better deal compared to high yield savings accounts that pay 0.60% only. We keep the cash in the ICSH fund as a reserve and sell shares only if we need to release buying power to cover a trade (or a margin call). On the other hand, having free cash tied in the fund prevents me from using it and over-trading. That was my biggest sin in the past. Also, money in the fund makes the cash to make some small money receiving dividends rather than just sitting in the account making nothing.

 
Stock holdings week 16
 

Last week, we adjusted a few trades such as AT&T (T) strangle where the call side got in the money and AT&T is difficult to roll, so we didn’t want the trade to run away from us. We received $810.00 in premiums trading options against our holdings. For the entire April 2021, we received $2,252.00 premiums, and all our income was parked in ICSH reserves. This income is low and I expect April to be low on income. But, evidently, it is good at growth.
 

Open trades

 
Investing and trading report
 

The table above shows all our open trades and expirations. It is just a simplified tracking and buying power reduction. Our goal is to trade a set amount of equity strangles in what I call perpetual strangle trading. It is nothing fancy. I just have a list of equities I like to trade options around them, I like to eventually own and I accumulate these stocks. Once a trade expires (or nears expiration) I re-open the trade or roll it into the next expiration (mostly trades that a stock is near the short strike and there is a risk of getting in the money).

We did open a few new trades last week. The BP reduction increased from $33,294.50 to $44,388.11, a BP usage increased by $11,093.61 (+33.32%). This represents 167.00% of margin usage.


Investing and trading ROI


Our options trading delivered a 4.21% monthly ROI, totaling a 31.07% ROI.

Our account grew by 159.75% this year.
 

Our options trading averaged $4,150.75 per month this year. If this trend continues, we are on track to make $49,809.00 trading options in 2021.
 

We are still on track to complete goals in our portfolio. We made slight adjustments and we are providing our comments to our goals and tasks we set up in the week 6 report:
 

Old SPX trades repair


This week we have not done any adjustments to our old SPX trades. We are still sitting on those trades and waiting for the untouched side to close so we can roll the trades again. The goal will be to roll the trades until we will be able to close them for at least break even and release the buying power. We will keep doing this only if the resulting trade will be a credit trade or a very small debit. If adjusting these trades would require adding more new money, we would rather close these trades and move on.


Accumulating Growth Stocks


Last week, we didn’t add any growth stocks to our portfolio. We still plan on adding SNOW when it is trading this low and we are planning on accumulating Tesla (TSLA). But Tesla keeps moving higher and I am waiting for it to drop to add more shares. We keep selling Iron Condors or vertical spreads to receive premiums and lower our cost basis.


Accumulating Dividend Growth Stocks


Our primary goal, and strategy, is to accumulate high-quality dividend growth stocks. We continued accumulating the following dividend stocks and as of today hold the following shares:
 

We finished accumulating Realty Income (100) and continued adding: ABBV (34), OMF (50), AT&T (150), and TSN (10).
 

Our goal is to not only reach 100 shares of high-quality dividend stocks. We also want to build a weekly dividend income as per this calendar:
 

Weekly dividends income calendar
 

We are reaching our weekly dividend income goal as almost all weeks are filled with dividend income.


Market Outlook


The market reached our price target at the $4,200 level almost perfectly. Technical analysis is not an exact science and the targets or levels are approximate. So it is quite amazing to see that the market landed at our target exactly and then stalled.

nbsp;
SPX April 24 2021 outlook
 

The market is now entering a consolidation base consolidating sharp gains. That is a good sign. That helps with the trend continuation. This pattern can be also interpreted as a “flag” or “pennant” pattern. Both are bullish continuation patterns if cleared successfully. If the market breaks to the upside, expect bullish trend continuation, and the next price target would be around $4,440 level. If we do not clear this pattern and it falls, expect a pullback to $4,100 or even back to the $4,000 level. But, we must wait to see what the market wants to do next.


Trading options


We continue trading options around the stocks we own or plan to own in the future. I call it monetizing our positions. If you look at our holdings table below, there are two column sections. The right section is “Options adjusted”. That section applies options premiums to the cost basis of our stocks. And there you can see how beneficial it is. It will make a significant difference when the market is falling yet our stocks will still be in green.


Investing and trading report in charts


TW Account Net-Liq week 16
 

It is amazing to see how the portfolio growth is speeding up once it grows larger. We are almost at $2,000 net-liq gains per week. If I extrapolate this rate of change to the remaining 37 weeks this account should grow by another staggering $74,000, finishing the year 2021 at $121,250.

 
TW Account holdings week 16
 

The table above shows our current holdings and gains on those holdings. Adjusted columns indicate how options help to boost (or ruin) our stock holdings appreciation, or in other words, lowering the cost basis. Without options, our holdings would be up 7.62%. With options, our holdings are up 13.15% (from inception on 4/1/2019). The SPX is up 44.51% since inception. Since the inception of our portfolio, our stock holdings underperform the overall market (up only 13.15% on a cumulative basis). This week, our adjusted stock holdings underperformed the market. The market gained 14.66% YTD, our portfolio options-adjusted stock holdings grew by 6.17% YTD. This includes stock holdings adjusted by options trading, not the entire account. If we include the entire portfolio and options trading, we beat the market significantly (up 159.75%).
 

TW Account holdings Growth YTD
 

The stock holdings growth slowed down because we added many new stock positions and these positions didn’t have time to grow yet, so I expect the growth trend to improve over time and beat the market.

 
TW Options Income week 16
 

TW Options Annual Income week 16


Our dividend goal and future dividends


TW Received vs Projected Dividends week 16
 

Our portfolio still doesn’t represent the true dividend income potential. The $1,071 of dividend income is our goal based on the expected stock accumulation. The chart below indicates the dividend income of currently accumulated stocks. But as of now, we are not yet receiving this income as we just finished accumulating these stocks and since the companies pay quarterly, we already missed the 1st quarter.
 

TW Received vs Future Dividends week 16


Our account cumulative return


This is another metric I started tracking (since March 13, 2021) recently.
 

TW cumulative return wk 16
 

As of today, our account cumulative return is 23.54% (since March 13, 2021).


Conclusion of our investing and trading report


This week our options trading was great and we created a lot of income making March our best month so far.

We will continue accumulating the dividend growth stocks in our portfolio to reach 100 shares. We will also replenish our cash reserves to bring them back to 25% of our current net-liq value.

We will report our next week’s results next Saturday. Until then, good luck and good trading!


We all want to hear your opinion on the article above:
2 Comments


Posted by Martin April 19, 2021
No Comments


Why I think there will be no stock market crash anytime soon


Last few weeks and months, many people thought and predicted that there will be a stock market crash. Many predicted another crash in 2020. That didn’t happen. Now they are predicting a crash in 2021. Here is why I think there will be no market crash in 2021 either.


Pundits join the stock market crash narrative


More and more pundits are joining the narrative about the stock market crash. Recently, Suze Orman joined the group of panic spreaders with her prediction of this year’s stock market crash and that she is preparing for it. In the recent Yahoo article, Orman advised on how to prepare yourself for the upcoming crash. Let’s ignore the fact that Orman has little to no exposure to the stock market and almost all her wealth is in bonds (in 2007 interview with NY Times magazine, she admitted that her $30 million net worth is in municipal bonds and only one million dollars is in stocks, because “she doesn’t believe in stocks“), her advice has or should have, no value to anyone listening to her.

Then you go to Youtube and you have another large group of people predicting crashes and fiercely explaining why they sold off their portfolios and you should too.

One main reason for the upcoming crash these people push through is the so-called “Buffett indicator”.


Buffett Indicator is a sham


When you know what the so-called Buffett indicator is, you probably wonder, as well as I do, whether Warren Buffett really believes in this indicator himself. Although, Buffett said about the indicator that it is “probably the best single measure of where valuations stand at any given moment”, I believe, it is either grossly misused or I am looking at it from the wrong perspective.

So, what is the indicator about? It is an aggregate market ratio (or how cheap or expensive the market is) to the economic output (or to the nation’s GDP).

 
Buffett Indicator predicts stock market crash
 

And according to all those “experts”, …the Buffett Indicator, which is a measurement of the ratio of the stock market’s total value against U.S. economic output, continues to climb to previously unseen levels.


2 + 2 = fish


Using the Buffett indicator resembles the famous quote by Jamie Shipley in Big Short that “It’s like two plus two equals fish.” Why? Because, in my opinion, and correct me if I am wrong, the indicator, the way it is described, is comparing two totally different outputs that are not comparable.

Let me explain.

If the indicator is comparing the current market valuation with the current nation’s GDP, then it is utterly wrong. The stock market is a forward-looking pricing machine. The stock market is pricing in the future economic output, not current output. It prices in the future expectations about the economy. The market is predicting the future and then correcting itself if the future prediction was not as expected. We all know that Ms. Market looks ahead to 6 months or one-year future and provides us with prices of what she thinks is going to happen in that future.


February 2020 – March 2020 stock market crash and economic output


When the Covid-19 hit the fear of the catastrophic impact on the US and global economies would be severe and the stock market crashed almost 40%. Everyone was predicting the end of the world. The decline and fear of the virus started on February 20, 2020.

Was the market expressing the current economic output? No, it was not. The data were not yet reported. No one could know what the GPD would look like in February! The Bureau of Economic Analysis releases GDP data quarterly and February 20, 2020 data were not known until March 25, 2020, so what caused the stock market to crash? Certainly not the current economic output the pundits are telling us using the Buffett Indicator.

 
Stock market crash
 

The US economy, cities, towns, and businesses got closed on March 27, 2020. I know that, because on that day, I was moving from Colorado Springs to Denver and Denver’s mayor issued a curfew that day and closed the businesses. And when that happened, the market was already down 40%. In fact, it already recovered some of the losses!

And when the GDP data got released on March 25, 2020, showing that the US economy got down by 5.36%, the market rallied. The next issuance of the GDP data showed that the GDP lost 15.58% the market rallied even more.

People considered it crazy, saying that the economy lost 16% GDP and the market rallies… crazy!… manipulation!!… FED fault!!! But no, the market was just correcting itself. It crashed by 40% but the economy crashed by 16% only, so it was obvious that the market would rally to the mean value. And it continued rallying as it was obvious that there will be no more damage and that the US economy will be undergoing a sharp recovery.


Why there will be no stock market crash, at least not now


By now, I hope you see my point. The market is looking far ahead, so comparing it to today’s economic outlook (GDP) is wrong and misleading. If you want to compare today’s stock market pricing, then compare it to the GDP 6 months in the future, not today, well, of course, if you have any means to know what the US GDP will look like 6 months from now.

People were again outraged by the market’s behavior. People were losing jobs, businesses closed and bankrupt, and the crazy market was rallying and thus detached from reality.

But again, not true. The market was looking far beyond reality. It was looking to the future and saw, that there will be vaccines, businesses reopening, the government approving stimulus packages to support the businesses and Americans, and the economy would be growing again.

Today, our current government approved the 1.9T stimulus package. The Biden administration is about to proceed with a large infrastructure program. If approved as presented in its current writeup, it would be the largest program comparable to Roosevelt’s New Deal.

Biden plans to spend $621 billion on infrastructure, $650 billion on housing improvement, and affordable housing, $400 billion on caregiving programs and caregivers, and $480 billion on research, development, and manufacturing.

You may say that it is another money pumping into the economy that would inflate the bubble even more. But no, this time, if really spent as planned, it would create jobs across the board. Road workers will be needed, construction workers, nurses, scientists, engineers, teachers, all professions will be involved to participate. And it will spark the largest economic boom ever seen. And the market is in fact pricing it in and positioning itself for more bullish growth. Of course, there will be corrections and bumps (dips) on the road, but that is normal and to be expected.


We all want to hear your opinion on the article above:
No Comments


Posted by Martin April 17, 2021
No Comments


2021 Week 15 investing and trading report


Another week of April is over and it is time to provide our weekly investing and trading report again. I am extremely pleased to see our portfolio growth acceleration. It grows faster every week. Last week, we continued accumulating dividend growth stocks and trading options around our stock positions. Although, last week, we just adjusted our options trades.


Here is our investing and trading report:


Account Value: $47,251.51 +$4,645.16 +10.90%
Options trading results
Options Premiums Received: $564.00    
01 January 2021 Options: $4,209.00 +16.65%  
02 February 2021 Options: $4,884.00 +15.41%  
03 March 2021 Options: $5,258.00 +12.79%  
04 April 2021 Options: $1,442.00 +3.05%  
Options Premiums YTD: $15,793.00 +33.42%  
Dividend income results
Dividends Received: $8.31    
01 January 2021 Dividends: $53.04    
02 February 2021 Dividends: $63.00    
03 March 2021 Dividends: $30.31    
04 April 2021 Dividends: $50.52    
Dividends YTD: $196.87    
Portfolio metrics
Portfolio Yield: 3.98%    
Portfolio Dividend Growth: 7.47%    
Ann. Div Income & YOC in 10 yrs: $5,993.02 13.56%  
Ann. Div Income & YOC in 20 yrs: $36,737.44 83.15%  
Ann. Div Income & YOC in 25 yrs: $128,526.00 290.89%  
Ann. Div Income & YOC in 30 yrs: $633,093.50 1,432.87%  
Portfolio Alpha: 24.45%    
Portfolio Weighted Beta: 0.89    
CAGR: 781.03%    
AROC: 28.25%    
TROC: 17.29%    
Our 2021 Goal
2021 Dividend Goal: $1,071.42 18.37%  
2021 Portfolio Value Goal: $42,344.06 111.59% Accomplished


We continued accumulating our stocks to achieve our dividend weekly dividend income. We accumulated shares in Realty Income (O), ABBV, AAPL, and we finished accumulating (we reached 100 shares) PMX according to our plan. Our non-adjusted stock holdings market value increased from $44,923.51 to $47,486.85.

 
Stock holdings week 15
 

Five of our options trades expired last Friday. One of the trade that expired was a strangle against Wendy’s (WEN). Unfortunately, the call leg was in the money and I forgot to check the trade to roll it. For many months WEN was going sideways (ideal for strangles or Iron Condors) and I became complacent. Our calls expired in the money and now we are a proud owner of -100 shares of Wendy’s. I plan on closing the trade on Monday. That would incur a small loss.

Last week was slow in trading. We only adjusted a few trades only. We received $564.00 in premiums trading options against our holdings. For the entire April 2021, we received $1,442.00 premiums, and all our income was reinvested.
 

Open trades

 
Investing and trading report
 

The table above shows all our open trades and expirations. It is just a simplified tracking and buying power reduction. Our goal is to trade a set amount of equity strangles in what I call perpetual strangle trading. It is nothing fancy. I just have a list of equities I like to trade options around them, I like to eventually own and I accumulate these stocks. Once a trade expires (or nears expiration) I re-open the trade or roll it into the next expiration (mostly trades that a stock is near the short strike and there is a risk of getting in the money).

We did open any new trades last week. The BP reduction decreased from $39,451.90 to $33,294.50, a BP usage decreased by -$6,157.40 or -15.61%. Of course, next week, I plan to re-open new trades to replace the expired ones.


Investing and trading ROI


Our options trading delivered a 3.05% monthly ROI, totaling a 33.42% ROI.

Our account increased to 111.59% YTD growth.
 

Our options trading averaged $3,948.25 per month this year. If this trend continues, we are on track to make $47,379.00 trading options in 2021.
 

We are still on track to complete goals in our portfolio. We made slight adjustments and we are providing our comments to our goals and tasks we set up in the week 6 report:
 

Old SPX trades repair


This week we have not done any adjustments to our old SPX trades. We are still sitting on those trades and waiting for the untouched side to close so we can roll the trades again. The goal will be to roll the trades until we will be able to close them for at least break even and release the buying power. We will keep doing this only if the resulting trade will be a credit trade or a very small debit. If adjusting these trades would require adding more new money, we would rather close these trades and move on.


Accumulating Growth Stocks


Last week, we added AAPL to our portfolio and we added Snowflake (SNOW). For some reason, SNOW is a hated company by Wall Street. It suffered significant selling pressure last few weeks. I do not understand why. I still think SNOW is another Amazon in the cloud services industry. If done right, the company will perform well and could become a significant competitor to AMZN’s AWS. Although SNOW’s net income is declining, its cash is growing and its revenue is also growing year by year. This tells me that they are doing something right.

 
SNOW revenue growth
 

I plan on continuing to accumulate this stock and reach 100 shares. After I reach 100 shares, I will start selling covered calls. I wanted to sell strangles but the stock is not marginable as of now (at least my broker doesn’t allow to trade on margin as of yet due to the stock’s recent IPO) so it is too expensive to trade cash secured. But once I accumulate 100 shares, I should be able to trade a standard wheel strategy.

 
SNOW price chart wk 15
 

Since the stock is in the “hate” territory and investors sold off the stock that now it trades below its IPO price I expect that it may go even lower from here. The stock may go down to $150 a share or even $100 a share. Yet, I still plan on adding shares to build the position.


Accumulating Dividend Growth Stocks


It still is our core investment strategy to accumulate high-quality dividend growth stocks. We continued accumulating the following dividend stocks and as of today hold the following shares:
 

Realty Income (85), ABBV (25), PMX (100), and AAPL (18)
 

Our goal is to not only reach 100 shares of high-quality dividend stocks. We also want to build a weekly dividend income as per this calendar:
 

Weekly dividends income calendar
 

We are reaching our weekly dividend income goal as almost all weeks are filled with dividend income.


Market Outlook


The market is reaching our goal target of $4,200 level. It was a straight run-up. I definitely didn’t expect this fast move but it happened. A pull-back is now likely, although I expect a minor one, possibly back to $4,000 level (or 4% to 5% pullback).

 
SPX April 17 2021 outlook


Trading options


We continue trading options around the stocks we own or plan to own in the future. I call it monetizing our positions. If you look at our holdings table below, there are two column sections. The right section is “Options adjusted”. That section applies options premiums to the cost basis of our stocks. And there you can see how beneficial it is. It will make a significant difference when the market is falling yet our stocks will still be in green.


Investing and trading report in charts


TW Account Net-Liq week 15
 

It is amazing to see how the portfolio growth is speeding up once it grows larger. We are almost at $2,000 net-liq gains per week. If I extrapolate this rate of change to the remaining 37 weeks this account should grow by another staggering $74,000, finishing the year 2021 at $121,250.

 
TW Account holdings week 15
 

The table above shows our current holdings and gains on those holdings. Adjusted columns indicate how options help to boost (or ruin) our stock holdings appreciation, or in other words, lowering the cost basis. Without options, our holdings would be up 10.76%. With options, our holdings are up 17.87% (from inception on 4/1/2019). The SPX is up 44.69% since inception. Since the inception of the fund, our stock holdings underperform the overall market (up only 17.87% on a cumulative basis). This week, our adjusted stock holdings underperformed the market. The market gained 14.84% YTD, our portfolio options-adjusted stock holdings grew by 10.89% YTD. This includes stock holdings adjusted by options trading, not the entire account. If we include the entire portfolio and options trading, we beat the market significantly.
 

TW Account holdings Growth YTD
 

The stock holdings growth slowed down because we added many new positions and these positions didn’t have time to grow yet, so I expect the growth trend to improve over time and beat the market.

 
TW Options Income week 15
 

TW Options Annual Income week 15


Our dividend goal and future dividends


TW Received vs Projected Dividends week 15
 

Our portfolio still doesn’t represent the true dividend income potential. The $1,071 of dividend income is our goal based on the expected stock accumulation. The chart below indicates the dividend income of currently accumulated stocks. But as of now, we are not yet receiving this income as we just finished accumulating these stocks and since the companies pay quarterly, we already missed the 1st quarter.
 

TW Received vs Future Dividends week 15


Our account cumulative return


This is another metric I started tracking (since March 13, 2021) recently.
 

TW cumulative return wk 15
 

As of today, our account cumulative return is 23.38% (since March 13, 2021).


Conclusion of our investing and trading report


This week our options trading was great and we created a lot of income making March our best month so far.

We will continue accumulating the dividend growth stocks in our portfolio to reach 100 shares. We will also replenish our cash reserves to bring them back to 25% of our current net-liq value.

We will report our next week’s results next Saturday. Until then, good luck and good trading!


We all want to hear your opinion on the article above:
No Comments


Posted by Martin April 10, 2021
No Comments


2021 Week 14 investing and trading report


The first week of April is over and it is time to provide our weekly investing and trading report again. Our portfolio growth seems to be gaining steam and growing faster than before. We continued the aggressive accumulation of stocks that we like because they pay us dividends while we wait for them to appreciate in their value. We also continued aggressive options trading bringing in more income that can be reinvested.

This week, we doubled our account and met our annual portfolio net-liquidating value goal!


Here is our investing and trading report:


Account Value: $42,606.35 +$1,492.13 +3.63%
Options trading results
Options Premiums Received: $885.00    
01 January 2021 Options: $4,209.00 +16.65%  
02 February 2021 Options: $4,884.00 +15.41%  
03 March 2021 Options: $5,258.00 +12.79%  
04 April 2021 Options: $878.00 +2.06%  
Options Premiums YTD: $15,229.00 +35.74%  
Dividend income results
Dividends Received: $0.71    
01 January 2021 Dividends: $53.04    
02 February 2021 Dividends: $63.00    
03 March 2021 Dividends: $30.31    
04 April 2021 Dividends: $42.21    
Dividends YTD: $188.56    
Portfolio metrics
Portfolio Yield: 4.04%    
Portfolio Dividend Growth: 7.47%    
Ann. Div Income & YOC in 10 yrs: $6,050.48 13.84%  
Ann. Div Income & YOC in 20 yrs: $37,610.31 86.02%  
Ann. Div Income & YOC in 25 yrs: $133,036.96 304.28%  
Ann. Div Income & YOC in 30 yrs: $665,041.94 1,521.06%  
Portfolio Alpha: 26.78%    
Portfolio Weighted Beta: 0.88    
CAGR: 756.99%    
AROC: 35.98%    
TROC: 23.62%    
Our 2021 Goal
2021 Dividend Goal: $1,071.42 17.60%  
2021 Portfolio Value Goal: $42,344.06 100.62% Accomplished


We continued accumulating our stocks to achieve our dividend weekly dividend income. We accumulated shares in Realty Income (O), ABBV, AAPL, and we finished accumulating (we reached 100 shares) AES according to our plan. I also decided to start increasing holdings in AT&T (T) stock. Our non-adjusted stock holdings market value increased from $44,923.51 to $47,486.85.

 
Stock holdings week 14
 

Last week, we received $885.00 in premiums trading options against our holdings. For the entire April 2021, we received $878.00 premiums, and all our income was reinvested.
 

Open trades

 
Investing and trading report
 

The table above shows all our open trades and expirations. It is just a simplified tracking and buying power reduction. Our goal is to trade a set amount of equity strangles in what I call perpetual strangle trading. It is nothing fancy. I just have a list of equities I like to trade options around them, I like to eventually own and I accumulate these stocks. Once a trade expires (or nears expiration) I re-open the trade or roll it into the next expiration (mostly trades that a stock is near the short strike and there is a risk of getting in the money).

We opened new trades last week. The BP reduction increased from $37,123.70 to $39,451.90, a reduction of +$2,328.20 or +6.27%.


Investing and trading ROI


Our options trading delivered a 2.06% monthly ROI, totaling a 35.74% ROI.

Our account increased to 107.10% YTD growth. This means, we just doubled our account.
 

Our options trading averaged $3,807.25 per month this year. If this trend continues, we are on track to make $45,687.00 trading options in 2021.
 

We are still on track to complete goals in our portfolio. We made slight adjustments and we are providing our comments to our goals and tasks we set up in the week 6 report:
 

Old SPX trades repair


This week we have not done any adjustments to our old SPX trades. We are still sitting on those trades and waiting for the untouched side to close so we can roll the trades again. The goal will be to roll the trades until we will be able to close them for at least break even and release the buying power. We will keep doing this only if the resulting trade will be a credit trade or a very small debit. If adjusting these trades would require adding more new money, we would rather close these trades and move on.


Accumulating Growth Stocks


In the last few weeks, I was accumulating Tesla (TSLA) stock. This week we have not bought any new shares. We started trading Iron Condors against Tesla to start lowering our cost basis.

We are also accumulating g Apple (AAPL) stock although last week we have not purchased any new shares.


Accumulating Dividend Growth Stocks


Buying high-quality dividend stocks is our core strategy. And we will continue to do so and at a faster pace. I continued accumulating Realty Income (O) this week and as of today, we hold 60 shares.

We also accumulated ABBV and AES stocks. We increased our position in ABBV to 17 shares, and we reached 100 shares in AES company.

We started accumulating PMX shares (a tax-free municipal bond fund). We currently hold 40 shares and plan to reach 100.

Our goal is to not only reach 100 shares of high-quality dividend stocks but also create a weekly dividend income from these stocks All it takes to create a weekly dividend income is to buy 12 stocks to spread the income for every week. I created this dividend calendar and track the stocks I want to buy to get this goal done fast.
 

Weekly dividends income calendar
 

As you can see in the table above, we are reaching our weekly dividend income goal as almost all weeks are filled with dividend income. All that is missing is February and March first week “slot” (and subsequent months) but others are already filled. April should deliver an income every week. After we add all weeks, we will start increasing shares so the income is larger and larger every week. Also, note that I have included holdings of 100 shares in this table only. So, for example, we own 17 shares of AAPL and therefore it is not yet included in this table although we will receive income next month.


Market Outlook


The market continues playing according to the expected price move. I still expect this market to hit the $4,200 mark in the near future. I expected this moe, but I have not expected this “straight-up” move. But I am happy with it, too.

 
SPX April 02 2021 outlook


Trading options


We continue trading options around the stocks we own or plan to own. I call it monetizing our positions. It has a threefold benefit. It lowers our cost basis (at some point we will own all our shares for free), covers our call sides of each trade, and generates an additional income on top of the dividends. And that income is significant as you can see from our report at the top of this post.

We added a few new trades to our portfolio and we are close to having our trading “full”, or be fully invested. Once that happens, we will start trading multiple contracts. As of now, we mostly trade one contract of strangles. I am still thinking about building a ladder using LEAPS against SPY and AAPL as of now but not yet decided.


Investing and trading report in charts


TW Account Net-Liq week 13
 

Our aggressive accumulation of dividend stocks, using proceeds from aggressive options trading (by “aggressive” I do not mean reckless, but using all available funds and be fully invested at all times), is delivering fruits. Our net liquidation value increased significantly this year. I expect this trend to continue. I am also preparing our account for portfolio margin and once we achieve the required net-liq value, I will add this feature to our account. I hope to be able to trade a bit more aggressively. And yes, I am aware of potential risks.

 
TW Account holdings week 14
 

The table above shows our current holdings and gains on those holdings. Adjusted columns indicate how options help to boost (or ruin) our stock holdings appreciation, or in other words, lowering the cost basis. Without options, our holdings would be up 8.61%. With options, our holdings are up 14.93% (from inception on 4/1/2019). The SPX is up 42.73% since inception. Since the inception of the fund, our stock holdings underperform the overall market (up only 14.93% on a cumulative basis). This week, our adjusted stock holdings underperformed the market. The market gained 12.89% YTD, our portfolio options-adjusted stock holdings grew by 7.95% YTD. This includes stock holdings adjusted by options trading, not the entire portfolio. If we include the entire portfolio and options trading, we beat the market significantly.
 

TW Account holdings Growth YTD
 

The stock holdings growth slowed down because we added many new positions and these positions didn’t have time to grow yet, so I expect the growth trend to improve over time and beat the market.

 
TW Options Income week 14
 

TW Options Annual Income week 14


Our dividend goal and future dividends


TW Received vs Projected Dividends week 14
 

I have added another view into our holdings and their expected performance. Below is a chart of all future expected dividends on our holdings. The chart above indicates our dividend goal rather than expected dividends, the new chart below indicates our holdings and their dividend payouts vs. received payouts. In other words, these are the dividends we should receive if we held these positions at the current level since January 1st. But because we have not held those positions since January, we will not be able to receive those dividends. We added new positions just recently so all dividends that are included in the “projected” value were not paid to us. But, if we stop investing now, the “projected” dividend value (currently $1,866.22) is the annual dividend rate we should be receiving as passive income every year without touching anything in our portfolio.
 

TW Received vs Future Dividends week 14


Our account cumulative return


This is another metric I started tracking (since March 13, 2021) recently.
 

TW cumulative return wk 14
 

As of today, our account cumulative return is 17.45% (since March 13, 2021).


Conclusion of our investing and trading report


This week our options trading was great and we created a lot of income making March our best month so far.

We will continue accumulating the dividend growth stocks in our portfolio to reach 100 shares. We will also replenish our cash reserves to bring them back to 25% of our current net-liq value.

We will report our next week’s results next Saturday. Until then, good luck and good trading!


We all want to hear your opinion on the article above:
No Comments


Posted by Martin April 04, 2021
No Comments


Dividend Growth Stocks to Accumulate in April 2021


We have a few goals to achieve for our investment portfolio, some goals are primary, others are secondary goals that support the primary goal. I wish, I had more disposable funds to invest and that determined our primary goal – invest and trade so our investments generate enough income that can be reinvested. And here is a list of stocks to accumulate in April to achieve our goal.

To set a goal I needed to answer a simple question: How to invest to achieve my goal? How to achieve a large enough income that can buy more stocks that would generate even more income? The answer was dividend growth stocks.

I was not satisfied with just dividends. An income from dividends is small and grows slowly. At least, at the beginning of the accumulation phase. So, I added an options strategy to generate even more income selling options and collecting premiums. But I wanted more. So, I started looking for speculative but safe high yielding dividend stocks (mostly ETFs and closed-end funds “CEF”). These stocks, unlike the dividend growth stocks, can be bought, but also sold out from our portfolio. The dividend growth stocks are the only stocks we plan to hold forever (unless they cut the dividend due to insufficient earnings or free cash flow).
 

I think I have found a few good candidates I would like to add to my accumulation list.
 

Stocks to accumulate list:

Ticker Name Today’s
Price
Estimated
Annual
Dividend
Estimated
Yield
Accumulated
AFL Aflac 51.16 1.32 2.58% 100.0%
OMF OneMain Holdings 54.99 7.06 13.14% 0.0%
APAM Artisan Partners 52.52 3.08 5.86% 0.0%
ASG Liberty All-Star 8.63 0.66 7.65% 100.0%
QYLD Global X NASDAQ Cov Calls 22.70 0.23 11.49% 100.0%
CHI Calamos Convertible Opps 14.38 1.14 7.93% 100.0%
CSQ Calamos Total Return 17.42 1.23 7.06% 0.0%
NEWT Newtek Business Services 26.89 2.11 7.85% 0.0%
ADC Agree Realty Corporation 68.09 2.48 3.65% 0.0%
STAG STAG Industrial 34.56 1.45 4.20% 0.0%
MAIN Main Street Capital Corporation 39.85 2.46 6.17% 0.0%
O Realty Income Corporation 65.11 2.82 4.33% 55.0%
RYLD Global X Russell 2000 Cov Call 24.51 2.88 10.57% 0.0%
ABBV (NEW) AbbVie Inc. 108.52 5.20 4.79% 13.0%
AES (NEW) The AES Corporation 27.07 0.60 2.22% 70.0%
AAPL (NEW) Apple Inc. 123.00 0.82 0.67% 17.0%
EVN (NEW) Eaton Vance Muni Income 13.79 0.57 4.15% 0.0%
PMX (NEW) PIMCO Muni Income 12.40 0.55 4.45% 0.0%
EIM (NEW) Eaton Vance Muni Bond 13.33 0.60 4.47% 0.0%
FLMN (NEW) Falcon Minerals Corporation 4.71 0.20 4.34% 0.0%

(Prices and yields as of April 4th, 2021)
 

Do your own due diligence if you decide to invest in these stocks. The information here is believed to be accurate but may have changed since publishing.


We all want to hear your opinion on the article above:
No Comments


Posted by Martin April 03, 2021
No Comments


2021 Week 13 investing and trading report


March 2021 is in the books! And as you would be able to see in this investing and trading report, it was our best month this year generating a nice income for our partnership members. The month of March started slow and I thought it would stay like this. But as the market started going up again and some of our options trades expired and we re-opened them, it picked up and our account ended to be the best month. The generated income from options premiums was reinvested into dividend growth stocks holdings. I hope, the next month will be even better!


Here is our investing and trading report:


Account Value: $41,114.22 +$1,400.24 +3.53%
Options trading results
Options Premiums Received: $93.00    
01 January 2021 Options: $4,209.00 +16.65%  
02 February 2021 Options: $4,884.00 +15.41%  
03 March 2021 Options: $5,258.00 +12.79%  
04 April 2021 Options: -$7.00 -0.02%  
Options Premiums YTD: $14,344.00 +34.89%  
Dividend income results
Dividends Received: $9.92    
01 January 2021 Dividends: $53.04    
02 February 2021 Dividends: $63.00    
03 March 2021 Dividends: $30.31    
04 April 2021 Dividends: $41.50    
Dividends YTD: $187.85    
Portfolio metrics
Portfolio Yield: 4.19%    
Portfolio Dividend Growth: 8.10%    
Ann. Div Income & YOC in 10 yrs: $6,548.14 15.74%  
Ann. Div Income & YOC in 20 yrs: $49,403.49 118.76%  
Ann. Div Income & YOC in 25 yrs: $207,923.34 499.80%  
Ann. Div Income & YOC in 30 yrs: $1,345,568.52 3,234.47%  
Portfolio Alpha: 26.02%    
Portfolio Weighted Beta: 0.87    
CAGR: 759.37%    
AROC: 27.82%    
TROC: 22.78%    
Our 2021 Goal
2021 Dividend Goal: $1,071.42 17.53%  
2021 Portfolio Value Goal: $42,344.06 97.10%  


The dividend growth and yield on cost growth are impressive over time. The numbers in the table above indicate how great passive income this portfolio will deliver in the next 20 years. And in the next 30 years, this portfolio will deliver over a million dollars annually in dividend income. That is a state of this portfolio as of today, given that we will do nothing from now on. But we will keep investing, accumulating, and monetizing our portfolio.

The future and the prospect of future dividend income are bright. Yet building such a portfolio is a slow and somewhat painful process. It takes time. If you look at the current dividend income, it looks pitiful and laughable. And many people will tell you that it makes no sense to invest in dividend growth stocks. The income is not worth it. We have over $40,000 invested in dividend stocks and we only received $30 in dividend income.

Unfortunately for the naysayers, this is an incredibly simplified and incorrect view. The invested amount is an amount as of today, invested in these stocks just last week and it had not yet time to transform into the dividend income. It will come later as the next quarterly dividends kick in. But people fail to see it.

Last week we continued accumulating our stocks to achieve our dividend weekly dividend income. We accumulated shares in Realty Income (O), ABBV, AAPL, and AES according to our plan. I also decided to start increasing holdings in AT&T (T) stock. I also got rid of a few stocks that no longer meet our original criteria for investing in them. We sold out Helmerich & Payne (HP) and Oxydental Petroleum (OXY). The companies stopped growing their dividends and cut them significantly. We just held them in our portfolio for a better exit time. As oil rallied, these stocks increased in price and we could sell them break even. We kept all the dividends we ever received, though. Our non-adjusted stock holdings market value increased from $41,602.80 to $44,923.51.

 
Stock holdings week 13
 

Last week, we received $93.00 in premiums trading options against our holdings. It was low as we traded for only two days in the last week of March. We just adjusted a few trades only. Also, on the first day of April (Thursday only, as on Friday, April 2nd, the markets were closed for Good Friday) we generated a small loss. In fact, it was not a loss but closing some positions (we closed a call spread against BABA and TSLA), so our credit premium was in March but closing debit already got in April (as I keep this track based on CASH accounting standard). For the entire March 2021, we received $5,258.00 premiums, and all our income was reinvested.
 

Open trades

 
Investing and trading report
 

The table above shows all our open trades and expirations. It is just a simplified tracking and buying power reduction. Our goal is to trade a set amount of equity strangles in what I call perpetual strangle trading. It is nothing fancy. I just have a list of equities I like to trade options around them, I like to eventually own and I accumulate these stocks. Once a trade expires (or nears expiration) I re-open the trade or roll it into the next expiration (mostly trades that a stock is near the short strike and there is a risk of getting in the money).

We only adjusted a few new trades last week. The BP reduction increased from $36,124.40 to $37,123.70, a reduction of +$999.30 or +2.77%. This increase was just a volatility fluctuation.


Investing and trading ROI


Our options trading delivered a 12.79% monthly ROI, totaling a 34.89% ROI.

Our account increased to 99.85% YTD growth. We are about to double our money in the next month if this trend continues.
 

Our options trading averaged $3,586.00 per month this year. If this trend continues, we are on track to make $43,032.00 trading options in 2021.
 

We are still on track to complete goals in our portfolio. We made slight adjustments and we are providing our comments to our goals and tasks we set up in the week 6 report:
 

Old SPX trades repair


This week we have not done any adjustments to our old SPX trades. We are still sitting on those trades and waiting for the untouched side to close so we can roll the trades again. The goal will be to roll the trades until we will be able to close them for at least break even and release the buying power. We will keep doing this only if the resulting trade will be a credit trade or a very small debit. If adjusting these trades would require adding more new money, we would rather close these trades and move on.


Accumulating Growth Stocks


Last week I kept accumulating TSLA stock right before it started moving up again. Now we are sitting on a nice gain just a few days after our investment. We however limit our growth stocks holdings to 10% of our portfolio. Currently, we are at 15% and that means that next week or in the upcoming weeks, I will not be adding more shares (unless Tesla tanks so much that it would be a steal to invest).

I also kept accumulating Apple (AAPL) as the stock was displaying weakness. However, it looks like that the weakness in the tech stocks ended last week and these companies are in favor again and rallying. If so, it will be difficult to buy cheap (although, AAPL is not cheap even at this “cheap” level). AAPL is a dividend stock and part of my dividend growth investing strategy and I will keep accumulating this stock.


Accumulating Dividend Growth Stocks


Buying high-quality dividend stocks is our core strategy. And we will continue to do so and at a faster pace. I continued accumulating Realty Income (O) this week and as of today, we hold 55 shares.

We also accumulated ABBV and AES stocks and we hold 13 and 70 shares respectively.

We also plan on adding Eaton Vance Municipal Income Trust (EVN), PIMCO Municipal Income Fund III (PMX), and Eaton Vance Municipal Bond Fund (EIM) stocks. The reason for that is that although not dividend growth stocks, they pay a relatively good dividend, they pay consistently, and that are tax free.

Our goal is to not only reach 100 shares of high-quality dividend stocks but also create a weekly dividend income from these stocks All it takes to create a weekly dividend income is to buy 12 stocks to spread the income for every week. I created this dividend calendar and track the stocks I want to buy to get this goal done fast.
 

Weekly dividends income calendar
 

As you can see in the table above, we are reaching our weekly dividend income goal as almost all weeks are filled with dividend income. All that is missing is February and March first week “slot” (and subsequent months) but others are already filled. April should deliver an income every week. After we add all weeks, we will start increasing shares so the income is larger and larger every week. Also, note that I have included holdings of 100 shares in this table only. So, for example, we own 17 shares of AAPL and therefore it is not yet included in this table although we will receive income next month.


Market Outlook


Last week, I mentioned that the market was creating two significant patterns pointing to a potential rally up if these patterns play out. At first, the market had some struggle to break up and fulfill the patterns but then it spiked up on a strong note. Now we have the pattern completed and I expect it to continue.

 
SPX April 02 2021 outlook
 

Our expected price target is now at $4,200 for SPX. It is a measured move from the bottom of a cup (see the lower arrow) projected to the top of the breakout (see the second higher located arrow). I can’t predict whether this happens and if it happens, how long will it take to get there. It may be a strong narrow rally or a choppy painful move. We have to wait to see.


Trading options


We continue trading options around the stocks we own or plan to own (stock we do not yet own but we started trading options against them, see a book “Generate Thousands in Cash on your Stocks Before Buying or Selling Them“). I call it monetizing our positions. It has a threefold benefit. It lowers our cost basis (at some point we will own all our shares for free), covers our call sides of each trade, and generates an additional income on top of the dividends. And that income is significant as you can see from our report at the top of this post.

We added a few new trades to our portfolio and we are close to having our trading “full”, or be fully invested. Once that happens, we will start trading multiple contracts. As of now, we mostly trade one contract of strangles. I am still thinking about building a ladder using LEAPS against SPY and AAPL as of now but not yet decided.


Investing and trading report in charts


TW Account Net-Liq week 13
 

Our aggressive accumulation of dividend stocks, using proceeds from aggressive options trading (by “aggressive” I do not mean reckless, but using all available funds and be fully invested at all times), is delivering fruits. Our net liquidation value increased significantly this year. I expect this trend to continue. I am also preparing our account for portfolio margin and once we achieve the required net-liq value, I will add this feature to our account. I hope to be able to trade a bit more aggressively. And yes, I am aware of potential risks.

TW Account holdings week 13
 

The table above shows our current holdings and gains on those holdings. Adjusted columns indicate how options help to boost (or ruin) our stock holdings appreciation, or in other words, lowering the cost basis. Without options, our holdings would be up 7.99%. With options, our holdings are up 14.05% (from inception on 4/1/2019). The SPX is up 38.96% since inception. Since the inception of the fund, our stock holdings underperform the overall market (up only 14.05% on a cumulative basis). This week, our adjusted stock holdings underperformed the market. The market gained 9.12% YTD, our portfolio options-adjusted stock holdings grew by 7.07% YTD (note this includes stock holdings adjusted by options trading, not the entire portfolio).
 

TW Account holdings Growth YTD
 

The stock holdings growth dropped because we added many new positions and these positions didn’t have time to grow yet, so I expect the growth trend to improve over time and beat the market.

 
TW Options Income week 13
 

TW Options Annual Income week 13


Our dividend goal and future dividends


TW Received vs Projected Dividends week 12
 

I have added another view into our holdings and their expected performance. Below is a chart of all future expected dividends on our holdings. The chart above indicates our dividend goal rather than expected dividends, the new chart below indicates our holdings and their dividend payouts vs. received payouts. In other words, these are the dividends we should receive if we held these positions at the current level since January 1st. But because we have not held those positions since January, we will not be able to receive those dividends. We added new positions just recently so all dividends that are included in the “projected” value were not paid to us. But, if we stop investing now, the “projected” dividend value (currently $1,866.22) is the annual dividend rate we should be receiving as passive income every year without touching anything in our portfolio.
 

TW Received vs Future Dividends week 13


Our account cumulative return


This is another metric I started tracking (since March 13, 2021) recently. I subscribed to Wingman tracking software (I am on a trial now and not yet fully decided whether to keep it or not). And that helps to track the open positions and account balances without the hassle of doing it manually. I will see if I am happy with the result of the subscription or not.
 

TW cumulative return wk 13
 

As of today, our account cumulative return is 13.33% (since March 13, 2021).


Conclusion of our investing and trading report


This week our options trading was great and we created a lot of income making March our best month so far.

We will continue accumulating the dividend growth stocks in our portfolio to reach 100 shares. We will also replenish our cash reserves to bring them back to 25% of our current net-liq value.

We will report our next week’s results next Saturday. Until then, good luck and good trading!


We all want to hear your opinion on the article above:
No Comments


This site has been fine-tuned by 14 WordPress Tweaks