Another week of July is over and it is time to provide our weekly investing and trading report for our main business account. We run two accounts – one account is our main business account where we trade options against dividend stocks we either own or plan on owning. Our second account is a challenge account that is designed for beginning investors starting with little money to invest and grow their account from $100 to $75,000. We provide a report of our business account (the main account) every Saturday on weekly basis and we provide our challenge account review every month on Monday evening at the beginning of each month.
Closing strangles positions
When we open a new strangle trade as I wrote about last week our main goal is to keep that trade running all the way to expiration. If everything goes well and the stock doesn’t move violently to either side, we let it go and let it expire.
Sometimes, the stock runs up or down hard, and either our call or put side gets challenged. That is the time we start watching our position carefully and if any of this situation happens we roll the trade:
&nbs;
The challenged side gets beyond delta 30
In this case, we review how much buying power would be released if we roll the trade. If the roll releases $800, $1,000, $2,000, or more of the buying power, we will roll the trade. But it must be a roll for credit. If a rolling trade would result in a debit trade, we would probably let it go and accept the assignment. But if the trade was naked and we do not have enough cash (or 100 shares) to accept the assignment, we roll farther away in time to make sure the trade will bring in credit, even a small one.
&nbs;
The challenged side gets in the money
A stock drops so fast that we are unable to roll soon enough to keep the price between the strikes. In this case, we roll the trade for sure. We roll lower (or higher) and away in time. If the stock was near the money or at the money (but still in the money), we can wait a bit or we can roll in the next expiration day, and we roll the challenged side out of the money. But again, such rolling must result in a credit. If the next expiration day rolling still requires debit, we go further away in time and we go as far away as it turns from a debit trade to credit trade.
The challenged side gets deep in the money
If the stock gets deep in the money due to a market selloff, we again do the exact same moves as described above but we do not go into the next expiration day. We go to 90 DTE or farther away. Why? We want to avoid early assignments. We then maintain that trade at 90 DTE or farther until we are able to roll the trade closer to the money. In order to roll deep in the money strangle, we sometimes have to change the trade to a staddle (meaning we bring the trade calls and puts strikes together). That helps in rolling the trade away for credit.
trade.
None of the above helps
If none of the above-mentioned strategies help, for example rolling would require adding more money or more buying power at the bad trade, we then take assignments. But if we do not have enough cash for put assignment, we start rolling the trade away in time as is. No changing of strikes, only moving it away in time. Usually, the opposite side brings in enough credit to offset the cost of the challenged side. This buys us time to accumulate cash and take a stock assignment. If it is a call side, we start hedging the trade by buying shares to cover the call side. If this is not feasible (for example our call strike is at $30 a share and the stock is trading at $100 a share then hedging makes no sense. In this case, I add a put and sell 2 puts to roll 1 call. It is a kinda uneven strangle. But it takes planning, releasing cash for the new obligations. If your account is stressed, then just roll until you are ready to let it go (or the market decides to work with you, and the stock retreats and allows you to roll up (or get out).
trade.
Just do it
When doing all these adjustments, you must do it. You must try it. I always play with those adjustments, meaning I am simulating them. I do not place those trades but I simulate the adjustments to see what the trade would look like and what the result would look like if I do that adjustment. When I am happy with what I see, I do it. If not, I rather wait. It’s a game and you have to play it. If you are not sure, just roll the entire trade away as is – same strikes just longer expiration until you find a solution you like.
As I said a few times before, options are a fluid trading vehicle. No rules are set in stone. The best way to find a solution to a bad trade is to play with it. What worked once may not work again this time and something else would work better.
Here is our investing and trading report:
| Account Value: | $73,733.99 | -$254.28 | -0.34% |
| Options trading results | |||
| Options Premiums Received: | $719.00 | ||
| 01 January 2021 Options: | $4,209.00 | +16.65% | |
| 02 February 2021 Options: | $4,884.00 | +15.41% | |
| 03 March 2021 Options: | $5,258.00 | +12.79% | |
| 04 April 2021 Options: | $2,336.00 | +4.30% | |
| 05 May 2021 Options: | $6,346.00 | +9.22% | |
| 05 June 2021 Options: | $4,677.00 | +6.37% | |
| 06 July 2021 Options: | $2,083.00 | +2.83% | |
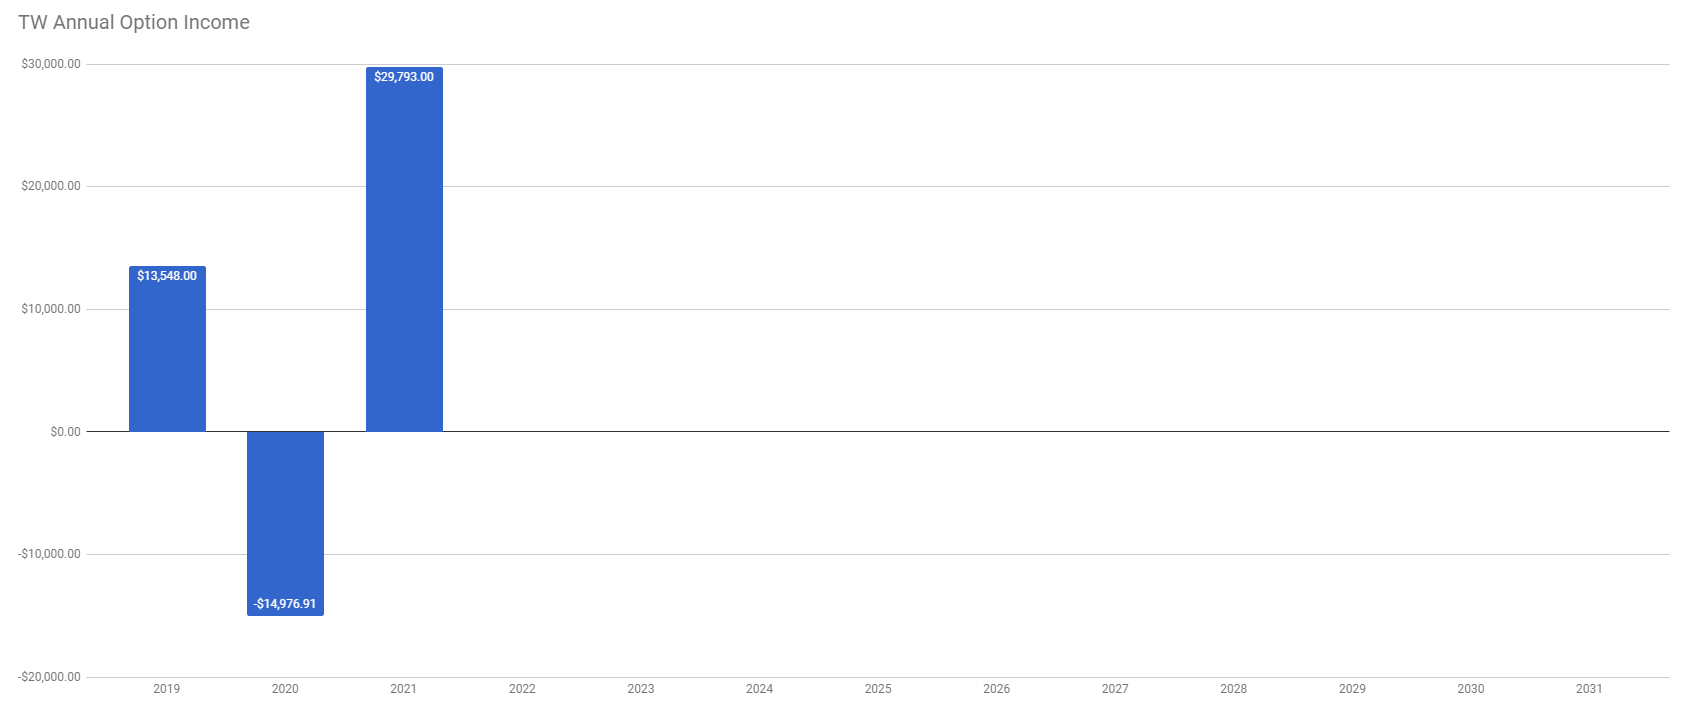
| Options Premiums YTD: | $29,793.00 | +40.41% | |
| Dividend income results | |||
| Dividends Received: | $23.55 | ||
| 01 January 2021 Dividends: | $53.04 | ||
| 02 February 2021 Dividends: | $63.00 | ||
| 03 March 2021 Dividends: | $30.31 | ||
| 04 April 2021 Dividends: | $139.70 | ||
| 05 May 2021 Dividends: | $167.45 | ||
| 06 June 2021 Dividends: | $168.56 | ||
| 06 July 2021 Dividends: | $157.40 | ||
| Dividends YTD: | $820.94 | ||
| Portfolio metrics | |||
| Portfolio Yield: | 4.69% | ||
| Portfolio Dividend Growth: | 8.47% | ||
| Ann. Div Income & YOC in 10 yrs: | $17,602.81 | 19.67% | |
| Ann. Div Income & YOC in 20 yrs: | $169,107.79 | 189.00% | |
| Ann. Div Income & YOC in 25 yrs: | $878,423.27 | 981.73% | |
| Ann. Div Income & YOC in 30 yrs: | $7,689,838.06 | 8,594.24% | |
| Portfolio Alpha: | 32.92% | ||
| Portfolio Weighted Beta: | 0.72 | ||
| CAGR: | 744.27% | ||
| AROC: | 31.64% | ||
| TROC: | 19.63% | ||
| Our 2021 Goal | |||
| 2021 Dividend Goal: | $1,071.42 | 76.62% | |
| 2021 Portfolio Value Goal: | $42,344.06 | 174.13% | Accomplished |
Dividend Investing and Trading Report
Last week, we have received a $23.55 dividends income. We feel that the income will be growing faster as more of our holdings mature and become eligible for dividend payouts. According to our holdings currently on our balance sheet, all stocks should generate $4,044.00 annual dividend income. It is not as of yet because many of the stocks were purchased recently and we missed their dividend. But next year, we should be receiving the full amount.
The chart below indicates our current annual dividend payout from our dividend stock holdings.
Last week, our dividend income reached 76.62% of our dividend income goal.

Options Investing and Trading Report
Last week we rolled a few trades to release a stressed buying power in our account. We rolled TSLA, SPCE, SPX, BA, AAPL, CROX, CSCO, MU, TSN, OXY, DKNG, and IJS. These trades are now in good shape and some were ready to expire worthless for a full profit.
We opened new trades against QYLD (short put), and PMT (short put).
We had 8 trades that expired on Friday:
1 KBE Jul16 47 put / 61 call strangle for 0.80 credit
1 KBE Jul16 54 covered call for 0.27 credit
1 APAM Jul16 45 put / 55 call strangle for 1.60 credit
1 AES Jul16 23 put / 27 call strangle for 0.55 credit
1 SNOW Jul16 295/300 call credit spread for 1.49 credit
1 OXY Jul16 25 put / 33 call strangle for 0.52 credit
1 O Jul16 65 put for 0.37 credit
We will be reopening these trades during the next week or two.
The new trades and adjustments delivered $719.00 options premiums last week.
You can watch all our trades in this spreadsheet and you can also subscribe to our newsletter for our trade alerts.
Expected Future Dividend Income
As the table at the beginning of this report indicates, our aggressive dividend growth stocks accumulation is starting to show significant progress in our future dividends income. Our portfolio dividend yield and dividend growth will be bringing us almost $169,107.79 in 20 years and $7,689,838.06 in 30 years. I wish, I had that $7 million income now. But that is the fate of dividend growth investing. It is not a quick rich scheme and building an account takes time.
We will keep aggressively accumulating dividend growth stocks to generate liveable income sooner than in 20 years. And the portfolio is starting to show this to be happening. In just 10 years, we will start receiving $17,602.81 in today’s dollars. It is not bad considering that in March 2021 it was only $3,202.52 in projected future dividends.

The chart above shows how our future dividend income is based on the future yield on cost and what dividend income we may expect in the future. The expected dividend growth depends on what stocks we are adding to our portfolio and the stocks’ 3 years average dividend growth rate. It is interesting to see what passive income we may enjoy 10, 20, 25, or 30 years from now.
Market value of our holdings
Our non-adjusted stock holdings market value increased from $93,468.90 to $94,437.23. Last week, we added 50 shares of QYLD, 10 shares to ICSH, 1 share of SNOW, and 20 shares to PMT.
We use ICSH as a savings account and as of today, we are mostly in a preservation mode. We feel like our balance sheet is way aggressive and has no cash reserves. Therefore, we are mostly adding money to our cash reserves.

Our goal is to accumulate 100 shares of each stock of our interest and we are getting to that goal.
Investing and trading ROI
Our options trading delivered a 2.83% monthly ROI in July 2021, totaling a 40.41% ROI YTD. We are getting close to our 45% mark!
Our account grew by 258.41% this year despite very slow growth in June and July. I suggest the growth was suppressed by the market volatility and options trades increasing their maintenance requirements that ate the net-liq value. Once the options expire (hopefully) the net liquidating value will go up faster.
Our options trading averaged $4,256.14 per month this year. If this trend continues, we are on track to make $51,073.71 trading options in 2021. With the income of $29,793.00 to date, we are half way to this projected income.
Old SPX trades repair
This week, we rolled our old SPX trades way higher and away in time. I am not yet decided what to do with these positions. My original plan to try to roll it out of the money doesn’t work. So, I am now thinking to keep the trades rolling until I will be able to apply for portfolio margin and convert these Condors into strangles. With a portfolio margin, I will only need about $10,000 buying power per strangles. With a Reg-T margin, I need $55,000 buying power. Not feasible to trade under such circumstances.
Accumulating Growth Stocks
Last week, we added 1 share to our SNOW position.
Accumulating Dividend Growth Stocks
Last week, we added 50 shares of QYLD, 10 shares of ICSH, and 20 shares of PMT to our dividend growth positions. In the upcoming weeks, we will be accumulating aggressively the higher yield income stocks to boost our dividend income furthermore.
Our goal is to reach 100 shares of high-quality dividend stocks and build a weekly dividend income as per this calendar, but we have made no changes to this goal last week:

You can see the entire spreadsheet here.
Market Outlook
The market was going up last week and it reached (almost) our price target. It got close to it. But that move upwards was not very convincing. It was in fact very weak move and we had a few hiccups on the road up. A week ago, the market dropped on inflation fears but recovered quickly just to lose it all again at the end of this week.

The market is looking for direction. And this trend may continue for a week or two. We may also see a correction of 10% (more or less). And honestly, even though the market may continue higher, I am more and more in favor of seeing a correction sparked by inflation fears.
But I am in the FED camp, or Jerome Powell’s camp, who insists that the inflation is transitory. I agree with that. I agree with renowned economist Lacy Hunt who says inflation is transitory and typical to recovering economies. We had a spike in inflation after every recession. We had a spike in inflation in 2009 after the economy started recovering from the Great Recession and people were predicting another crash. Remember that? Many were predicting a crash all the way until 2013-2014! But that never materialized.
Inflation doesn’t cause a recession. It is an effect of a recession. When businesses came to life after March 2020 40% crash boosted by the US government support and people receiving stimulus checks (in a similar manner as we experienced in 2009) it is obvious that there would be a spike in inflation. And there will be the same exact doom and gloom talk about it.
I still remember some pundits saying in 2009 – 2013 that this would all end badly because FED lowered interest rates to zero, started a huge QE program, and as interest rates started skyrocketing FED would have nothing left to fight it off. Well, 13 years later, history repeats itself.
Here is a video of an interview with Lacy Hunt and his excellent presentation. I would like you to watch it. It will give you a great insight into the economic behavior around recessions. How GDP behaves? Money flow and money supply? Inflation? We have experienced it all in 2009 and people already forgot.
So, if you see the market selling off on fear of inflation, buy. It is a dip that will leave naysayers and doom predictors biting the dust.
But, this doesn’t mean that the market will not sell-off. As I mentioned above, I expect it to cool off a bit. I expect it to retest our previous breakout and go lower to a $4,250 level. It may be just a one-day dip, quick and fast, that would recover quickly, or it may not materialize at all.

One reason for this expectation not happening is simple – earnings, earnings, earnings. And we just started another earnings season and so far, the companies are beating it. And as in real estate, location is the most important factor driving prices, in the stock market, it is earnings. And the market trails the earnings predictions so far. When we see earnings going down, expect problems:

Based on these estimates, the SPX should be trading at $3,394.00, 27% lower than today, and based on the future earnings estimate, the SPX intrinsic value is at $4,119.36 (5% below the current price). The stock market is pricing the price range to be at $4,080.00 and 4575.00. With this cold market looking for a direction, it is difficult to say where it wants to go.
Investing and trading report in charts
Account Net-Liq

Account Stocks holding

Our stock holdings still do not beat the market. However, I expect it to change over time. S&P 500 grew 49.59% since we opened our portfolio while our portfolio grew 16.39% only. On YTD basis, the S&P 500 grew 19.74% and our portfolio 9.41%.
But the numbers above apply to our stock holdings in our account, not the overall account net-liq growth. Our overall account beats the market growing by 258.41%!
Stock holdings Growth YTD

I expect our stock holdings to start outperforming the market as they mature. However, these are just our stock holdings. The entire portfolio beats the market by far thanks to monetizing those positions.
Our goal is to grow this account to $1,000,000.00 value in ten years. We are in year two.
Investing and Trading Report – Options Monthly Income

Investing and Trading Report – Options Annual Income
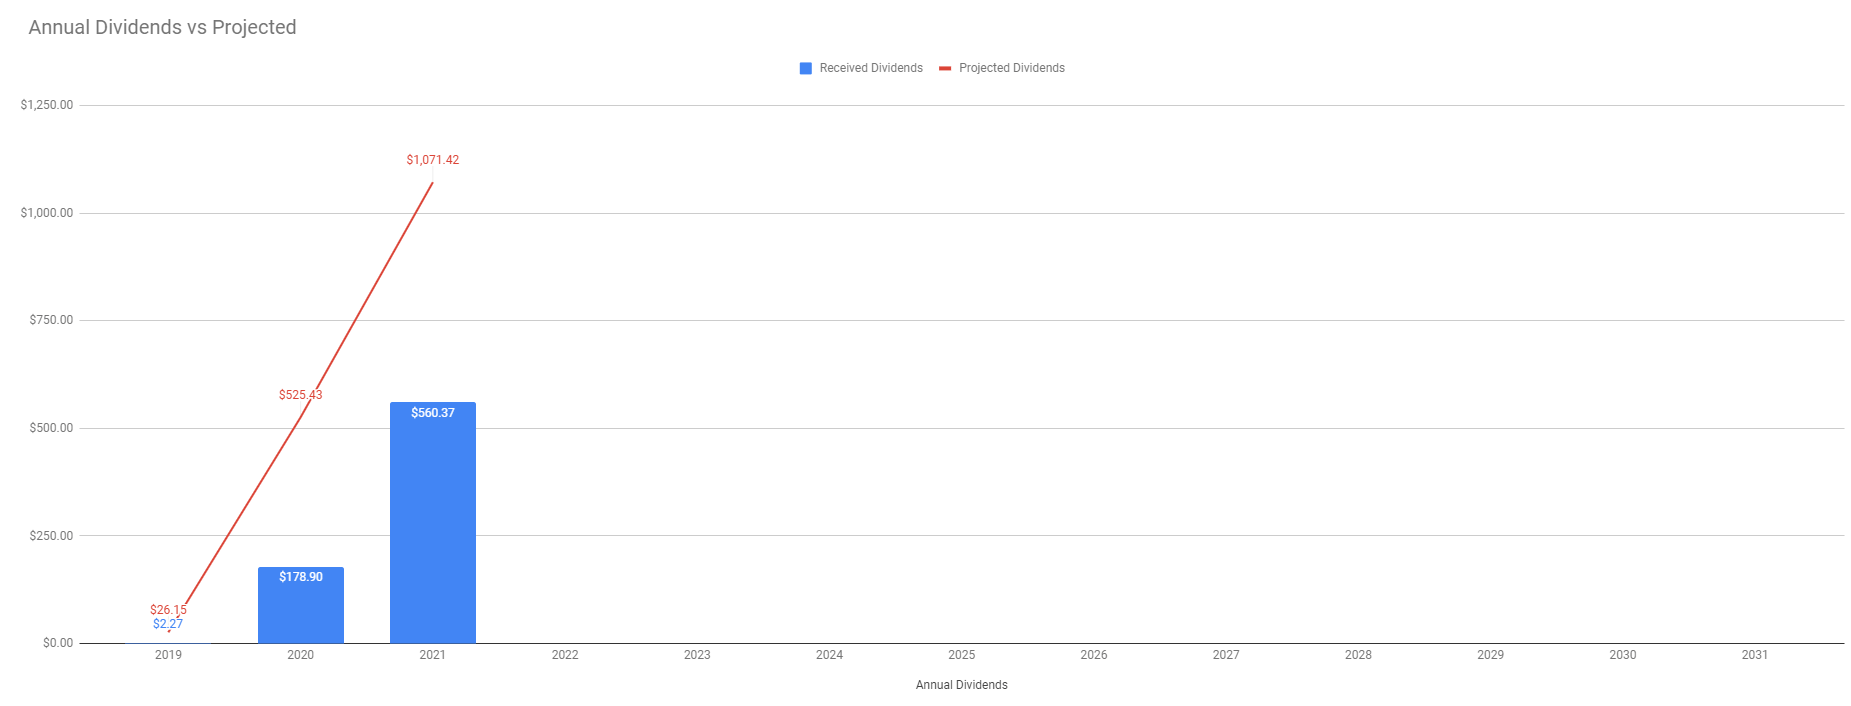
Our dividend goal and future dividends
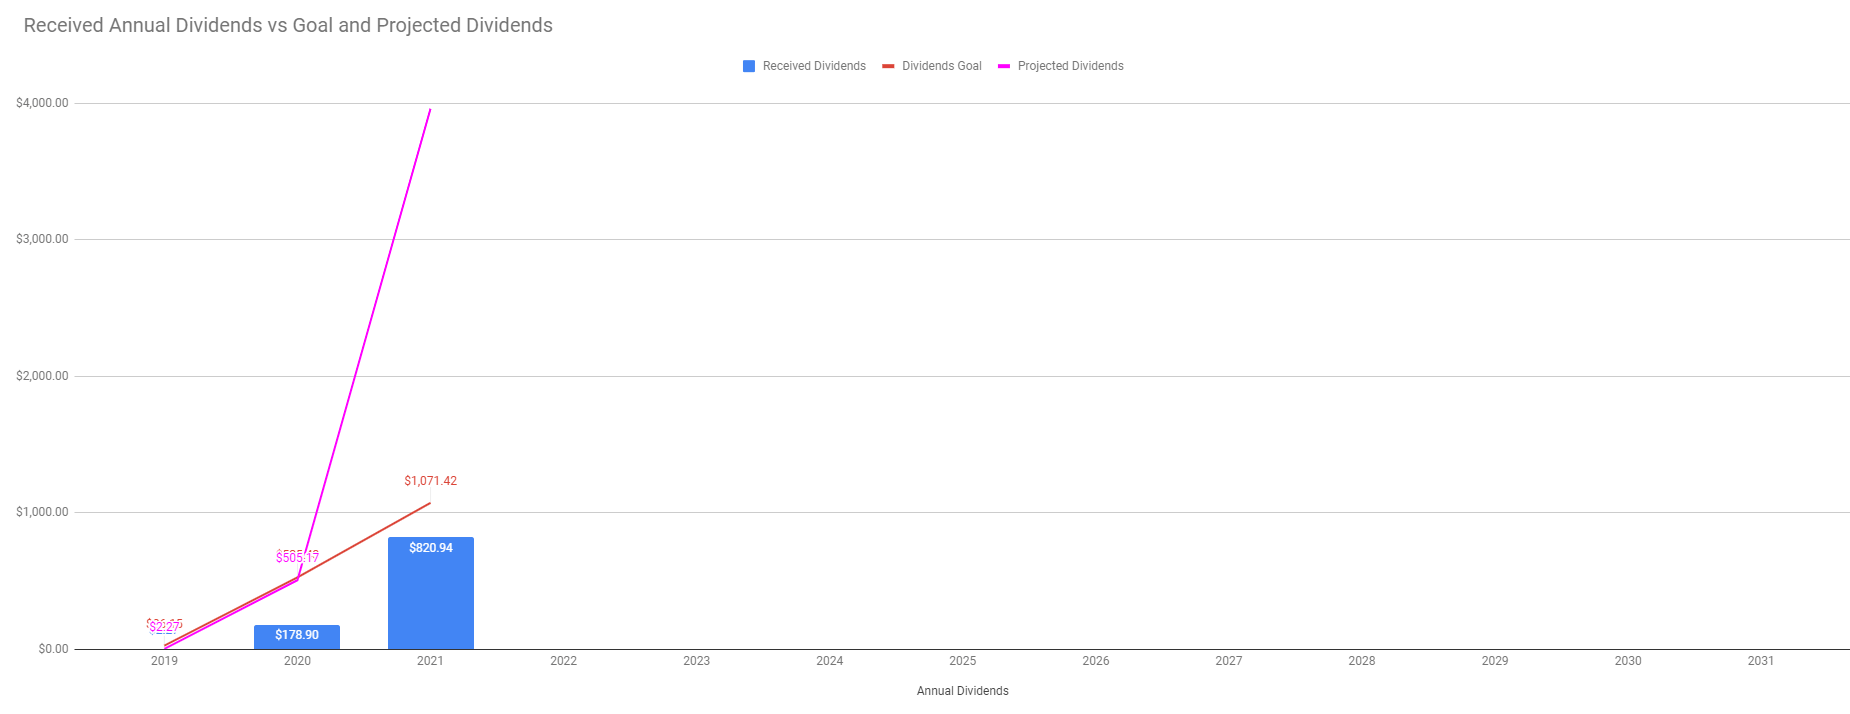
We are on track to accomplish our dividend income goal, currently, we are at 76.62% of the goal to reach $1,071 of dividend income this year. Currently, we accumulated enough shares to receive $4,044.00 in annual dividends if we have held through the entire dividend cycle.

The chart above is the corrected chart comparing the projected MONTHLY dividend income vs received dividend income. And again, the projected dividend income is based on the stock holdings up to date. That is the income we would have received if we have held over the entire dividend cycle.
Our account cumulative return
The chart below indicates our cumulative adjusted return. It shows how the last week’s selloff shook down our returns but we are recovering along with the market.

As of today, our account cumulative return is 28.50% (since March 13, 2021).
Conclusion of our investing and trading report
This week our options trading exceeded our expectations. I hope, the rest of the month will be even better.
We will continue accumulating the dividend growth stocks in our portfolio to reach 100 shares. We will also replenish our cash reserves to bring them back to 25% of our current net-liq value.
We will report our next week’s results next Saturday. Until then, good luck and good trading!
|
We all want to hear your opinion on the article above: 1 Comment |


Recent Comments