Weekly Newsletter   Challenge account   Weekly Newsletter   


Posted by Martin August 26, 2020
5 Comments


Where to store cash for a while?


Account Net-Liq: $7,437.20
SPX value: 3,479.73
Shiller PE: 32.01
 

I was looking for opportunities where I can store my cash in my trading account in lieu of leaving it in the account, sitting there and doing nothing.

I also didn’t want to withdraw them and save it in a savings account. That would work against my Net-Liq.

I also wanted the money to be blocked, so I couldn’t use them in other trades. I am now saving cash for another trade I want to take (buy LEAPS against SPY and start selling covered calls) and I must admit my discipline is not yet perfect and I might be tempted to use that money on another trade. So locking the cash in equity which would not lose value and even make some would be perfect.

But, where could you put your money, short term, preserve their value, and maybe make some? Make better than 0.0009 APY the broker may pay you for cash?

This is a question to savers all around the world too. If you look at the current savings accounts rates, you would want to cry!

 
High Yield Savings Accounts Yields
 

The rates are pitiful and they may drop even lower. Poor savers! Retired people who depended on CDs or savings accounts are ruined.

I finally found a good opportunity! Thanks to another investor in a Facebook group, who pointed me to an opportunity which may do exactly what I am looking for – safety, stability, and some decent income.
 

iShares Ultra Short-Term Bond ETF (ICSH)
 

ICSH is a short term bond ETF that seems to fulfill my needs. It holds its value (slightly going up), it pays dividends (nothing extra), the yield is about 2.20% at the current price of $50.56 a share, but definitely better than today’s high yield savings accounts) and during March selloff it only lost about 4.45% while the entire market lost almost 40%. Not bad in my opinion. And, it pays a monthly dividend.

 
iShares Ultra Short-Term Bond ETF (ICSH)

iShares Ultra Short-Term Bond ETF (ICSH)
 

I believe, this is a good way to hold cash, or if you are afraid of the stock market, or a retiree and looking for a savings account which pays better yield (a lot better) than current high yield savings accounts, then, in my opinion, ICSH is a good option to do.

Thus, my goal is to save $4,000 in my brokerage account and then buy SPY LEAPS calls and start selling covered calls. I will be saving my cash using ICSH.

 
My 2020 investment goal


If you are interested to see what stocks and what options we trade, then join us at MeWe. We no longer participate at Facebook (very little though) but we are active at MeWe.


We all want to hear your opinion on the article above:
5 Comments


Posted by Martin August 16, 2020
1 Comment


How much do you need to make $1,000 in dividends per month?


I keep seeing people asking this question all the time. It is a bit surprising that people ask that question as it is very simple math to do. Well, it depends on your approach.

If you have a lump sum that you can invest immediately then the math is really simple. If you do not have time and you will be building your portfolio over time then it may be a bit tricky because you need to take into account dividend growth (while ignoring capital appreciation as it would complicate the numbers even more).

Lump-sum

So, let’s say, you have the lump sum available, or you want to know the lump sum needed to invest to achieve $1,000 a month immediately after you invest.

First, let’s assume, that you already selected dividend stocks you want to buy and know that your dividend income would be the same every month. Note that not all stocks pay the same dividend so you may need to buy a different amount of shares of every stock to achieve equal dividend payout every month.

Once you have that figured out, then the math is simple. To achieve $1,000 a month in dividend income, you need:

Dividends are rated annually (although most are paid quarterly the dividend rate and yield is quoted in annual terms. So, you have to annualize your income too. A $1,000 a month is $12,000 annual income.

Now, you need to figure out, what your portfolio yield is. Look at your stocks and calculate the average dividend yield of all of them. Let’s say, your dividend yield would be 3.5% annually.
 

Now, that you know your annual yield, you know that $12,000 annual income equals 3.5% of the total invested amount. Solving for the total amount is now easy:

$12,000 / 3.5 = 3,428.57 (you just got what 1% of the invested amount is).
 

Now, multiply by 100:

3,428.57 * 100 = $342,857.00
 

You need $342,857.00 invested right now to achieve an immediate $1,000 a month dividend income.
 

Let’s check our math and calculate our income reversing the math:

$342,857.00 * 0.035 = 12,000 / 12 = 1000
 

We multiplied our total lump sum by the portfolio dividend yield and got 12,000 annual dividend income. Divided by 12 months we arrived at 1,000 a month. Our math was correct then.

Conclusion: you will need $342,857.00 to invest right now for a portfolio with a 3.5% yield to achieve $1,000 a month.

Of course, if your yield is lower, you will need more, if your yield is higher, you will need less.
 

Next time we will look at the math in case you do not have the money and you will be building the portfolio over a certain time (you will need less money to achieve the same goal).


We all want to hear your opinion on the article above:
1 Comment


Posted by Martin August 15, 2020
No Comments


Monthly or quarterly dividend stocks? Which is better?


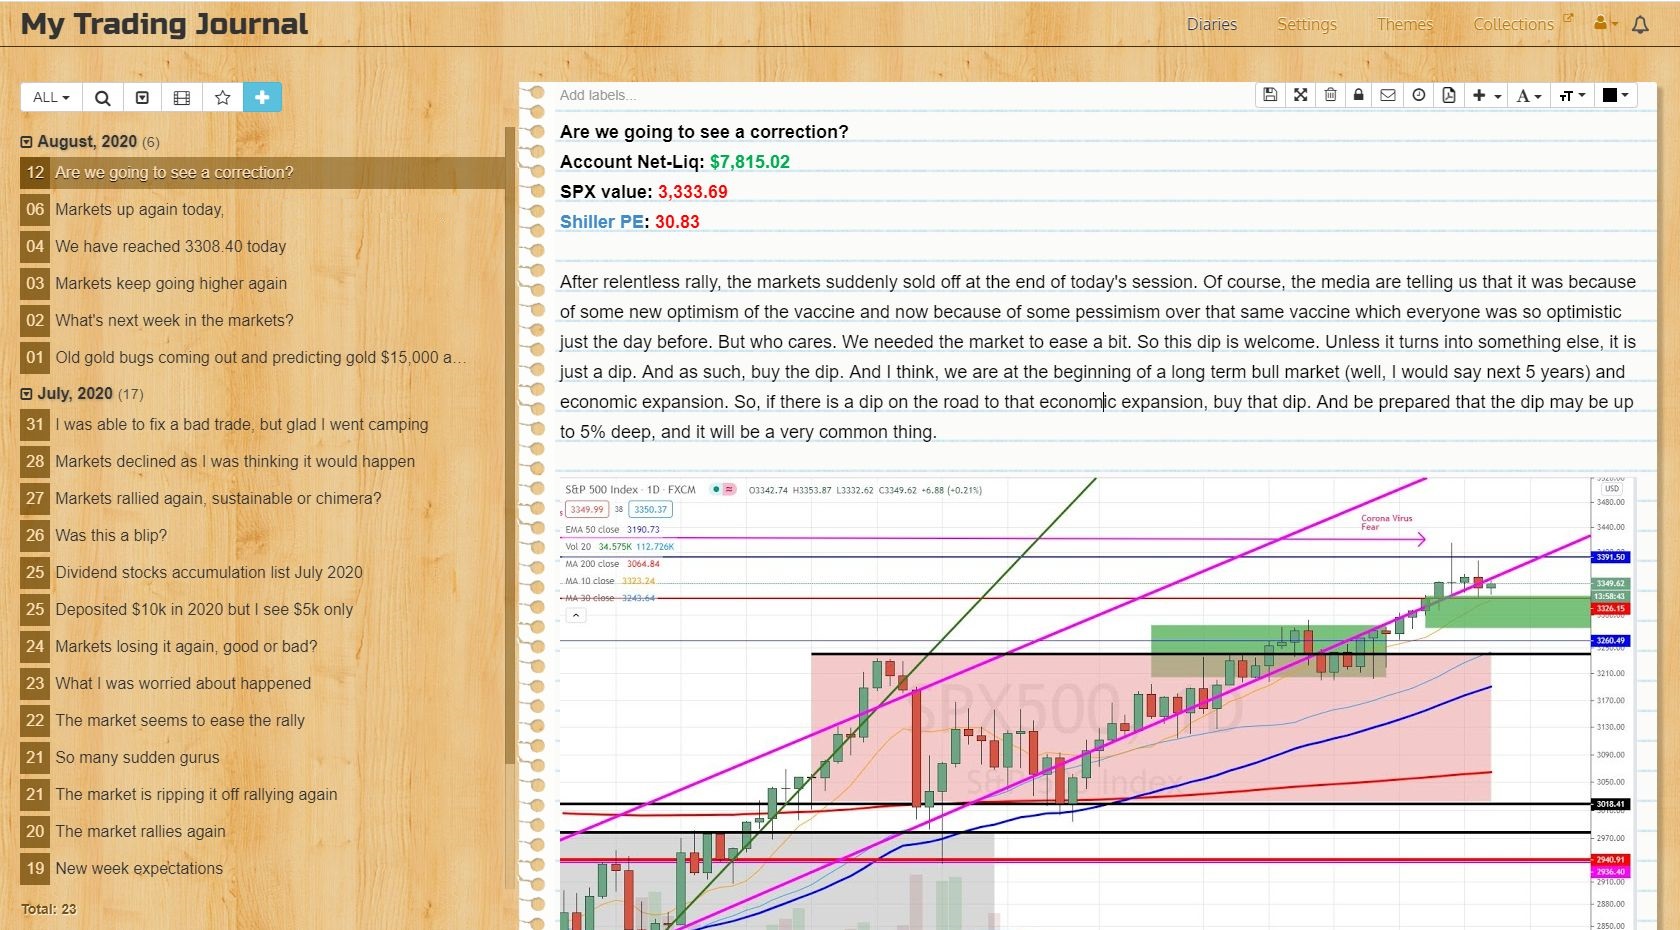
Account Net-Liq: $7,676.23
SPX value: 3,372.85
Shiller PE: 31.20
 

I wondered all the time whether it is better to own monthly or quarterly dividend-paying stocks. The narrative goes, that with monthly paying stocks, your dividend compounding will go faster and you get better results over time.
 

  1. Well, the truth is, it doesn’t matter.
  2. You will not get any better results with monthly payers than quarterly payers. The difference is so insignificant that it doesn’t justify the pitfalls of investing in monthly payers.
  3. Investing in monthly payers is just psychological. All it does is that you feel better about your dividend portfolio.
  4. Unfortunately, most monthly payers are in REITs, BDCs (Business Development Companies), or MLPs category, and except a few, risky and garbage not worth your money.
  5. There are better ways to create monthly dividend by staging quarterly payers together. If you select high-quality dividend aristocrats, it will take just 12 stocks to create monthly dividend payments.
  6. Use options to boost your income rather than trying to compound dividends alone.


I too felt like if I am buying monthly dividend-paying stocks, I will be better off. My portfolio would grow faster because I will be getting my dividends more often and thus buying more shares more often and snowballing my dividend income. But I never put the math behind my thinking. And the feeling about the income boost was so good.

But there was something back in my head which was telling me that something was not right, so I sat down to do the math. I hoped to prove myself that by buying monthly payers, my portfolio would grow faster, bigger, and fatter. And I will be rich in 5 years instead of 40 years.

The first thing, which came across my mind was: well, with monthly dividend payers, I get a smaller dividend every month than in three months, I will get the same amount of dividends as in three months. And I will be able to buy the same amount of shares no matter when I get the dividend. At the end of the three month period, I will have the same dividend and same amount of shares no matter if I received the dividend and reinvested it every month or at the end of a quarter.

There is a difference in compounding though. I am not saying that it is all the same. But the difference is so insignificant that it makes no sense to chase monthly payers and put your money in a larger risk.


I decided to use Gladstone Investment Corporation (GAIN) as an example. GAIN is a widely used darling among dividend investors. I hold a few shares of this stock too, but I am a bit hesitant investing my money into this stock thanks to my past bitter experience with this type of company.

 
Gladstone Investment Corporation
 

The company was around since 2005 and diligently paid its dividend since then every month. Unlike others, the company never split its stock which is a good thing. It seems, it also never issued an SPO (Secondary Public Offering) which is also a good thing. Splits (reverse splits), SPOs, and dividend cuts are always a sign of value destruction, and if you see your company engaging in this practice, run away. Gladstone seems never engaged in this practice.

The price action of the stock is not very appealing. Right after its inception, the stock got hit hard in 2008-2009 and it dropped from $15 a share to $2.5 a share. From 2011 until 2016 the stock was trading sideways in a multiyear consolidation pattern. It broke up, reached its peak of $15 a share from the pre-2008 crisis, but soon was again hit with the 2018-2019 trade war volatility and in 2020 with the COVID fear. As an investor, you would have to sustain this volatility and rely on dividends only. Unfortunately, the dividends were not any better either. Here is a dividend history since inception:

 
GAIN dividend history
 

As you can see, the dividend history is littered with cuts, misses, spikes, lack of growth. If you are a retiree, would you invest hundreds of thousands of dollars in such stock to suffer from price volatility and unstable dividends to live off of them? And if you invested in this stock in 2014 and bought 1000 shares, your initial investment of $8,040 would grow to $9,765 today. A meek 21.46% return over 6 years.

I wanted to see if I compounding the dividend would provide a better result and compared monthly compounding with quarterly. The difference was staggering (well, the lack of any difference).

If I bought 100 shares of GAIN and compounded dividends monthly vs. quarterly for the next 10 years, I would achieve the following results:

 
GAIN dividend compounding
 

It is evident that the difference between the two is so small that it doesn’t justify putting your money into riskier monthly payers. If you feel that the monthly payer will give you better results, then it is just a feeling.


Many monthly dividend-paying stocks are among REITs, BDCs, or MLPs. And, unfortunately, these stocks are very low quality. There are a few exceptions though. Well, I can only think of one stock exception – Realty Income (O). Everything else out there is garbage, in my opinion.

I used to invest in these stocks but, mostly, I lost money, and dividends received were never able to recover the capital loss, not mentioning providing a sustainable income. And you want income to live off of it not recovering losses.
 

I used to invest in AGNC. Constant dividend cuts and capital depreciation caused my investment to be destroyed. The stock went from $40 a share to $14 a share today. Received dividends never covered the loss.
I used to invest in VNR. The stock went eventually bankrupt and I lost the entire investment. Dividends were not able to cover the loss.
I used to invest in PSEC. The stock fell from $18 a share to $5 a share while the company was constantly cutting dividends. Dividends never covered the loss.
I used to invest in ARR. Another example of value destruction. Constant dividend cuts and reverse split destroyed my value. Dividends were never able to cover the loss.
 

There are many other examples of companies in REITs, BDCs, and MLPs category which would effectively destroy your value. There is no justification to buy these companies when they pay monthly dividends because you may think that they would grow your portfolio faster. They most likely won’t.

The only black sheep (or rather a white sheep) among these stocks is Realty Income (O). It is a company which prides itself to provide value to their shareholders and keep a monthly income coming every month after month. The company even increases its dividend every year (sometimes multiple annual increases). They are proud of it. They know many retirees depend on them, and they strive to not disappoint them. You won’t find many shareholders friendly companies out there such as Realty Income. They even advertise themselves as The Monthly Dividend Company that:

“…started with a simple idea – to use the rent collected from commercial properties held under long-term leases to support monthly dividends to shareholders.”

That, in my opinion, is the only company in the monthly dividend REITs category worth your investment.


To create monthly income, the only feasible way is to use quarterly dividend payers and stage them so you receive the dividend every month. It takes some effort but you can select stocks in that way that you receive dividends every month. It only takes 12 stocks to create monthly dividend payouts. And, what’s best with this strategy? You can fish among good quality dividend aristocrats. You can choose reliable companies that will grow dividends every year and sustain any recessions without cutting the dividends. Your value will not be destroyed and your income will grow. You will be able to use dividends for your living expenses and not value recovery.


How can you boost your dividend income then if monthly dividend payers can’t provide it? The only way I know of is to use options. It takes some effort to learn options but if you use a simple strategy of selling covered calls and cash-secured puts to boost your re-investable income, you will not do badly. Your portfolio will grow faster. And what’s best is that you can create a monthly income selling covered calls against your existing quarterly dividend-paying stock.

I traded options in the past a lot. I traded strategies such as Iron Condors, straddles, and strangles. But I traded them for pure speculation. There was no strategy behind the trading. The problem was, I traded just because I had to trade. I had to be in the trade all time and I falsely believed that this would make me rich and my portfolio will grow fast. No, it didn’t. I lost money and I am where I was 6 years ago. I recommend you not going this path. It is a dead-end. It is also a daring admission to finally admit to myself that I was wrong. Or maybe not wrong, just not skilled enough, not educated enough, not a great trading guru as so many on Facebook, who are making millions in a year and never lost a penny (well, maybe only a few pennies).

Since I am not this miraculous financial, CPA, millions making guru from Facebook, I had to adjust my strategy to something more conservative but stable. My goal always was to create income from my investments which can be re-invested to grow my portfolio into a level where the income starts covering my expenses and I can quit my daily job and live off of my dividends and trading. And I had to adjust my mind and my strategy to achieve this goal. And it is working! Finally!

What I decided to do is to accumulate a few good quality dividend stocks and reach 100 shares of each. Then apply a strategy called a “Wheel of fortune“, or a Wheel strategy.

In short, I accumulate shares of my high-quality dividend aristocrats and once I have 100 shares, I start selling covered calls. I try to avoid assignment and have my shares called away should the stock go higher and breach my call strike. In this case, I roll the call higher and usually away in time. I keep receiving dividends and options premiums. If everything goes well, I keep generating income every month, and once every three months I receive two payments (dividends and options premium). Sometimes, I have to roll my options two or three months away to roll higher for credit. And I am OK with that.

If the stock gets called away I start selling cash-secured puts to generate monthly income and eventually buy my stock back and gain 100 shares again. Then I start selling covered calls again.

If I have enough cash in my account to start selling puts before reaching 100 shares of a stock, I start selling puts. Sometimes, I sell the puts without a desire to get assigned and be forced to buy 100 shares of the stock. But in this scenario, I make sure, I do not overdo put selling so if I get assigned I do not suffer huge losses.

I also use this strategy of options selling to replace dividend cuts. In 2020 many great companies decided to cut or suspend dividends. Disney (DIS) suspended its H1 (first half of the year) dividend, Helmerich & Payne (HP) cut the dividend (HP was a dividend aristocrat with 47-year dividend increases), Wells Fargo (WFC) cut the dividend by 80%, Meredith (MDP) cut the dividend after 27 years of dividend increases, Dominion Energy (D) cut the dividend, BP, BA, cut the dividend, and these are only among the good quality stocks that cut their dividends. Many not so good quality companies cut the dividends too. And, unfortunately, we may see more cuts or suspensions coming.

Selling options looks like the only way to replace the lost income. It also lowers your cost basis so you hold the stock cheaper and cheaper every year. At some point in the future, you will hold the stock for free (the dividends and options premium income will return you all your investment) and in that case, it won’t matter to you what the stock is doing out there.

I also use LEAPS instead of a stock. Usually, I use LEAPS against indexes such as SPY or IWM. To buy 100 shares of SPY at a current price of $336.84 a share, an investor will have to come up with $16,836.32 in a margin account or $33,672.08 in a cash account (such as IRA). Purchasing LEAPS call option would cost $3,941 only. A fraction of what you would need if buying 100 shares.

Recently, I have purchased IWM LEAPS and started selling covered calls against the position (a strategy called Poor man’s covered call). It only cost me $2,255.00 to buy the LEAPS call option. After the purchase, I started selling the covered calls and received $265 in credits. That lowered my cost basis to $1,990:

 
IWM Poor man's covered call
 

And, I can reinvest the options income to other stocks and keep accumulating and growing my portfolio. It is not a quick-rich scheme. It is not trading the millionaires from Facebook preach. But it provides a steady income and portfolio growth. And since I started using this strategy, I sleep better. I do not have to be glued to the monitor every Friday to see if my options expire or I will lose money. And, what’s most important? I see my accounts growing again.


If you are interested to see what stocks and what options we trade, then join us at MeWe. We no longer participate at Facebook (very little though) but we are active at MeWe.


We all want to hear your opinion on the article above:
No Comments


Posted by Martin August 12, 2020
No Comments


Stock market expectations


Account Net-Liq: $7,735.95
SPX value: 3,380.35
Shiller PE: 31.27


This is an entry I wrote into my Trading Journal yesterday about the market behavior:
 

Are we going to see a correction?
Account Net-Liq: $7,815.02
SPX value: 3,333.69
Shiller PE: 30.83
 

After a relentless rally, the markets suddenly sold off at the end of today’s session. Of course, the media are telling us that it was because of some new optimism of the vaccine and now because of some pessimism over that same vaccine which everyone was so optimistic just the day before. But who cares. We needed the market to ease a bit. So this dip is welcome. Unless it turns into something else, it is just a dip. And as such, buy the dip. And I think, we are at the beginning of a long term bull market (well, I would say next 5 years) and economic expansion. So, if there is a dip on the road to that economic expansion, buy that dip. And be prepared that the dip may be up to 5% deep, and it will be a very common thing.

 
S&P 500 expectation diary entry
 

I had some other members who follow my market reviews (for which I take no responsibility and no guarantee of it being correct – remember, I totally suck in technical analysis and I do this to learn it. And the best way to learn it is doing it.) asking me if I expect this selloff to continue. My response was that no, I didn’t expect it to continue. I thought it was just a blip and a small dip.

I also had some other members asking me if I think a second crash is coming. Again. my response is – no, I do not expect it. I do not see any fundamentals for it to happen:
 

  1. There are still tons of cash aside sitting in savings accounts making close to none interest. These monies need to start shifting from the savings accounts to the market. It has not yet started happening.
  2.  

  3. People are still too pessimistic and out of the market. If you look at AAII (American Association of Individual Investors) sentiment poll, over 40% of investors are bearish. This is unprecedentedly high number last seen in 2008 and we have not had any similar crisis like in 2008. Today’s crisis is artificial and will not last forever. It is not a systemic crisis that would turn this bull into a long term bear.
  4.  

  5. The market is pricing a LESS BAD economic outcome. No one, even the worst pessimist can expect the economy to be down forever. The average recovery takes 1 to 3 years. But this time is valid in case there was systemic damage. The COVID is not systemic. This was an artificial stop and it will pass. Businesses are opening more and more, and the economy will recover no matter what you think about the valuations and economic activities in the US.
  6.  

  7. Don’t forget the FED. I believe, FED is the main reason why all the good ole valuation metrics no longer work. If you look at the market PE (or Schiller PE) and decide to invest when the stocks become cheap based on these metrics, then I have bad news for you – you will never invest, thanks to FED’s involvement and artificial inflation. Do you think the market will ever correct from this inflation? Well, yes, maybe, one day it may. But we recently just went through a 40% decline. A 40% decline is a serious correction. If you think otherwise, you need to study the previous market history. A 40% decline doesn’t happen very often. And, you know… FED, when such a decline happens, FED is always here for you to bail you out (well, if you are invested instead of sitting aside and waiting for valuations). Another thing about valuations is that the last one favorable one happened 20 years ago. Since then, the market always traded at a premium. And, even Ben Graham admitted that PE has an expanding feature built-in, so during his times, the average market PE was 20, but he recommended using 25 because of the PE expansion. Today, the average PE is 28, but we constantly trade around 20 – 31. Last time, when the market dropped below 28 was… you guessed it – in 2008. And, do you have time to wait for another 10 to 15 years for the PE to drop below 28? I don’t!


And today, the market rallied hard and not only erased all the losses from yesterday but also added more gains. We are almost where we were before the COVID crisis. The previous ATH was at 3394, today, we have reached 3388.62 and returned back into the channel. Until this trend breaks, do not expect any change in direction. All previous breaks down were in fact just dips. We had no confirmation from those dips and the market was immediately bought back and went up again. Thus my expectation is – up again.

 
SPX correction
 

This is also confirmed by big market participants who are positioning themselves for a big economic expansion (moving money back to traditional industrial sectors). So, big players do not expect a crash so why should you?

 
SPX


Join us at MeWe to see trades we take.


We all want to hear your opinion on the article above:
No Comments


Posted by Martin August 03, 2020
2 Comments


Markets keep going higher, again


Account Net-Liq: $6,801.82
SPX value: 3,294.61
Shiller PE: 30.70


The problem of all bears out there predicting the second crash is that it is their wishful thinking and prayers. They again look at metrics such as PE, or other valuations and completely ignore FED and that those metrics do not work when FED is involved.

S&P500 continued higher today despite anything you may think and wish for. An interesting thing is that it broke the uptrend support line a few days ago (in fact two support lines) making it all look like a failed breakout on a daily chart:

 
SPX 2020 0803
 

Yet, the market started hugging the belly of the trend and keeps moving higher. But, if we look at longer-term daily and weekly charts we see a different picture all of a sudden. We are near the gap which happened in March 2020. I believe, this gap will have to be closed before we see any further action.

We are also near the resistance and pain area where many weak hands may want to unload their positions unless they did it all in March when they panicked and sold everything. If this is the case, we may see a new ATH in making here. We had 2 months of consolidation of the previous gains – that is good for the market no matter what you think of it. We recovered the majority of the losses and now we consolidated those gains! And recently, we broke up from the consolidation pattern. We re-tested that breakout – also a good thing for this market. And recently, we continued higher:

 
SPX 2020 0803
 

Of course, in this “pain” area, we may see a lot of choppiness and war between bears and bulls but it seems, bears have a weak hand here.

 
Hedgeye
 

The weekly chart is even more descriptive in where we are heading next. And, in my opinion, it is not down.

 
SPX 2020 0803
 

You can choose and decide to fight this market and short it but it would be a painful fight. Short term, yes, we may see some pullbacks but medium to long term, we are going to ATH.

Join us at MeWe to see trades we take.


We all want to hear your opinion on the article above:
2 Comments


Posted by Martin July 26, 2020
No Comments


Was this a blip?


Account Net-Liq: $5,534.40
SPX value: 3,215.63
Shiller PE: 29.97

Was the drop we saw last week a blip caused by the coronavirus and employment data no one cares about anyway anymore?
It looks like it. As Jani said in his post, this may be just a wobble, bulls no longer care about anymore and we need more to shake this market. True, all we saw was old news. Everybody knows what was going on and that the virus is here, it ain’t going anywhere, we have rising cases but all that will come to an end at some point in the future. Nothing surprising. No new black swan anymore.

Thu futures are up as of now (11:00 pm MT) 0.48%. Will it last until the opening bell? And more importantly, during the entire trading session? I wish we stayed where we are and went slightly higher during this week but not too much. I have an SPX trade which is set to expire this week (well, if we stay in this range and above 3210 by Friday). I have to wait to find out.

SPX 2020 0726


We all want to hear your opinion on the article above:
No Comments


Posted by Martin July 26, 2020
1 Comment


Problems with valuations


Account Net-Liq: $5,534.40
SPX value: 3,215.63
Shiller PE: 29.97

People keep screaming: “The market is overvalued!” Maybe. Investors use all sorts of metrics and formulas to calculate the valuation of the market. They use PE, Shiller PE, Buffett Indicator (typically a Wilshire 5000 Total market cap / GDP ratio) and according to all these metrics, the market is overvalued.

For example, whenever the “Buffett indicator” goes above 113% the market is considered overvalued, and with the current reading at 153% it is considered significantly overvalued:

Valuations 2020

With today’s ratio at 152.3% the market is significantly overvalued.

But, there are a few problems with all these metrics. First of all, they have no predictive value, so saying “the market is overvalued so I will wait for better valuation”, can cost you a lot of precious time and money. The market can stay overvalued for years or get even worse before it corrects itself.

Second, these metrics became obsolete the very first moment the FED started messing things up and got itself involved with fixing the economy and the stock market. The day, FED started pouring trillions of dollars into the economy and the market, the indexes got completely detached from reality.

When you look at the recent correction when the markets shed 40% of its value, it became just an insignificant blip on the market valuations. Compare the correction in 2000 – 2003 and 2008 – 2009 with 2020 on the chart below. You won’t even notice it!!

Valuations 2020

In fact, there is no blip!

That’s how ballooned the market is. Trillions of dollars in QE, FED’s bond-buying (and now even junk bonds purchasing), all that contributed to the market being where it is today.

So, what should you do?

In my opinion, definitely not waiting! People are selling their stocks, waiting aside, and speaking about the overvalued market. Many are just simply waiting for a better valuation. But, here is a problem.

When was the last time, this market was overvalued this high? It was in 2000, it was 20 years ago. It took almost 9 years for the market to get strongly undervalued. Back then, the market lost 70% of its value and you can clearly distinguish that value drop on the valuation chart. In March 2020 the market dropped 40% and it was a small blip that quickly recovered. And even that, people refused to buy in the market because the valuation was too high. With all that said, waiting may cost you 10 years or even 20 years of time waiting. And time, my friends, time, is what we do not have. Once we lose that time, we can never go back and fix our errors.

Valuations 2020

What you gonna do? Waiting can be extremely costly, investing now may be expensive.

The only way out of this situation I see feasible is to keep investing. Keep buying high-quality dividend growth stocks, or if you do not feel comfortable with individual stocks, keep accumulating ETFs. Buy index and sector funds, such as SPY, XLE, XLY, XLU, etc. There is a great website Deep value ETF accumulator which posts a set of ETFs and their valuations. You can keep buying those which are considered undervalued, or even in “crash” mode and keep investing and rotate to those undervalued ETFs. They post the charts every week, just follow those charts and keep buying.

Or, if you like individual stocks, as I do, pick the dividend aristocrats and start investing in them. Here is a set of stocks I like to accumulate:

Dividend aristocrats accumulation

But, hey, we just said, that the stock market is overvalued, in fact, extremely overvalued! And now, we should be buying these stocks?

Yes, we should be buying these stocks, but also monetize them. Keep buying these stocks until you reach 100 shares (in case you do not have enough money to buy 100 shares outright) and once you reach 100 shares, start selling covered calls. Lower your cost basis. Keep doing it every month. Keep a record of your initial cost basis and premiums you receive from the covered calls. If you buy a stock at $34 a share and you sell a covered call for 0.34 premium, your cost basis would go down to 33.66 a share. Repeat this every month. Collect dividends and premiums and keep track of your cost basis. One day, your cost basis will reach zero. And once your stock reaches zero, you own the stock for free. And in this case, who cares about market valuations? Nobody! I don’t! And if you happen to get assigned and your stock is called away, then start selling cash-secured puts and collect premiums. And keep track of those premiums because once you get assigned and you buy back 100 shares of your stock, the premiums you collected in the meantime can be counted against your cost basis again.

That is the only way, I see, as a feasible method of going around the high market valuations. The FED will stay and it will be involved in propping the markets and economy more and more. The old metrics will no longer work, new will develop. And you have to adapt to the new reality too. And yes, keep buying not only today when the market is high, but also when the market crashes (many missed that boat and now pray for another crash which may not come in the next 10+ years).


We all want to hear your opinion on the article above:
1 Comment


Posted by Martin July 25, 2020
No Comments


Dividend stocks accumulation list July 2020


Account Net-Liq: $5,534.40
SPX value: 3,215.63
Shiller PE: 29.97

I updated my list of dividend stocks I plan accumulating this year (or in fact any year, as long as I accumulate them). My goal is to reach 100 shares of these stocks. Once I accumulate these shares, I will start selling covered calls to boost income from these stocks.

SPX 2020


We all want to hear your opinion on the article above:
No Comments


Posted by Martin July 24, 2020
No Comments


Markets losing it again, good or bad?


Account Net-Liq: $5,339.34
SPX value: 3,215.63
Shiller PE: 29.97

Markets continued down again today, as of this entry, S&P was down 0.84%. Normally, I would be OK with it if I didn’t have the SPX trade trying to get rid of it. I had to roll the puts down this time. But I decided to keep the calls up. I will eventually roll the calls down later. I still have 7 days to expiration and I am afraid that I would roll the calls down and the market reverses and rallies hard back up and I will be in trouble with the calls again. So I deiced to wait for now and keep rolling the puts lower only. I hope, this will work for me.

IWM trade is in good shape, the covered call will expire today and on Monday I will be able to sell a new CC.

The market closed down for the second consecutive day. It still may mean nothing though but it may turn into an ugly selloff next week if bulls give up. I hope, they won’t. The last few hours of trading was somewhat promising that there were buyers to be found out there. Nothing spectacular, but promising.

SPX 2020

SPX 2020


We all want to hear your opinion on the article above:
No Comments


Posted by Martin July 23, 2020
No Comments


What I was worried about happened


Account Net-Liq: $5,287.47
SPX value: 3,235.66
Shiller PE: 30.16

In the morning that market rallied. So I rolled my SPX trade higher again. And of course, but the end of the day the market tanked down by -40.36 (-1.23%). And, of course, because I was rolling my puts higher too, to recoup some cash, now these puts are in danger. Not completely yet, but if this starts slipping into something more serious, the trade will be busted again. What a joke. I hope I will be able to finish these trades soon and be done with it Then I will only trade my strategy of accumulating assets and selling options around those assets. No speculative trading whatsoever!

Futures are down 0.27% as of this entry. The question is, will it reverse tomorrow or not?

SPX 2020


We all want to hear your opinion on the article above:
No Comments


This site has been fine-tuned by 14 WordPress Tweaks