|
We all want to hear your opinion on the article above: No Comments |

The market saw a nice recovery during last week. Many are still predicting and forecasting that this market will crash again. They are all idiots. Do not put your money on their bets. Study the market’s history and you will see that in the last 16 occurrences of 10% corrections since 1950 the market dipped back down only in one case. In 15 remaining cases the market reversed and never retested the lows of previous correction.
Of course, anything can happen and that because in the last 15 occurrences the market never retested the lows is not a guarantee that it will do the same this time. but odds are high that this seasonality will repeat and this market will continue higher as it did in the past.
As I said before the selloff however, provided a great opportunity to buy new shares of cheap stocks and run this rally up. This week we didn’t buy any new shares (but we will be buying next week).
In the last week we recovered majority of the paper losses from the previous correction and as the rolled trades keep becoming worthless our accounts are marching up in value again.
We also made nice additional income this week of $1,600 dollars in our IRA account. The trading account and other retirement accounts didn’t produce much income this week since we have small money in those accounts and we are currently fully invested. With small accounts, trading is a bit slower than with large accounts. But I have patience.
|
We all want to hear your opinion on the article above: No Comments |
 If you study the markets and browse a bit into history and seasonality of the markets you can get some nice numbers about the market behavior.
That can provide with some foresight and clues of what the market may do next.
However, let me stress out again that in the markets “EVERYTHING CAN HAPPEN” no matter what YOUR expectation, analysis, or seasonality says! You must never rely on it and then be disappointed when your expectation doesn’t materialize!
So, if I say today that I expect the market to create new all time highs in the next two months it still is not a prediction and I am aware that it may not happen at all.
If you place your trade with a set up based on this “prediction” or you are in a bad trade and hope that this “prediction” will finally help you out you are wrong and you shouldn’t be trading.
Looking for confirmations of a trader’s bias is one of the biggest psychological mistakes a trader can make when trading. If you are in a bad trade and the only way how to get out is when the market makes a new all time high then you would probably love this post as it will give you hope. But it will also give you a false hope, false self relief, and false peace of mind.
And you will also hate this post and the entire blog the moment this “prediction” doesn’t come true.
Do not set your minds set on a false expectations. Use those “predictions” and expectations as guidance and not confirmation of “what you want to hear”. Just go to Stocktwits web site and you will find majority of traders hopelessly searching for posts which confirm their outlook on a stock position and they are so blindfolded that they ignore signals from Mr. Market.

As I mentioned it above, I expect S&P500 to make new all time highs in the next 2 months. Why?
Let’s look at the history a bit. Lately, the market went through a small correction of 11%. The question is what happens next and history can provide a window to see. We want to look for how long it took the market to recover from 10% corrections in the past. Here are some numbers:
| 10% correction | Days to recover |
| June 12, 1950 | 48 |
| June 12, 1950 | 48 |
| January 5, 1953 | 121 |
| September 23, 1955 | 23 |
| August 3, 1959 | 64 |
| May 13, 1965 | 60 |
| September 25, 1967 | 51 |
| October 10, 1983 | 124 |
| August 27, 1986 | 46 |
| January 3, 1990 | 82 |
| May 23, 1996 | 42 |
| February 19, 1997 | 33 |
| October 7, 1997 | 26 |
| July 19, 1999 | 21 |
| January 3, 2000 | 16 |
| July 16, 2007 | 35 |
| April 12, 2012 | 55 |
There are a few patterns visible:
1) Corrections are faster and steeper then before.
2) Recoveries take shorter time than before.
3) Average recovery time is 1 to 3 months.
With the average recovery 1 – 3 months and shorter times than in history it seems that a claim of a full recovery and new ATH in 2 months is a doable event.
But again, remember, everything can happen, even a situation that the recovery will take longer or not at all.
|
We all want to hear your opinion on the article above: No Comments |

The last week was brutal to say it nicely. The market lost over 5% in that week and our portfolios followed.
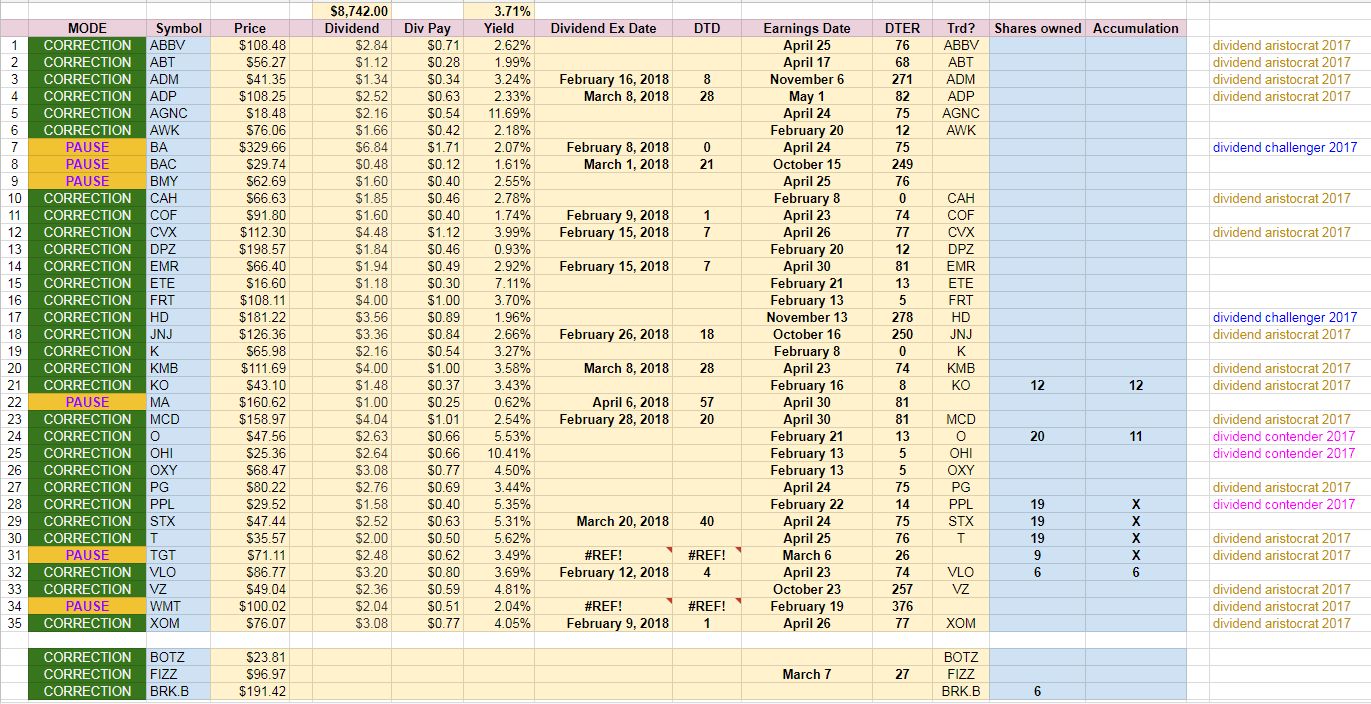
The selloff however, provided a great opportunity to buy new shares of now once again cheap stocks. Last week we purchased the following shares:
Realty Income (NYSE: O) 11 shares at $47.84 a share
Coca Cola (NYSE: KO) 12 shares at $43.31 a share
Valero Energy Corporation (NYSE: VLO) 6 shares at $87.5 a share
Berkshire Hathaway (NYSE: BRK-B) 3 shares at $194.66 a share
I always wanted to buy Coca Cola and this was a great opportunity in my opinion. And if the stock drops more in coming weeks I will buy more shares.
This is an excellent opportunity! Look at our current watch list! Almost all stocks are in a correction mode and it is now difficult which stock to buy first!
As you can see above our accounts got a large hit by the selloff last week. However, we had a nice income also. The losses are all related to increased volatility of our options positions and not by closing the positions at a loss.
TD account – we continued liquidating bad trades, thus our income was down and our net-liq dropped slightly. The larger drop was also caused by increased volatility and if the market stabilizes this drop should remain temporary
IRA account – we made nice income this week and for the month. However, the account is also down due to many trades being rolled down and away in time and increased volatility. If we see the market doing well again and volatility drops, the value should return back up to the original value.
ROTH IRA account – Very little change in income this week. Also, the account is down due to many trades being rolled down and away in time and increased volatility but not as much as other accounts due to less trading activity . If we see the market doing well again and volatility drops, the value should return back up to the original value.
TW60 account – Unfortunately, I was forced (maybe prematurely) to roll the position in this account for debit which cause a loss of income. Still positive for the year though. Also the net-liq loss is caused by a volatility rather than closing positions at a loss.
As Warren Buffett says” “the market selloff is good news”
As of now I am not opening any new trading positions in any of the accounts, I will keep buying stocks however and managing the existing open trading positions (rolling or adjusting). Once the market gives a clear signal whether we want to go higher again or down, I will start opening new trades.
This bull market is not dead by any means. I believe, we will see new all time highs again soon. The 200 DMA was touched, held as a support and stocks sparked up by the touch. The rally from 200 DMA on Friday was really crazy.
Historically, when the market rallied and made 4% gains in the past 2 months, made 1 new all time high in those two months, it then corrected and wiped out all those gains in 7 days. And that is exactly what happened this time too. History repeats itself.
We saw this in:
December 1950
October 1955
October 1979
September 1986
February 1993
January 2010
and the last week!
In fact, this is a very bullish setup for the markets!
We still see a large momentum in this bull market and economy (great earnings, increasing sales, consumer confidence, raising salary, etc.) and bulls do not die at rising momentum! Bulls die when the economy loses steam, inflation gets high, interest rates are high, etc. We see none of it. Interest rates are still way below normal, rising salary is also way below the average, inflation is also historically low and not increasing although many are scared of it.
Look at it this way, we had a decade of sluggish recovery, cheap money, low inflation, all stunningly below normal. Many were afraid of it and were predicting another disaster and economic collapse. And now, when the economy is finally improving and the rates, inflation, GPD, and salary is returning back to normal those same people are scared again! Scared of economy doing well! Scared that if we make too much money, too good earnings, too good sales, then we will collapse again!
What a bullshit!
Do not listen to those people. Keep following your plan, invest and stay in your comfort zone. All will be good in 1 to 2 weeks!
|
We all want to hear your opinion on the article above: No Comments |

When you are getting ready to buy a home, you need to start looking at mortgages. Almost everyone needs a mortgage, and unless you have a lot of experience, it can be difficult to understand everything about your mortgage. There are a lot of myths out there, so here are a few you should ignore.
One of the most common falsehoods about getting a home loan is that you need a perfect or near-perfect credit score. Mortgage lenders take into account more than just credit. You may have no debt or high income that could make up for the lower than average credit. There are many loan products available geared specifically for people in credit repair or who are working on boosting their score. However, if you have a low credit score, you are going to have a higher interest rate. Anything below 500 may disqualify you from some types of loans and even being below 580 makes it difficult, so don’t neglect your credit.
Many potential homeowners put off buying a house because they believe they need at least 20% down payment just to get into the home. This is simply not true. The US government has backed a mortgage program through the Federal Housing Administration (FHA) that will allow a down payment of just 3.5%. The FHA encourages homeownership by working with buyers who may have lower credit scores and allowing for smaller down payments.
However, just because you don’t have to put much down on a house, doesn’t mean you should put the least amount possible. The lower your down payment, the higher your monthly payment will be. If you can afford a 20% down payment, the benefits are definitely worth it.
There are different types of mortgages, depending on how much you are borrowing and what kind of mortgages your lender offers. If you already have a mortgage on your home and you aren’t looking to move, you can even refinance your mortgage, to allow for a different interest rate or lower monthly payments. It’s important to look at the different kinds of loans that may be offered and use that research to make a decision about what kind of loan you are applying for, so you end up in the best situation possible.
Being pre-qualified for a mortgage only indicates that the mortgage lender has looked at your income and credit report and can give a reasonable estimate of the amount you would qualify for. Once you have been pre-qualified, you may be pre-approved. Pre-approval means the lender has vetted and verified your income, assets, debt, and financial history. While both of these are good indicators of what your mortgage will end up looking like, nothing is final until you have signed the papers.
If you are uncertain about what you have been offered by your lender, don’t be afraid to talk to your real estate agent or get a second opinion. It’s important that you don’t fall prey the myths surrounding your mortgage.
|
We all want to hear your opinion on the article above: No Comments |
As soon as S&P 500 touched 200 DMA investors jumped in in a fast and swift buying and propelled the market up pairing almost all intraday losses.
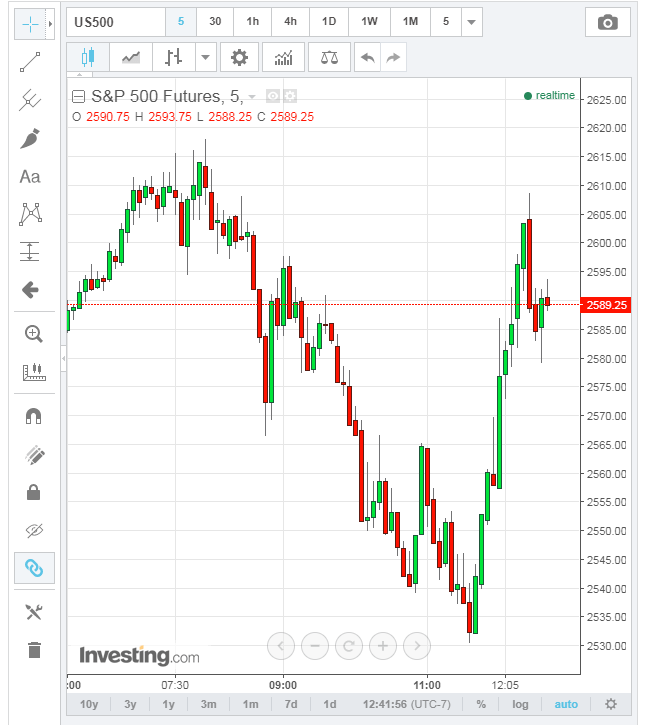
The 200 day MA seems to be holding as a support for now as we bounced. If the support holds we may see more buying coming in and we may be on a path of a recovery. But I still expect a lot of volatility and choppiness before we find a proper direction.
As a trader, I am staying out meaning no new trades but managing the old ones. I am preserving a capital. I might be opening a new trade only if safe.
As a long term investor, I am adding cheap stocks to my portfolio.
Stay the course and stick to your plan. Let other panic.
|
We all want to hear your opinion on the article above: No Comments |
The market opened relatively strong luring investors getting in just to toast them later afternoon. But volatility and weakness returned and the market lost another 37 points adding to yesterday’s 100 point losses.
S&P 500 is now down to 2,546 losing 37 points (-1.43%), DOW is down 23,512.49 losing another 347.97 points (-1.46%), and Nasdaq is down by 127.08(-1.88%). This is a second day of a correction deepening it to -11.13% from all time high.
We are now approaching 200 DMA which may work as a support:

A typical correction is 13% and it will take 4 weeks to recover from the correction (so the seasonal patterns say). Expect more pain in the next few weeks.
|
We all want to hear your opinion on the article above: No Comments |

Getty Images
The stock market is plunging on rising interest rates worries, but perhaps investors shouldn’t be so concerned.
A stronger-than-expected jobs report and wage number on Friday sent interest rates higher, sparking a sharp 6 percent sell-off by the S&P 500 over two trading sessions. The market is dropping again Thursday.
Traders are concerned the Federal Reserve may reduce its monetary stimulus and increase interest rates more aggressively as the economy continues to strengthen.
Major periods of rising interest rates

Source: FactSet
Using Kensho, a hedge fund analytics tool, CNBC looked at what happens during periods of major increases in interest rates using the 10-year Treasury yield over the last 30 years.

The findings show there were six periods with major rises in interest rates in the last three decades. The market rose big during five of those instances and only fell slightly during the one lagging period.

The S&P 500 rallied 23 percent on average in the time periods.
CNBC also looked at the sectors which climbed the most during the rising interest rate time frames.

The screen showed technology stocks did well, followed by consumer and financial stocks.
Investors are freaking out this month, but higher rates have been good for stocks in the past. Or at the very least, stocks were able to rise alongside higher rates.
Likely because accelerating economic growth was pushing earnings higher at the same time.
Past performance does not always equal future returns and of course it could be different this time.
But in the past, higher rates didn’t equal lower stock returns.
S&P after big single-day drops from CNBC.
Disclosure: NBCUniversal, parent of CNBC, is a minority investor in Kensho.
Source: CNBC
|
We all want to hear your opinion on the article above: No Comments |

Recent Comments