Weekly Newsletter   Challenge account   Weekly Newsletter   


Posted by Martin January 15, 2016
2 Comments


Wall Street in panic, S&P 500 plunged 3.16%


FED
(Source: Hedgeye)
 
At one point today, the S&P 500 plunged 3.16% below August 2015 lows. Wall Street is in panic selling and stop losses are now being hit.

FED is still clueless.

But do not worry. My coworkers who normally have no clue about stock market noticed this and started asking if they should sell their 401k holdings to protect themselves from selling.


We all want to hear your opinion on the article above:
2 Comments


Posted by Martin January 13, 2016
2 Comments


Selling continues towards August lows


Chinese banks saving the market

An interesting parallel to save the market.

This market is a rip for dividend investors and a nightmare for traders. All over the internet we see traders expecting bottom and bullish reversal. It is not happening and more selling is coming every day.

Pundits blame oil and China. I blame slowing economy, gloomy economic outlook, worsening earnings, coming deflation and recession around the corner. On top of that I blame FED’s mishandling of the problem since 2009. I have always criticized the policy of “too big to fail”. I disagreed with pouring millions to GM, issuing $600 dollar check to everybody, saving big banks, printing cheap money, etc. If the money was used properly I wouldn’t have problem with such approach. But stuffing money into economy where it was used to artificially boost earnings by buy backs, or invested in the stock market rather than used for economic growth was a bad idea from day one.


I expected a bounce to approx. 1960 level, to 1990 or 2000 at most. It looks like, we had a lot shallower bounce only today, just to 1953.6 and then selling resumed. And it was a free fall.

Expect more selling to come. I hope I am wrong, but now we most likely will go to 1830 level which is an August bottom. If we do not bounce at that level, then more selling will come. I started to believe that this market can really go all the way down to 1550, which is the top of the end of 2007 before the market crashed in 2008.

Do not panic if you are a dividend investor. Invest diligently even if the market crashes. Reinvest dividends and lower your cost base by investing during this selloff time. If you are a trader, short the market every time it rallies hard. I am also selling bounce rallies but they can be dangerous so watch them carefully.

Stay safe and preserve capital.


We all want to hear your opinion on the article above:
2 Comments


Posted by Martin January 10, 2016
2 Comments


What a halted commerce tells us about economy?


Commerce
Transportation sector is usually the first one which signals trouble with the market and economy overall. But transportation sector is a wide branch. So take a look at one significant portion of it – maritime transportation.

Typically, majority of goods are still transported by sea using large cargo ships and tankers. Typically, you can see a frequent transportation between Europe and the North America.

For the first time in known history, not one cargo ship is in-transit in the North Atlantic between Europe and North America. All of them (hundreds) are either anchored offshore or in-port. NOTHING is moving (source: Superstation95)

Yellen and her cohorts were convincing us for the entire 2015 that the US is doing well and that the labor market is improving, and all slowdown is transitory.

Yet there is no commerce between Europe and Americas. Only a few ships are moving overseas and most of them are empty moving to their home ports. All other ships are pinned in their ports or at coast and not moving!

 
Commerce
(All ships are at European or American ports. No cross Atlantic traffic)
 

This is very unusual and it indicates that people are not buying that our supplies are larger than we consume and that the commerce is literally at a halt. When there is no transportation on the high seas then that is an evidence that there are no raw material orders. If there are no orders there are no buyers and sellers will have to cease their operation.

This will like domino move further deeper into the economy and everything will slowly go to a stop.

Below you can see all the ships being at coasts doing nothing or just a local traffic:

 
Commerce
(Local traffic at Spanish coast)
 

Commerce
(Local traffic at English – Netherland – Norway coast)
 

Commerce
(Local traffic at Florida coast)
 

The empty Atlantic is a scary thing basically confirming that the global economy is at halt. And that the US economy will follow soon. So, do not believe our ignorant academics at FED telling you that we are in a great shape. We are not. If we ever have been in a good shape, that shape is going to turn against us soon.

Get ready for coming recession, save money, pay off your debt, invest in a good high quality dividend paying stocks for good income which can weather a recession (such as JNJ, KO, WMT, etc.). Get ready to survive what’s coming at us. If you stocks you have go down (and they will during the recession) be ready for it mentally and do not panic. It is a normal behavior. It always happen. You stay the course and if you can be buying more shares and reinvest dividends.

You can check all those charts above online at the MarineTraffic.com website. No matter how scary it looks it is quite entertaining to play with those maps and see that there is not a single ship traveling over Atlantic.


We all want to hear your opinion on the article above:
2 Comments


Posted by Martin January 10, 2016
No Comments


Is selling over? Should you trade this market?


Futures are down again at the opening. It can mean nothing yet. We can see the market improve significantly overnight and we may see a rally.

Some traders and investors are asking whether it is already time to start buying calls or selling puts. They are expecting the market to reverse. Yes we are oversold, the trend is moving down below the Bollinger Bands which means we are in a buying zone.

 
SPX
 

As you can see on the chart above, the Friday’s trading was already below the lower Bollinger Band (that tiny little line pointing down as of now). That doesn’t mean that we are done with selling. The market can stay there for a prolonged period of time. It can be there longer than we may like, then I might like and longer that we may stay solvent.

 
SPX
 

Even if selling is really at its end and we may finally see a green day as a trader I would stay away. If this is really an end, you need confirmation. We need to see that we are really at the end of selling and that bulls are willing to step in and start buying.

None of that is visible in the market. None of that is happening. We may see more selling and we may see this market to stop at 1880-ish level.

If however we draw a line connecting last August lows, we can see that we really may be seeing the end of this selling. But do not get fooled. We still need to see that bounce and confirmation that we will see a relief rally.

 
SPX
 

If you are a trader, do not jump the gun yet. It may be early and it may be costly.

If you are a long term dividend investor, it is a perfect time to start initiating new positions but do not invest all your money yet. We may see a bounce only with more selling yet to come. If that happens, you can get better prices.

Nevertheless, this is a bear market and there is nothing yet which can change it. Coming earnings season is expected to be in recession, if coming data will be worse than expected, expect more selling. Only if earnings season will come with good numbers this bear market can be stopped.


Online - H&R Block Free Edition


We all want to hear your opinion on the article above:
No Comments


Posted by Martin January 08, 2016
No Comments


Should we really blame China?


ISM
 

A few days ago the market was selling hard and media blamed China and their circuit breaker and worries over Chinese slowing economy.

Then media blamed North Korean hydrogen bomb for a selloff.

A day before yesterday, they blamed China and their circuit breakers again.

Yesterday, China removed the breaker feature and their market rallied. China finished +2.9%. Futures rallied.

This morning the US market crashed because of a good job report.

I think the slump today was due to the US economy getting into trouble and not China, oil, job report, or bad weather.


We all want to hear your opinion on the article above:
No Comments


Posted by Martin January 07, 2016
No Comments


Are you panicking yet?


Did you know that panic selling by retail investors (like you and me) is the worst thing you can ever do?

Studies prove that when a retail investor finally gives up and decides to sell his losing stock positions, it is always already late. (Source: S&P, BofA, Merrill Lynch)

 
Panic selling
 

It is the same as with other strategies. Many times you see investors and traders decide to short the market. Inexperienced traders would again have it wrong. Would you short this market now?

If you answered yes, then you are too late to the party. It is not time to be shorting the market, but sit tight, wait for a reversal and then actually buy it.


But this post is not about trading this market. It is about regular investors. It’s about you and me as a dividend investor. Not a trader.


In my previous post I wrote I was bearish. And I am bearish!


And I love to be bearish! I want this market to fall! I want my stocks to go down! I want other stocks to go down! I want more crashing prices!

Why?

Because I can buy stocks I want for less. I can accumulate stocks I already own for cheap!
 

Remember, as a dividend (income) investor you invest for income not the stock future value (growth)! As an income investor all what matters is the income your investments generate and not it’s value, growth or decline.

But even as a growth investor you are probably panicking and selling but you should not. You have one friend on your side in this market battlefield – time. If you invest into good growth companies, blue chips, you will be able to afford weathering this selling.

It is the same and even better with dividend investing. Time is on your side. You invest for next 20 years or more. And in 20 years, who will remember selling of 2016? Nobody.


We all want to hear your opinion on the article above:
No Comments


Here is why I consider this market bearish


Look at the chart. I use regression channel. It is a study provided for free in TOS. So the lines of the regression channel shown on the chart are drawn automatically by the study based on the price action of the underlying. It is as automatic as Bollinger Bands. It is expected that the price of the underlying stays within the channel. If it moves out of the channel, the longer it stays out of the channel the the most likely the trend reverses.

This happened in August 2015. The channel was trending up, but after the huge drop it started trending down as seen on the chart. So, just to clarify, those line are not drawn by me manually based on my feeling, but strictly by the study based on the price action and time frame (9 months in this case).


The idea of the Linear Regression Channel 50% is close to the Linear Regression Channel but the upper and lower lines are drawn at the distance of one, not of two, standard deviation from the Linear Regression line. By drawing two parallel lines over and under the Linear Regression line, we obtain a Linear Regression Channel 100%.
At the distance of two standard deviations over and under the Linear Regression line Parallel and equidistant lines are traced. The channel lines are located much farther from the Regression line than any of the closing prices. As far as the Regression channel is a channel for price fluctuations, the top borderline shows resistance whether the bottom channel line shows support. Price values can fall out of the channel for a while, but if the price stays out of the channel for a prolonged period of time, the trend may reverse.
Unlike Linear Regression trend line whose purpose is to show the equilibrium price Linear Regression Channels are the indicators of possible price fluctuations from the trend line.


(source: Online Trading Concepts)
 

The trend is clearly down and until the price reaches the upper regression band and stays them longer we are doomed to continue going down.
What is important now is that we moved to the lower band of the regression band and we may expect a bounce back to the mean price (also shown automatically). But, when this reversal happens I do not know as of now. We need to wait for it. There still may be more selling. But once the signal comes and the prices start going up, we will be ready to start selling put spreads.

Some say, we still may re-test August lows. So cautiousness is needed. We may have bottomed already and tomorrow we may see the reversal. Or next week. But even if we see a reversal, it still will be a bounce to the mean or even the upper regression band, but still staying inside the down-trending channel. That’s why I am bearish until the channel changes up again. Before that happens we will play the game of this channel.


We all want to hear your opinion on the article above:
No Comments


My Options trading 2015 year end report and goals for 2016


UPDATE 03/01/2016

 
A few months into the new year I realized that my trading strategy and goals for 2016 had to be changed. My SPX trading didn’t work and didn’t make money. In January I lost substantial money and in February I was going for a large loss too.

I was very close to wiping out my account. I realized that I had to stop trading SPX spreads and return back to my original options trading strategy which worked well before I switched to SPX – selling puts against dividend paying stocks (meaning using dividend stocks as underlying and not the index; I do not own the stocks against which I will be selling the puts).

Below is my updated 2015 review and new goals for 2016 reflecting my trading strategy [with comments added].


In my last post I reviewed my dividend investing of 2015 and set goals for 2016. Today, I would like to provide a similar report on my options trading.

I decided to learn trading options four years ago to create additional income which I could use to buy dividend stocks in my ROTH IRA account (increase savings and contributions) and possibly use that additional income to help our family budget, pay off the debt, travel, etc.

It was a bumpy road, but I thought I learned a lot during that period of time when I started trading in 2011. I learned a lot, but realized I still have to learn a lot. As soon as I thought I knew how to trade successfully and make a consistent income, Mr. Market showed me that I didn’t learn everything I needed to be successful.

If you follow my blog and my monthly investing and trading reports, you can see my trading journey and hopefully learn from it yourself.

I started trading in mid of 2011 with $2,000 account and before the end of the year I worked my small account up to almost $8,000. I was proud of my achievement and I felt as a great trader ever. I quadrupled my account in a few months! What a great trader I was! And what power options trading had to boost my portfolio almost thru the roof.

Having no plan and basically not knowing what I was doing I continued trading. And I traded my account back down to $2,000. At some point my portfolio value dropped below $2,000 and I even lost my margin from the broker. By mid of 2012 I was broke again. For the next 6 months I stopped trading and investing, thinking what to do next.

In many books and on the interned I read that a trader should learn from his mistakes and stop doing them again. I was clueless. I didn’t even know what my mistakes were. I was not able to identify them not even learn from them and find out how to avoid them.

Before the end of 2012 I started saving some cash and started trading naked puts [against underlying stocks] as these seemed worked well for me. And yes, they worked great. Soon I added naked calls to my arsenal of trading tools. [That showed to be a great mistake!] I was trading short strangles selling OTM (out-of-the-money) naked puts and naked calls against low priced stocks such as Taser (TASR) – (my favorite one).

Soon my account skyrocketed to $28,000 equity value and $21,000 net-liq (net liquidation) value. Can you believe it? I worked my account from $2,000 to $21,000 net-liq and $28,000 cash value!

Then the best trade of my live came. I could take a trade where I could make $14,000 in a single trade!

You can guess what the result was, right?

I lost $14,000 in a few attempts of trying to save the “greatest trade of my life ever”. I lost money and every trade I took to reverse the losing streak ended as a disaster. This journey is best visible on the following chart:

 
My trading vs. account
 

Dreadful, right? [Well, it was dreadful and no wonder when I deviated grossly from a trading strategy which worked well before and became greedy!)]


 · My 2015 goals review


Because I was still clueless, I wasn’t able to set a meaningful goal for 2015. All I was able to write down was:

My goal for 2015 would therefore be to focus on money management and wealth creation and preservation.
I advise my readers to trade only 30% of available cash and keep the rest in reserves for trade repairs. I was constantly breaking this rule. This year my goal will be to strictly follow this rule.

Well, yea. Great goal! And what about strategy? What is that money management I was talking about and wanted to follow? Trade only 30% of available cash? Not only was I breaking that rule heavily I had no clue how to apply that rule at all! I had no clue and no plan on how to trade, limit losses, and be always on the right side of the market.

The result?

At first the account held the level, but then a free fall started and I was losing money even more and faster than in 2014. And I still wasn’t able to do anything about it!

At some point it looked like that no matter what trade I took, I was always on the wrong side of the market.

Any time I opened a bullish trade, the market fell. When I opened a bearish trade, the market went up. I was like a small ship in the middle of the ocean being tossed around by a storm and having no sails and steering wheel available to navigate the ship. The market literally did whatever it wanted with me. At some point I was so depressed that I wanted to stop trading at all. I was hopeless, clueless, and mentally down. I started to believe that trading options is a sucker’s game and all those winning traders out there are liars. You cannot win!

But, no matter how depressive and bad my trading was, it had some benefits to me. Here is what it helped me to do:

 
1) I was able to define my trading strategy [That was a lie I was telling to myself.]

This was a good step towards successful trading. [No, it wasn’t.] I finally defined my trading strategy. I now know what I want to trade, when to trade, and how to trade it. That’s a good start. I now understand my trades and what to expect from them and be finally on the right side of the market. [Yes, once I realized that my strategy was totally wrong I updated it along with this update.]

At the beginning, I was trading options against regular stocks and dividend stocks as well as $SPX (S&P 500 index). But I had to deal with earnings, turbulences in stock volatility, and mostly assignments. [Later I learned that this was just an excuse and a lie to myself for actually being greedy and deviating from my original plan.] In a few occasions I lost money because one leg of my spread got assigned (usually the leg which was against me) so I couldn’t give the stock enough time to grow back above the endangered strike, for example the recent stock I got assigned was a spread against AGU. The result was $1,500 dollars loss due to forced liquidation of unwanted position (I also received a margin call for that trade). [But this was my original plan from day one! This was the strategy which turned my account from $2,000 into $21,000! I wanted to get assigned! But as soon as I overtraded my account and tried to do whatever it took to avoid the assignment, the troubles occurred and I started losing again.]

I stopped trading spreads against stocks or any American style options. From that time on I only trade spreads against $SPX which cannot be assigned early (European style option). It also has a tax benefit as trading options against SPX is treated under IRS 1256 Contract with a 60/40 rule which is better for short term trades, where 40% of all trades are treated as short term capital gain and 60% as long term capital gain. You won’t get this advantage with stock options or non-index options. If you hold any other option contract less than 35 days it is automatically treated as short term capital gain and you pay heavy taxes on your gains. With SPX trades you do that only on 40% of all your trades and the wash rule doesn’t apply with SPX either. [This actually showed up as the biggest mistake I made. It was a wrong strategy and it didn’t work no matter how much I tried to excuse it, defend it, modify it, or re-learn it.]

 
2) I was able to learn from my mistakes [Another lie!]

Although I defined a strategy, I still continued losing money. I was still desperate and depressed. I couldn’t understand it. I had a great strategy, I was able to open a trade so far away from the market that I would never be affected by the market’s fluctuations and never be on the wrong side. I felt invincible.

Yet, there was a catch. I thought that if the market falls hard, there would be a fast recovery too, because to fall this hard and deep it would be a flash crash or similar thing and from such oversold market it must recover quickly.

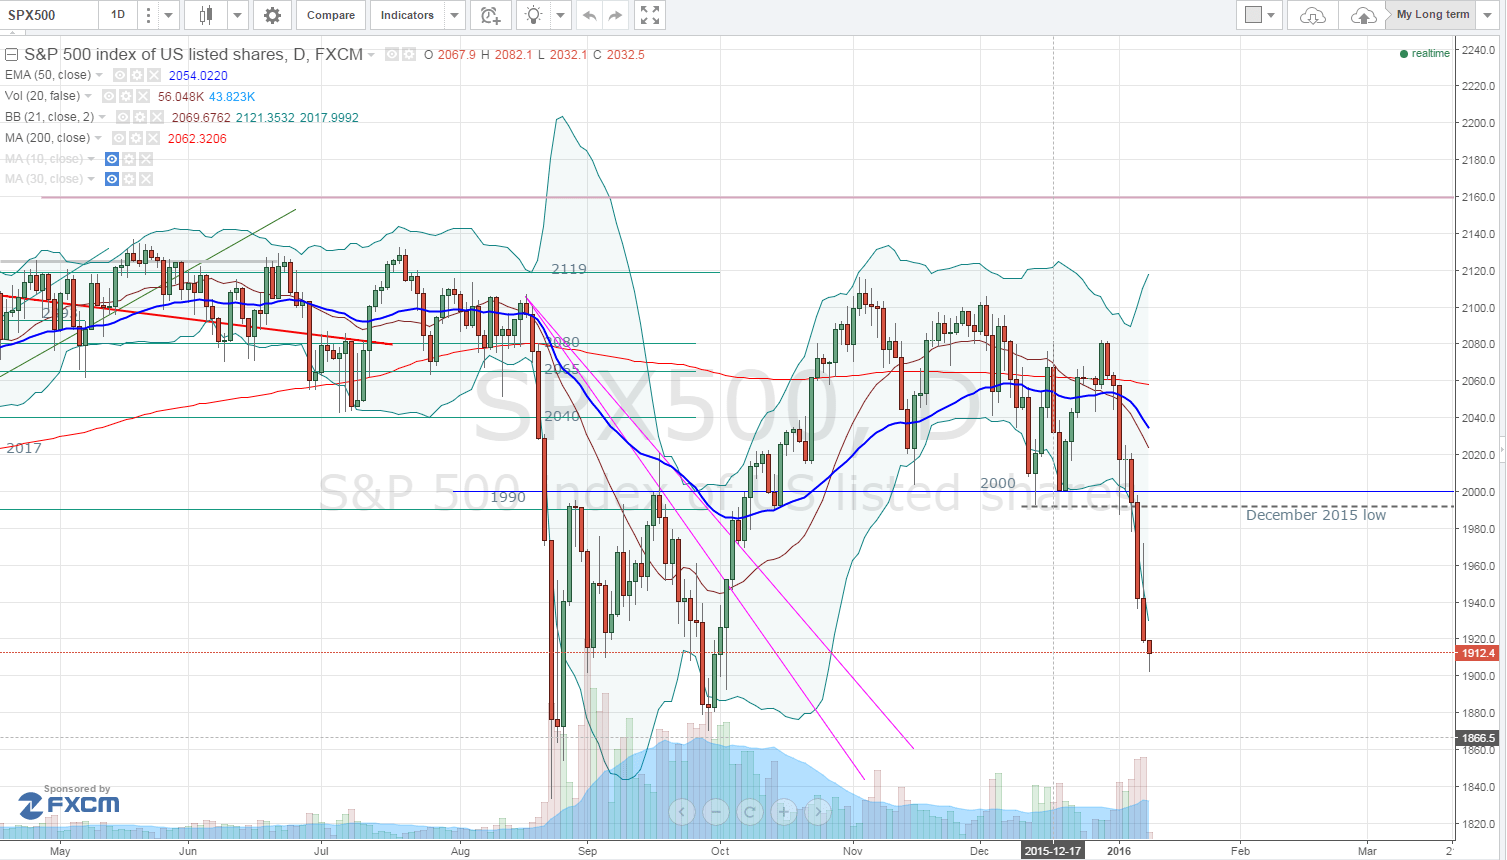
It doesn’t have to. It can be down long enough to break your neck. And I learned this lesson in August 2015 when the market fell hard and I ended up with 5 losing trades which were more than I could afford to lose. By creating a weekly ladder I exposed myself to bigger loss than I could handle. Panicking at the scale of potential losses I tried to save the trades, roll them, reverse them.

It worked with only 1 trade out of the 5 endangered ones. See the chart below:

 
My trading vs. account
 

This was a lesson I was finally able to learn from.

[Everything you just read in the paragraphs above is a bullshit. Lie, lie, lie, and a lie. I was deceiving myself to make myself look like a great trader.]

 
3) Still refusing to take a small loss [This didn’t work either!]

In trading there goes a saying: “if you are not willing to take a small loss now, you will be forced to take a mother of all losses later.” I still believed that if a trade goes against me I can manage the trade by rolling it away in time, or roll it away in time and higher, or even convert a bullish trade into a bearish trade.

This strategy worked with some trades, but not with all of them. At some point I had trades where I could take a small loss of $50 or $100 dollars, instead, I decided to wait hoping that the market will go higher and expire worthless and I make thousands of dollars I collected in premiums.

Yes, I collected a lot of credit, but I also increased risk. An original trade was risking $900 dollars, the final version of that trade after all the conversions, rolls, and adjustments, risked $4,000 dollars. What a foolish idiot I was!

As you can see, this cost me a lot when I reached a point when I was no longer able to convert a heavily losing trade. Of course, it could cost me more, as you can see in the table above, I risked $4,465 for a trade which ended up with $2,965 loss at the end. So better than $4,465 loss. But at one point all I saw was the credit of $1,500 dollars I collected and hoped to keep it. I had to give up more than that.

I realized that salvaging a trade is a dead end and decided to stop doing it anymore.

[This is good one (BS). Yes, I stopped taking a big loss, but I continued taking many small losses wiping my account further down. Don’t believe anything I just said in the paragraph above. It was that I again thought I was a great trader and finally got the edge. All I got was depression.]

I spoke with some other traders over Twitter, Facebook, or Stocktwits and one trader told me that he never rolls spreads. He either lets it die or close it early for a small loss. But fixing a trade is a nonsense.

 
4) My capital gains/losses in 2015

From my trading operations only (overhead and other gains or expenses excluded) I lost -$7,895.08 (adjusted for 2015 year only). That represents 67% of my portfolio value. However, due to some trades carried over from 2014, my total net-liq loss represented -$9,166.86 or 78.31% portfolio value loss.

Here is a table of my monthly records. Some trades prior to adjustment may not be recorded also some carry-over trades may be missing as I started creating this chart later and some trades I back-added. My 2016 year should be already accurate as I developed a method of effectively recording those trades without mistakenly omitting some or misreporting others.

 
My trading vs. account
(Click here to enlarge)
 

Note the discrepancy between total loss in the table and reported loss from my account gain-keeper software. It could be because of back dating some records into the table and I might have missed some trades.


 · My 2016 goals


Here is my new [(old)] trading strategy for trading during 2016.

Based on this new strategy, I am also updating my goals (see below).

 
1) I stopped trading the “ladder”.

I no longer trade a ladder. It cumulates trades and if the market gets into longer term trouble I end up with several trades in potential danger and bigger losses than if I only trade one trade at a time.

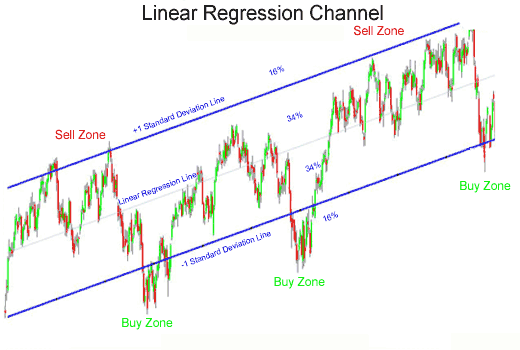
I will only trade one trade at a time based on Bollinger bands (BB) and 50% regression channel. If the prices of the market go down to the lower BB band or regression channel I will start adding put spreads upon trend reversal. If the market goes to the upper BB band or regression channel, I will start adding call spreads upon trend reversal.

 
2) I will trade 45 > DTE spreads as well as < 4 DTE spreads

I will be trading one contract at a time using longer term options with 45 > DTE (day to expiration) as well as one trade with < 4 DTE. With the loss limiting protection set forth below I feel comfortable to take such short trade.

 
3) Portfolio risk limit in 2016

I will trade spreads and open as many contracts as possible to only risk 10% of the entire portfolio at a time. Because I lost substantial money last year and current portfolio value wouldn’t allow me to trade basically anything, I will trade:

1) One trade/contract with 45 > DTE with max risk $1,000 in 2016 and
2) Two trades/contracts with < 4 DTE with max risk another $1,000 in 2016.

I will be trading this structure as long as the portfolio value grows enough to allow me to increase the number of contracts (which I do not expect this year at all). However, this can be by-passed when trading Iron Condors for example. I will maximize the margin available with Condors. If for example the market falls from highs and I open a bear call spread and the market falls down to a support and then reverses back up, I can add a bull put spread creating an Iron Condor which will not increase the risk of the portfolio and margin. With Condor, you can never lose on both side only one side.

 
4) Defending my trades 2016

Although, the maximum trade risk set up above is $1,000 per trade I will never let that risk to be converted in a full loss anymore. I will not roll any trade and I will use delta of the short strike to liquidate the trade if it goes against me early.

This was my biggest hard thing to do. I always feared that once I close the trade the market reverses and will go up (or down if call spread is the touched side) and I will take unnecessary loss. Well, look at it this way, we can always go back into that trade should that happen, right?

The maximum loss occurs only if the price of underlying stock, in this case SPX index goes thru both of the strikes at expiration. Even if this happens a few days before expiration, you will not see a full loss. For example I had a trade with total risk $1,500 per trade which went completely bust. Even 7 days prior to expiration it was trading for $1,470. So the full loss really happens at expiration. Anything prior to that there will be some value in the option spread (usually a time value).

In 2016 I will use delta 30 as my limit. If the price reaches any short option strike of the spread I will close that trade (at some occasions I may choose to deviate and set a different delta, for example I had a trade where I was so close to the market that using delta 30 would mean closing that trade almost right away after opening it, so I decided to use delta 40. The potential loss at that delta for that trade was only $40 dollars, so such adjustment was justified even by potential loss amount.)

There will be no questions, hesitations, or excuses to this rule. Even if the market reverses and continues back up higher after I was stopped out (or I can think that something like that may happen after I close the trade), I will still close that trade. I can put the trade back up if the market reverses and eliminate or lower the loss by a new trade. Should the market continue lower, by doing that I saved the trade, and I can always put a new trade back on once the trend reverses. A new trade would also help eliminating or minimizing the loss.

This was my biggest dilemma and I wasn’t able to handle this, ever. I always had a fear of losing the gain potential if I closed a potentially dangerous trade. What if it turns up and goes up without me. This weird fear of lost opportunity forced me to try to save a trade instead of closing it, taking the loss and move on.

The short term trades will be closed upon a touch and not delta value. If the market touches the short strike, I will close 1/2 of the trade and let the other half run until expiration if the price “dances at floor” (meaning stays bouncing at the strike price, or be ATM – at-the-money). Should the price continue rapidly down so it would endanger the protective option strike, the other half will be closed immediately too. If I have only one contract instead of two, then the entire contract will be closed upon a touch.

 
5) My capital gain goal for 2016

I have two expectations and goals for 2016 as far as profit expectations.

For the < 4 DTE trades my goal is to achieve a consistent 6% – 8% gain per week. This is not a gain per portfolio, but per trade! Per portfolio it would be approx. 1.2% gain per week.

If we open a spread with $500 dollar max. risk/spread width and collect $30 dollars premium, our total risk will be $470 dollars and our potential gain 6.38% ( 30/470 = 6.38%) if the trade expires that week.

For the long term trades I will use 50% credit capturing strategy (meaning that once the spread loses value enough to buy it back and keep at least 50% of the collected credit, I will close the trade). With trades, where 50% collected credit would be less than $30, I will place a buy back order so I keep 50% or $30 dollars minimum credit.

With this strategy, the average holding time of the open trade seems to be 23 days (but December 2015 it was only 6 days). From the last year records it appears that I can achieve a gain of 3% per month (or 23 days) average gains. So in 2016 my goal will be to achieve a consistent 3% gain per month on the longer period trades.

[My goal for 2016 is to rebuild my trading account back to the level prior to losses and end up with $21,000 Net-Liq value. I know, it is a very bold plan, but I did it once, I will do it again.]

[My second goal for 2016 is achieve min. $1,000 income monthly from options by the end of the year.]

 
6) Posting my trades in 2016

I will continue posting my trades in my closed Facebook Group for others to see how these trades are doing and how I am following this plan. Eventually, you can learn from those trades too! The group is closed and limited to 50 members only. The new members will be accepted only if any old members leave the group.


I believe, that this is a solid plan with a solid strategy on placing and protecting the trades. Losses or losing trades will happen, but with the strategy laid out above we can minimize them and reverse the money losing streak. What do you think? If you are an experienced trader, let me know your opinion


Online - H&R Block Free Edition


We all want to hear your opinion on the article above:
No Comments


Posted by Martin January 05, 2016
No Comments


Atlanta FED voted for rate hike but lowered GDP forecast again!


Data (in)dependent Janet Yellen and her FED cronies decided to raise rates to show us their good faith in the US economy. By raising the rates FED was “signaling their faith” pointing to “improvement of the labor market” but completely ignoring all economic data indicating that the US economy is in reality slowing down and that we are at the beginning of another recession.

Fed hasn’t increased rates with ISM index below 50 since 1986 when they raised them but were forced to lower them again a few months later when a recession hit the US in 1987 (source: Hedgeye).

 
Confidence
 

Unfortunately, an improvement of the labor market made mostly of part time jobs for economic reasons (where multiple people work full time job and a part time job, because a full time job will not provide them with enough salary to spend) will not provide enough confidence for American consumers to spend their money! And sure enough. The Bloomberg Consumer Comfort index has been declining since September and now reached the worst level since the end of QE3 (source Zerohedge). Americans feel that their economic situation isn’t as easy as it was before 2008. Many feel that they are worse off than before.

 
Confidence
Source: Zerohedge, Bloomberg
 

Atlanta Fed head Dennis Lockhart called U.S. growth “solid” yet they lowered the US GDP forecast for four times since November. Not so long ago, they lowered the GDP forecast from 3.4% to 2.2% in November 2015, then they supported the rate hike to show faith in the US economy while at the same time admitting that it is actually slowing down and now they lowered the GDP forecast to 0.7%!

 
Confidence
 

What is this telling us? It indicates that Yellen has never been data dependent, pushed herself into a corner by talking about rate hikes but not doing it and at the end raising rates just to satisfy Wall Street expectations, and save their already questionable “credibility”. The whole rate hike and optimistic US economy forecasts from FED are as phony as the entire recovery indicating what everybody probably knows anyway that FED has either no clue what’s going on or try deliberately lie themselves out of this mess and hoping that it may end well. It will not.

What’s ahead of us is quite scary.


Online - H&R Block Free Edition


We all want to hear your opinion on the article above:
No Comments


My Dividend investing 2015 year end report and goals for 2016


If you follow my blog you know that I developed from a chaotic, ignorant investor (sucker) into a dividend investor and later progressed into a chaotic, ignorant options sucker (hoping one day progressing into a trader).

 
A few years ago I created a plan to build a dividend portfolio for my retirement and learn options trading to create an income stream to invest into the dividend portfolio.
 

As of today, I am still partially failing with this plan.

I can proudly claim that I am successful in creating and building my dividend portfolio, which is growing satisfactorily but that trading part is still lacking any good results. Actually I must admit, that I suck in trading. But I learned my expensive lesson and hope in 2016 I will be successful again.

This post will review my dividend investing throughout 2015 and sets my goals for 2016. I plan on writing about options trading in 2015 and goals for 2016 in my next post.


 · My accounts review


I do not hold all my money in one account. I have a few more accounts because I believe in diversification not only inside a portfolio but also among brokers. Do you remember a scam of Bernie Madoff? Some people invested with him all their money. Instead of retiring, they have to continue working to be able to retire with at least some pension. They lost everything.

I am not saying that the broker I invest with is a scam or will go belly up, but it may happen. It happened once and it can happen again if a broker house gets itself too close to the margin limits. This happened in 2003 when the dot com bubble blasted and many brokers were left with uncovered margin calls and had to foot the bill. It happened again in a currency market in January 2015 when the Swiss National Bank de-coupled the Swiss Franc from Euro and forex brokers found themselves insolvent.

That’s the reason for me to spread my investments among several accounts (but still keep it on a reasonable and manageable level).

Because of that, I have a trading account with some play money to trade options – I call the account as “TD account”

Then I have money invested in a 401k account where I invest into dividend/distribution paying mutual funds. I do not report this account, as there is nothing to report much. All I did in 2015 was some rebalancing to trim gains from health sector and large caps and moved them into basic materials and energy which were underperforming. I also increased my contribution into 401k by 1% along with my salary raise. So as of now I contribute 7% and my employer adds another 3%. If in 2016 I get a raise (usually in June) then I will be again raising my contributions by 1% too.

I also have money in Scottrade account and motif investing. In both accounts I use strictly dividend growth investing and do not mix trading styles. With Motif investing I liked the idea of fractional purchases of the stocks. First you create a desired portfolio of stocks you want and then you are buying the entire portfolio and money you use are spread and spend into all stocks in the portfolio according to your desired target allocation. I loved this idea because in my regular ROTH IRA account I couldn’t afford to buy some stocks I wanted to own, for example at some point it was a Visa (V) stock. Before split, it traded for $200 or more dollars and I didn’t have enough cash to buy this stock (and I didn’t want to buy one or two shares only). Using Motif Investing was a great idea to buy all stocks at once with little money. With Motif investing I can invest the same way as you invest into mutual funds only this is your own mutual fund you create yourself.

Lastly, I have my ROTH IRA account where I use dividend investing and some options trading. This report and all reports on this blog is about this account.


 · My 2015 goals review


I didn’t set any specific goals for my ROTH IRA account for 2015 as I considered investing in this account as a secondary task and I mostly focused on my trading account and trading results.

It came a lot later to me to work on my ROTH IRA account more than I originally wanted.

During 2015 I made the following steps:

 
1) I activated a DRIP program

I did this because this year I started teaching my kids how to invest money into dividend stocks. I started their own accounts and set up DRIP for them as I wasn’t sure whether they would be able to manage dividend reinvesting the way I was doing it. For their age I considered my method too complicated. DRIP was easy.

Before, I used no-transaction-fee ETF into which I invested all dividends and contributions and once I saved enough, I sold the ETF and bought a stock.

Once I saw how easy and effortless the DRIP was in my kids’ accounts I decided to switch and use DRIP too.

 
2) I decided to start options trading in ROTH too

At some point I polished my options trading strategy so well that I felt invincible and my strategy almost perfect. So I decided to use it in my ROTH IRA account too. Well, Mr. Market showed me that my strategy wan nowhere near to perfection and I lost money.

I stopped trading opt6ions in this account until I learn better. I still have one bad trade in that account which will cost me money and I will be closing it soon (most likely for a large loss). However, I plan on returning options trading in this account as an income generating strategy.

 
3) I renewed my contributions

During 2015 my family budget prevented me from contributing into my account (that was one of the reasons why I hoped for options as an income tool to substitute my contributions – and I still hope for it). At the end of the year I was able to renew small contributions into this account and partially use bonus to contribute.

 
4) My dividend income in 2015

My dividend income was at a satisfactory level considering that many of my stock holdings (mainly in the energy sector) cut the dividends. I noticed a drop in income on a monthly basis, but overall year end result was surprising to me.

In 2014 my dividend income was $1,096.28 and in 2015 I ended up with $1,074.90 dividend income; only $21.38 dollars less. Considering dividend cuts in KMI (true, KMI will show the drop later this year) or LGCY stocks, it is not a bad result at all and it actually came in as a surprise to me.

 
Here is my dividend income on annual basis:

Annual dividend
 

I contribute this result to the DRIP program which helped to offset the losses of income from the dividend cuts.

When reviewing my portfolio, my overall portfolio dividend yield is now 9.43% (thanks to some stocks price drop such as AGNC, LGCY, or KMI). Not bad if those companies continue paying their dividend.

 
5) My capital gains/losses 2015

When I started trading options, overall I realized -$801.89 (-0.99%) loss in 2015
My unrealized gain/loss for 2015 is -$2,648.04 (-7.17%)

Part of that unrealized loss is the option trade I was talking about above which will most likely end up bad in two weeks, unless the market jumps up a bit, which is unlikely, or I do not expect it. The rest is stocks which were beaten down significantly during last two years, such as KMI, LGCY, AGNC, etc. and I still sit on a loss. However, in dividend investing I do not consider capital value of the portfolio and unrealized loss important. I consider dividend income important and I believe, that my portfolio is already stable (I do not expect more dividend cuts) so I should now be well,

Remember, I am investing for the next 20 – 25 years. In this time period I can afford to wait for some stocks to come back up from current losses.

 
6) My stock holdings EOY 2015

Here are my holdings of stocks I have in my portfolio:

Holdings


 · My 2016 goals


1) Contributions

I will continue contributing my small money into ROTH. I can only afford $50 dollars per month and bonuses throughout the year. I will keep all contributions in my account as cash until I save at least $1,000 dollars to buy another set of shares to minimize commissions’ impact.

Typically, I will be able to contribute at least $1,000 semiannually my bonus (part of my bonus) and that money will be used directly to buy new shares or invest into existing holdings (accumulate).

 
2) Dividend investing

I plan on continuing using DRIP program reinvesting all dividends into the companies I hold. I will continue building up the portfolio by adding more shares of the companies I want to have such as AT&T (T), Verizon (V), Chevron (CVX), Abbvie (ABBV), Walmart (WMT), etc. I will focus on high yield (but safe) stocks with high yield growth and long dividend history. The stocks listed here are just an example and not the actual list although these are stocks I want in my portfolio so I will be buying them at some point in 2016 or following years. I will be performing my selection process individually when the time comes.

I will only invest minimum $1,000 dollars or more into each company at one time only to save money on commissions.

 
3) Options trading

I will be trading options in ROTH selling spreads against $SPX (S&P 500 index), but I will only limit the trades to risk $500 at this point and no more. Overall, I will risk no more than 10% of my account, which means that in 2016 I can risk no more than $1,500 dollars. That gives me an opportunity to take up to (3) $500 dollar trades at one time (3 contracts), but I will start with one contract only and grow to those three contracts slowly and gradually.

I will trade short term (less than 4 days to expiration), 5 dollars spreads. I will not compound any gains should they occur (meaning increasing number of contracts traded). I will only increase the number of contracts as long as the value of the entire portfolio increases so my total risk will still be within 10% limit.

The goal will be to reach consistent 5% – 8% gain every week trading SPX spreads. There will be drawdowns in options trading and I am aware of it. In a losing week I may realize up to 50% loss, but that wouldn’t be a loss of the entire portfolio, but of the dedicated trading limit (in this case $1,500 limit for 2016). That can be a wipe out of approx. 7 weeks of trading.

All profits will however be kept in cash reserve and once they reach $1,000 amount I will invest them into a dividend paying stock.

As of now, my goal is to reach 5% – 8% weekly profit and $360 monthly cash income from options in 2016 in my ROTH IRA account.

I will write details on trading this strategy in my next post about options trading review and goals for 2016 where I will be lining up the strategy, opening trades, trade management, and trade protection.
 

Please let me know what is your investing plan and what do you think about mine. What would you add to it if it was your account and your money to invest?


We all want to hear your opinion on the article above:
4 Comments


This site has been fine-tuned by 14 WordPress Tweaks