Trading options in January ended very well. I definitely didn’t expect such results. At first it was slow and much of our cash was tied to other trades and I didn’t expect freeing them for trading. In fact, they are still blocked by those trades.
I expected barely $1,200 income, although I planned for $1,500 for this month. However, when It looked hopeless many great opportunities showed up and we were able to bank $2,468.87 dollars of option income. Very unexpected!
· Options Trading Strategy
Over time, our options trading strategy developed from selling naked puts to SPX Iron Condors (which caused me losing money big), back to selling put contracts against dividend stocks all the way to today’s ATM strangles using weekly options.
Trading strangles is a different strategy than selling naked puts. With strangles a trader needs to trade short term contracts so you give the market little time to go against you. A strangle requires constant adjustments. Because of that, you do not want to be stuck with 30 or 45 days contract watching you trade going deep in the money. When a trade goes against you, you want to adjust by rolling and you do not want to roll another 45 day ahead and be stuck in a 90 days trade, for example.
That’s why I trade short term ATM or near the money strangles and adjust every week. And the more I trade strangles, the more I love them. If you want to learn more about how I trade strangles, read my previous post about it. I still owe you my post about how I adjust my strangles but in a nut shell, look at the strangles this way:
Are you Ready to Trade?
If you like results of our trading open yourself an account with OptionsHouse.com and start trading with a low commission rates + free virtual trading tool!
Your new trading account will come with a paper money account and will be immediately funded with $5,000 of virtual money for you to test the options trading and if you join our trading group on Facebook you can get a guidance, ideas, and trading education. Before you commit your real hard-earned money you can use the virtual account to test our strategies, learn, and ask all questions you need to learn options trading.
Once you learn and get ready, start trading live account and earn monthly income similar to ours. And we will be happy to assist you with that.
Seize the opportunity. Open a new OptionsHouse Account Today! Open and fund an OptionsHouse account to receive up to $1,000 worth of commissions on online trades for 60 days.
Imagine that the put and call contract is a bracket and that you want constantly keep the price of the stock in between the brackets. Any time, the stock moves away from those brackets you want to adjust the trade by moving the brackets “up or down” to contain the price back in. Usually the untouched side can be bought back worthless and once that untouched side is gone you are free to roll your touched side as needed to capture the stock price. I will write more about this strategy in my next post.
This means that we will most likely be in a constant trade on one or the other side (either a put or call side). But I am fine with as it is like a game to me. And I am a playful guy.
What is our goal trading options?
I said that many times and I will repeat it again and again (to myself). I learn to trade options to create a constant and reliable source of income which I can invest into dividend growth stocks.
For this reason, my strategy is also tailored to be mechanical and eliminating any emotions and second guessing. I know what I want to trade, how, and when. And I do it every week. And it is the same thing, same trade methodology, and same execution every week. This allows me to ignore any noise in the market and not tremble in fear “what if I open a trade and it goes against me”.
· Options Trading Results
As stated above our trading in January was really great and we made $2,468.87 dollars.
Below you can see all data and progress in our trading account:
Month-to-moth trading results

(The red dots on the chart indicate income estimate, blue bars actual earnings.)
| In January we made: |
34 trades |
| Total trades in 2017: |
34 trades |
| January 2017 options trading income: |
$2,468.87 (72.06%) |
| 2017 portfolio Net-Liq (net)*: |
$4,580.66 (+33.68%) |
| 2017 portfolio Net-Liq (gross)*: |
$25,080.66 (+9.40%) |
| 2017 portfolio Cash Value (net)*: |
$24,720.33 (+24.61%) |
| 2017 portfolio Cash Value (gross)*: |
$45,220.33 (+24.61%) |
| 2017 portfolio Equity (net)*: |
$33,602.33 (+18.81%) |
| 2017 portfolio Equity (gross)*: |
$54,102.33 (+18.81%) |
| 2017 Liability/Debt: |
$20,500.00 (0.00%) |
| 2017 overall trading account result: |
+33.69% |
* The numbers marked as “net” and “gross” are results with loan (liability) included (gross) or excluded (net).
· Option trades review
In January 2017 we traded stocks which provided good trading opportunity and great premiums.
Here are results of the individual trades we traded this month and my comments:
ESV

(Click to enlarge)
ESV no longer offers premiums I like to see and to take a risk for. In order to bring an income from this stock I would have to trade long term (more than 45 DTE) trades and that is not what I am interested in.
This stock also no longer meets my trading criteria so I am no longer actively trading this stock. However, I am still sitting in a long term trades I took in 2016 and managing those trades hoping they soon will end.
In 2016 I had to take an adjustment and roll a few of my calls higher as the stock jumped up. I also had more calls than puts in this stock and this month, I decided to balance this trade. So I sold 6 new naked puts for this stock. If everything goes well, in June 2017 I should be able to unload a portion of this stock.
I was assigned to 200 shares of ESV in 2016 at $11 a share. As of now, the stock is trading above $11 a share and I hope, in June 2017 I might be able to let my calls assign and sell the shares.
LULU

(Click to enlarge)
LULU is another trade I decided to trade no longer. I collected nice premiums since I started trading this stock ($3,844 total income), but the stock doesn’t meet my trading criteria (and it never has) so I decided to stop trading this stock.
As of now, I only manage the open trades until I will be able to close them all and be done with this stock.
MNK

(Click to enlarge)
MNK is another stock I no longer want to trade but must wait for it to be able to close it. There is no problem with the stock, I do not have any trouble with it, I just need to wait as those trades are also long term trades.
In January 2017 the stock offered an opportunity to adjust the existing trades without rolling them further away, improve the positions, and collect more credit. Thus I could open a few put trades to balance my open trades. I had only puts in one month and calls in the other month, so I added calls to my existing put trades and puts to my existing call trades converting them all to strangles. This operation had no impact on options buying power and delivered nice credit too. It also allowed me to lower the put strikes.
Nevertheless, I no longer wish to trade options using this stock so I will be managing the open trades until I will be able to get out. But no active trading anymore.
WYNN

(Click to enlarge)
WYNN is another trouble maker stock for me. It is overly volatile and I am terribly overexposed in this stock. I was thinking how I can reduce my exposure in this stock without taking large losses. I think I finally came up with an idea how to offset the losses.
First, I moved the options expiration far, far away so I didn’t have to deal with this trade and be able to focus on other trades. So I moved it into January 2019. Not optimal, but I did it when the stock crashed hard when Chinese officials announced limiting ATM cash withdrawals in casinos in Macau and other resorts. WYNN crashed more than 10% in 15 minutes. It happened in November 2016 and I had to take some losses. But I also decided to move the stock away so i didn’t have to worry about it.
Today, I have to deal with it again as the stock went up on (in my opinion bogus) earnings results in Macau. The WYNN resort missed badly in the US but in Macau the results were good. The stock jumped way above my calls. In my previous adjustments I managed to have 100 strike calls and 82.50 & 85 puts. Now the stock is at 103 a share.
I do not believe this stock would go higher, but I may be wrong. Nevertheless, this gives me an opportunity to unload. So I used profits from other trades and offset losses when closing some puts.
I bought back one 82.50 contract for approx. $1,100 debit, used $930 dollars profit from another trade to offset the loss and then rolled one 100 call strike up to 125 strike call and sold a new 82.50 put against it. I collected approx. $175 dollars credit doing so. This adjustment then cost me zero dollars and had a positive impact on my buying power. I will continue doing this in the coming months and unloading puts. When the stock crashes again at some point in the future, I will start unloading calls.
After I unload, I will be done with this stock too. In the future, I may decide to trade 1 or 2 contracts, but not now nor near future, though.
STX
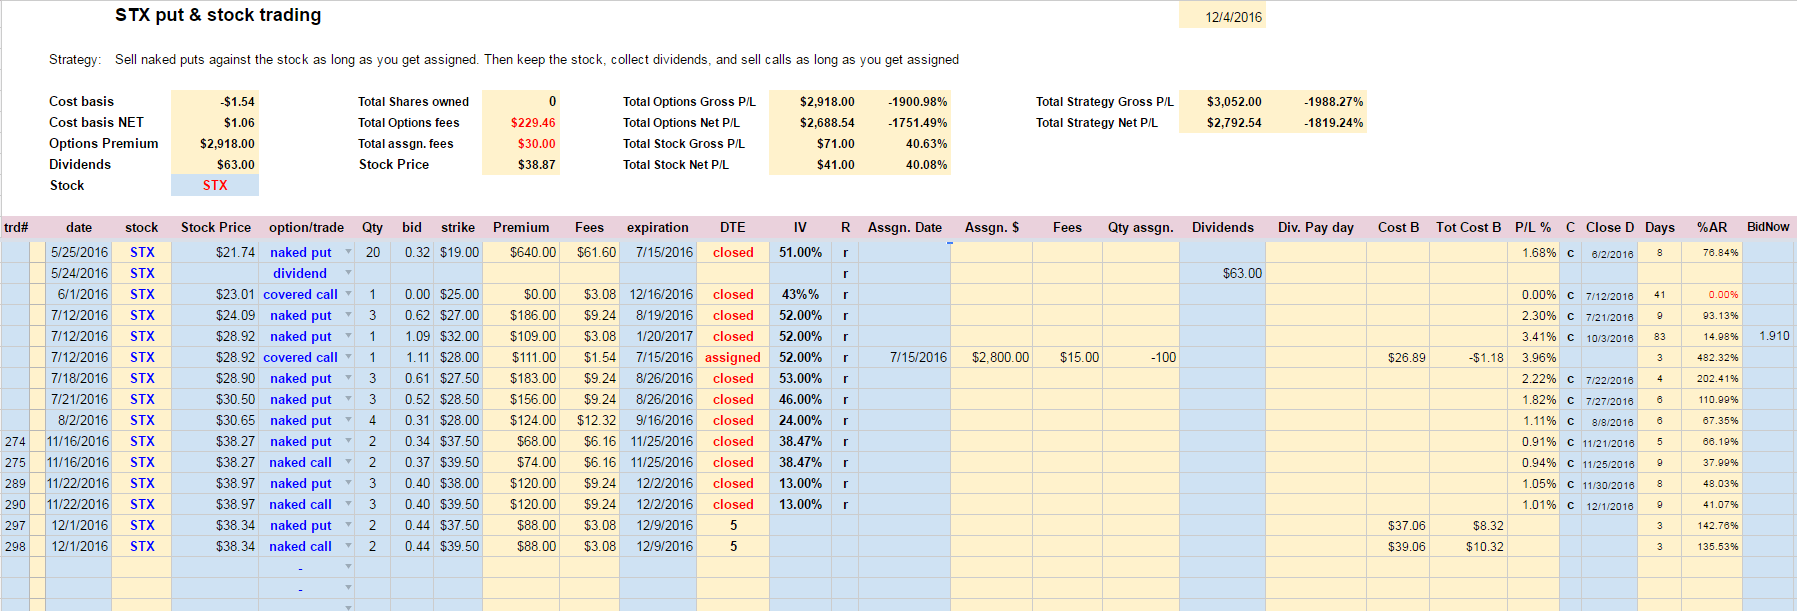
(Click to enlarge)
STX is a stock which meets my trading criteria perfectly and I keep trading this stock actively. I will trade this stock as long as it performs. When it stops performing, I will start looking for a new candidate.
I keep trading short term, weekly strangles, keep them near the money or even sell at the money strikes. When one side gets deep in the money, I keep rolling the trade using straddles or inverted strangles.
Recently the stock reported earnings which beat estimates and the jump in price derailed my trading in this stock a bit so I had to roll my extremely deep in the money up and four weeks away instead of weeklys. I also had to sell deep in the money puts to be able to move the calls up. But I am OK with it as today I keep adjusting and rolling the trade lowering my puts and keeping the calls near the money (as of today I am in an inverted strangle).
In total, I was able to collect $5,002.50 dollars in premiums since I started trading this stock.
X

(Click to enlarge)
X is another stock I like to trade actively. It meets my criteria perfectly and I was able to trade weekly expiration strangles against this stock. Lately, when the stock was drifting down, I was rolling puts down while my old calls were being closed for profit and I could sell new calls to help offset debits when rolling puts.
This strategy works perfectly when the stock behaves non-violently. It can be selling all the time, price going down for weeks or months and it doesn’t endanger my trading unless the selloff is a sudden drop, big jump, or panic selling (or buying). Then that derails the trading and longer term and deep in the money rolling may be needed.
EARNINGS!!!
BMY
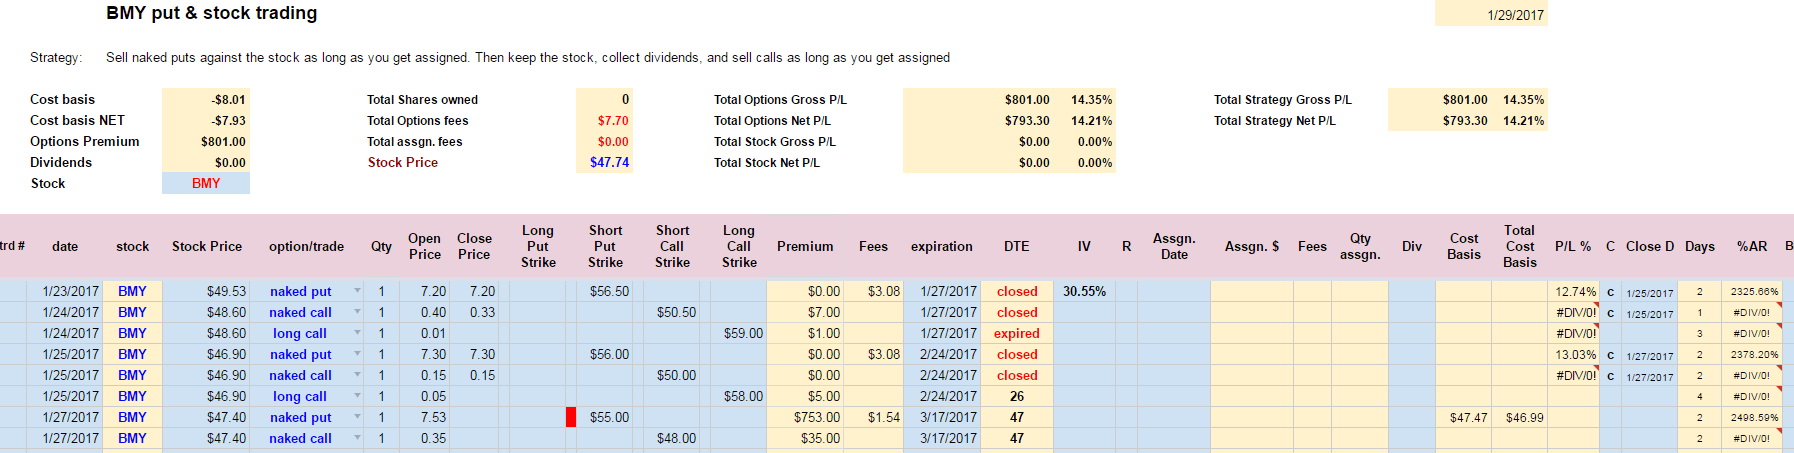
(Click to enlarge)
BMY was a trade I wouldn’t normally take. A few traders in our Facebook Group were involved in this trade and when the stock tumbled from 56.50 a share all the way down to 46.90 many were unsure how to manage the trade and get out.
Then the questions pop out. Should you let the options assign and buy the stock? Or should you close the trade and take a loss? Or is there any other way to fix this trade?
I offered a help and take this trade to show how I would manage it if it was my trade.
So, I sold a 56.50 strike put of BMY when it was trading at 49.53 a share. Now it was my trade!
Since I opened the trade on January 23rd I started rolling the puts down using strangles and inverted strangles. I could roll our 56.50 puts down to 55.00 strike so far. Unfortunately, many traders in the group got assigned to the stock. I wasn’t though, and continued rolling this trade out and down.
it will take time before we will be able to get out of this trade. And you may also think that I was completely crazy to take someone else’s losing trade just to show off my trading ability and undertake potentially huge losses. But I like the challenge!
GOOGL

(Click to enlarge)
GOOGL was an earnings play trade. I opened an Iron Condor (well, correctly it was a Short Iron Butterfly trade) with the following strikes:
+880 call
-855 call
-855 put
+830 put
and we collected $2,020 credit for this trade. We opened the trade on Thursday, January 26, before market closed. The next day, on Friday, January 27 we closed the trade for a total profit of $930 dollars (a nice 37% profit overnight).
ETE

(Click to enlarge)
Originally, I opened this trade with ETE stock as a triple play – dividend capture trade. It became a hard to manage trade. During the life of this trade I realized how difficult it was to manage this underlying symbol with options. I like ETE, but as options trading instrument it is untradeable.
So I decided to not manage the options into assignment and rather I would purchase the stock out right to capture the dividend and immediately after sell ITM covered call to get out of the stock.
Are you Ready to Trade?
If you like results of our trading open yourself an account with OptionsHouse.com and start trading with a low commission rates + free virtual trading tool!
Your new trading account will come with a paper money account and will be immediately funded with $5,000 of virtual money for you to test the options trading and if you join our trading group on Facebook you can get a guidance, ideas, and trading education. Before you commit your real hard-earned money you can use the virtual account to test our strategies, learn, and ask all questions you need to learn options trading.
Once you learn and get ready, start trading live account and earn monthly income similar to ours. And we will be happy to assist you with that.
Seize the opportunity. Open a new OptionsHouse Account Today! Open and fund an OptionsHouse account to receive up to $1,000 worth of commissions on online trades for 60 days.
· Options Trading Income & Equity Goals
For 2017 we plan to create the following average monthly income from trading:
2016 plan: $1,000 monthly income – COMPLETED in July 2016
2016 plan: $2,000 monthly income – COMPLETED in October 2016
2017 plan: $4,000 monthly income – IN PROGRESS ($2,468.87)
Note, these are monthly averages based on 12 month results. The individual monthly results month to month may differ.
For 2017 we plan to increase our portfolio equity:
at the end of 2017 plan: $130,000 equity – IN PROGRESS ($54,102.16)
When we reach the desired equity level we will apply for a portfolio margin in our trading account. This would allow us to increase our trading (and leverage) and trade more trades and more often. That would allow me to increase income and start trading for a living as a full time trader. With portfolio margin we would be able to trade up to 5 times more than with a standard RegT margin.
I do not have yet experience with portfolio margin account, but my expectations are that with approx. $150,000 equity we will be able to trade up to $600,000 account. With average 9.60% monthly income we should be able to make about $57,600 average monthly income. And that would be a great result from options trading. Income like this would definitely help us to meet our other, investing and investing unrelated goals and dreams.
Overall, I am happy with our trading results in January. The only concern I have is that our net-liq and buying power is low dues to trades such as WYNN. We need cash flow and WYNN is literally preventing it. So ultimately, our next month(s) goal will be to release the cash as quickly as possible so we can continue trading in lieu of sitting on a dead cash.
What do you think about options trading?
We all want to hear your opinion on the article above:
4 Comments |
 Everybody is going bearish these days and our economy and politicians are not helping much. Retails saw three consecutive months of slowing sales and tomorrows data will probably help sinking this market lower. Trump fired another of his advisers (as I read on Investing.com: making this Presidency a joke) and futures sold off.


 Markets regained the upward trend momentum as it confirmed its trend continuation last Friday. What does that mean? It is simple, the trend will continue and it will make sense to be buying any dips should they occur.


Recent Comments