Weekly Newsletter   Challenge account   Weekly Newsletter   


Posted by Martin January 23, 2013
No Comments


Closing trade – PIMCO All Asset All Authority Fund Class D (PAUDX)


Originally my plan was to use non transaction mutual funds (NTF) as a savings vehicle. You can save a small amount of money without paying any commission or fees and as long as you save enough to buy the stock, sell the fund and buy the stock. I was looking for the fund which can provide some growth, is relatively cheap (low expense ratio), has nice yield and is free to buy. PIMCO All Asset All Authority Fund Class D (PAUDX) was a good choice.

But not anymore. I no longer like this approach – saving cash in a fund, then sell and buy a stock. The reasons for that are that you had to hold the NTFs for at least 180 days or you would be charged a redemption fee $49. The growth of the fund is questionable and the expense ration is now 2%. I think I can keep ETFs doing the same job for cheaper, or wait a bit with cash and then buy dividend stocks outright.

So I decided to close this position and use the money later buying a dividend paying stock – either adding a new position or adding to any of my existing positions.


We all want to hear your opinion on the article above:
No Comments


Posted by Martin January 23, 2013
6 Comments


Do you have your cash ready for market pullback?

Do you have your cash ready for market pullback?

In my previous article I advocated for keeping cash in my account for potential purchases when opportunities show up.

The principle I was looking at is save cash in the account during market upward run, minimize buying, only when a stock you are interested in shows you an excellent buying opportunity such as a dip (make sure the dip is not caused by a fundamental problem, but by big investors pushing the stock down to shake off retail investors, for example) or the stock currently trading at the support level, breaking from the base etc,.

When the market starts falling, then that will be my time to start looking for stocks on sale and use accumulated cash for buying. But do not use all of your cash all at once. Split your purchases in smaller lots. I use $800 or purchase lot.

Market direction

Looking at the market, we can still see a positive trend, but currently the market is extremely overbought.

Fear & Greed

I mentioned in my previous article that I like to use Fear & Greed indicator (see above) to get a quick sense of where the market is. You can find that chart at Money CNN website. Today, the chart indicates “Extreme Greed” and the value at 90, which is the same value as one year ago. And the similar value as two years ago.

If we assume that the market moves in cycles, we may expect a repetition in future. The future may look like the one at the beginning of 2012 with a slightly prolonged period of time hanging at those elevated levels, or in the middle of 2012 with sharper correction. The fact is, the market will not stay at these levels for ever and will correct or pull back.

The pullback may look like the end of 2010, relatively shallow one, but it will be there. It will happen.

Well, let’s take a look at VIX (volatility index) which I also look at when trying to find out what’s going on with the overall market.

VIX

The VIX index is currently at 12.43 level. When was the last time you saw the index that low?

Well, I save your time and tell you. In 2006 – 2007 period before the market crash in 2008 (by that, I do not want to imply that the market will crash). Look at the oscillators. Both, the Ultimate Oscillator and MACD are in oversold territory (but MACD is not indicating reversal yet).

However, This doesn’t mean, that the market will fail tomorrow and start falling like a rock. It looks like there is still a lot of capital flowing from bonds to stocks and we still may see a long period of market going up and up and up like without the end. When you take a look at intraday charts, you can see that the investors are picking up every dip which occurs and buying stocks. That indicates there is still a lot of money.

What to do?

Do you want to chase this market? All stocks I wanted to buy were following the overall market’s trend and they are overextended.

NGLS – dramatic break thru above 200 day MA. Great sign, but extended almost 10% above 50 day MA. The stock may correct this extended run back to 50 day and continue back up. Indicators are in overbought territory and slowing down.

PSEC – steady uptrend without a rest. Indicators slowing down dramatically, MACD showing a crossover and moving into negative territory. Ultimate Oscillator is already negative (but still close to overbought and heading down). Stock extended 6% above 50 day MA.

FGP – a parabolic run up, hitting upper Bollinger Band, reaching November 2012 major pivot point (top) or resistance, we may expect the stock to bounce off of it down before it breaks up. Ultimate Oscillator in overbought, MACD just crossed into a positive territory as well as Chaikin Money Flow indicator (which I also use). So this stock doesn’t look that bad, but signals are mixed to make a decision.

Do you want to start shorting the market (if it is your trading philosophy)? I wouldn’t do it either, although there is a growing number of traders who are moving to the bear side of the market out there.

However, I am still saving cash, because I believe, based on what I see on the charts (and I like it, because I can see nice capital gains), that this market is due for correction. It can be a small one, just down to 1450 level (SPX) or 1430 or even 1400. And that will be a great opportunity, to add more shares to my portfolio.

Why buying now, when the prices are high, when I can be comfortably saving cash (which I have to do anyway) and as soon as the market starts correcting start picking up those sweet cherries on the top of the cake instead of buying now and when the correction begins ride it and sitting on losing stocks for who knows how long. And honestly, I hate seeing my account with too many red numbers in it.

Happy Trading!


We all want to hear your opinion on the article above:
6 Comments


Posted by Martin January 20, 2013
No Comments


My inspiration in last week #6


I often browse the internet to find ideas about investing, trading stocks, options, investing opportunities and strategies. I like to read about investors and what their investing/trading approach to create income you can live on is.

This week I found the following interesting posts:

Secrets of Super Savers RevealedMy Journey to Financial Independence

20 Stocks with Yields over 10% and Highest Buy RatingsGuruFocus

Low-Volatility Stocks Consistently Outperform; Dividend Investors RejoiceSeeking Alpha

This Undervalued High Dividend Stock Should Rise In 2013Seeking Alpha

Five Minute InvestingThe Investment FAQ


We all want to hear your opinion on the article above:
No Comments


Posted by Martin January 17, 2013
No Comments


Trade adjustment – AT&T (T) addition


Yesterday, as AT&T continued slipping down, which I originally missed to recognize and also set my buy point too low so I got hit in a small bump up, I bought more shares of this stock. When buying stocks, I want the stock to be in upward move, so I usually set my price slightly above yesterday’s high, but try to be high enough not to get hit with a regular volatility. If the stock goes up, I buy. You can assume that the stock will continue up, so you should be ridding that move. If the stock won’t go up the trade shouldn’t execute and then you can trail down your buy order as long as the stock reverses.

With my first buy order of this stock I set the buy too low and got hit and the stock continued down. Well, I am still learning to master this strategy. I am not mad at myself however, I like the stock, I like the dividend it pays and the dividend growth. So as the stock went down, I added more shares.

01/16/2013 10:19:11 Bought 29 T @ 33.46

Total shares held as of today: 61
Estimated annual dividend: $109.8
Consecutive Dividend Increase: 8 years
Dividend yield today: 5.26%
Dividend 5yr Growth: 5.09%
Dividend paid since: 1881


We all want to hear your opinion on the article above:
No Comments


Posted by Martin January 16, 2013
2 Comments


The power of dividends


Today I sold my stake in Full Circle Capital (FULL) because I didn’t like the outlook of this company and I think, there is a potential for a dividend cut. In short, the FULL portfolio seems not supporting today’s dividend rate and the company pays more in dividends than it brings in.

So I sold the stock @7.51 a share and made $8.96 (commission excluded). That sounds like a bad trade, right? If I include commissions I actually lost money. If I include inflation for almost a year period of holding this stock, I lost even more money, right?

Well, the whole story is in dividends and that’s why I really like investing into dividend stocks. Over the period of holding this stock I received $98.56 in dividends. If I use those dividends to offset my cost basis of the stock, my profit then was $107.52 or 11.20%.

I think, that wasn’t a bad trade, wasn’t it?

So what to buy in lieu of FULL?

I have two potential candidates to buy. One is NGLS I wrote about in my previous post and the second is PSEC which has a lot better quality portfolio than FULL and thus safer dividend payout. Right now I am only waiting for a good entry price. Both stocks were in upward move, so I think it will be worth to wait for the first pull back to buy.

NGLS is right below 200 day MA, so before it breaks through, it will most likely retreat a bit and then I will buy.

PSEC already had that pullback about a week ago and then broke through the 200 day MA, but that break thru looks somewhat weak to me and the stock may pull back again. The price action looks like a consolidation to me, so I will wait for some move, if the stock moves up I will buy, if it moves down, I will wait for the price to drop further down and buy then.


We all want to hear your opinion on the article above:
2 Comments


Posted by Martin January 15, 2013
No Comments


Replacing FULL with NGLS


I do not have much to say, I just am not comfortable anymore holding Full Circle Capital (FULL). Although I liked monthly payment I didn’t like recent price action of the company, rumors of dividend cut, writing (issuing a new public offering) of new shares and thus diluting existing shareholders’ stake.

So I did little research trying to find some data about FULL because of the rumor about possible dividend cut. I also contacted FULL, investor’s department with questions and received no response.

Based on the information I could find on the internet my uncomfortable feeling of holding this stock increased. That’s why I decided to dump FULL and replace it with NGLS. It pays lower dividend, but still high enough (as of this writing it was 6.40%), the 5 yr average dividend growth 30.38%, 5 years of consecutive dividend increase, they are paying dividends since 2007 and increased the dividend recently.


We all want to hear your opinion on the article above:
No Comments


Posted by Martin January 13, 2013
4 Comments


My inspiration in last week #5


I often browse the internet to find ideas about investing, trading stocks, options, investing opportunities and strategies. I like to read about investors and what their investing/trading approach to create income you can live on is.

This week I found the following interesting posts:

Best US Dividend Stocks for 2013The Dividend Guy

Dividend Income ProjectionDividend Growth Machine

6 Stocks Expected to Grow Their Dividends in 2013Dividend Growth Stocks

Slow is Smooth & Smooth is FastBrick By Brick Investing

Microsoft Dividend Stock AnalysisDividend Growth Stock Investing

Realty Income – This Monthly Dividend Company Has Years Of Growth Ahead Of ItSeeking Alpha

Determining Dividend Growth Rate of Your PortfolioPassive Income Pursuit


We all want to hear your opinion on the article above:
4 Comments


Posted by Martin January 10, 2013
2 Comments


New trade – AT&T (T)


As I wrote in my previous post I am replacing ABT with AT&T due to overall drop in dividend payout receiving from ABT.

01/10/2013 09:31:41 Bought 32 T @ 34.41

Total shares held as of today: 32
Estimated annual dividend: $57.6
Consecutive Dividend Increase: 8 years
Dividend yield today: 5.26%
Dividend 5yr Growth: 5.09%
Dividend paid since: 1881


We all want to hear your opinion on the article above:
2 Comments


Posted by Martin January 10, 2013
No Comments


New trade – TASER International Inc (TASR) covered call


Another trade – covered call I decided to add to my portfolio. TASER International, Inc. develops, manufactures, and sells electronic control devices (ECD) for use in the law enforcement, military, corrections, private security, and personal defense markets. Analysts are bullish on this stock with the target from $10 – $11 per share. The stock is slowly marching toward that mark. With all the gun-talks and anti-gun talks this company benefits from the overall mess.

01/10/2013 10:33:51 Bought 100 TASR @ 9.37
01/10/2013 10:33:51 Sold 1 TASR Mar 16 2013 10.0 Call @ 0.5

Total trade: $887.00
Commissions: $8.78
Total NET trade: $895.78

Option assignment: $1000.00
Option assignment fee: $19.00
Expected proceeds: $981.00

Expected NET gain: $85.22
Expected ROI: 9.51%


We all want to hear your opinion on the article above:
No Comments


Posted by Martin January 09, 2013
No Comments


Replacing ABT with AT&T (T)

Replacing ABT with AT&T (T)

For the reasons I wrote in my previous article I am replacing Abbott with AT&T stock. This stock paid dividends since 1881 and it has a history of 8 years of increasing the dividend. Currently the stock is trading below 200 day MA and it pulled back due to ex-dividend date which was today (Jan-08, 2013). The company increased its dividend recently.

The stock created a corrective pattern and thus I am initiating a first buy and I opened a contingency order for tomorrow morning. If the stock rises above 34.70 I will open a limit order of 34.74 per share to buy 31 shares of this stock.

If the trade executes tomorrow, I will own 31 shares of AT&T which will bring me $55.8 annual dividend instead of $19.04 dividend provided by ABT.

If the stock surpasses the limit price, the order will not execute and I will continue waiting for next pullback.

AT&T

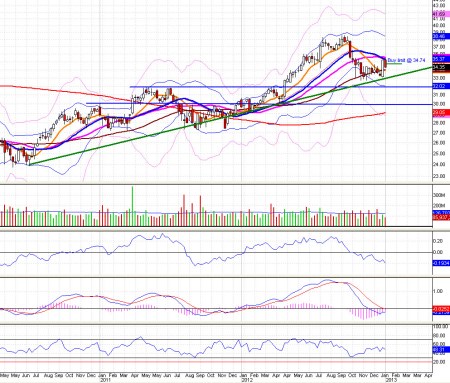
The daily chart above indicates the price action of AT&T. We are below 200 day MA, dropping back down (and the stock may drop even further) and getting close to the 3 year long term trend support line (the thick green line). Short term indicators such as CMF, MACD indicates rising interest in the stock, the ultimate oscillator is in overbought, which may indicate further drop of price.

AT&T 3 year chart

The 3 year chart show the price at the support line (the thick green line) bouncing off of the lower standard deviation Bollinger Band while staying slightly above 50 day MA (which is very positive indicator). However money flow CMF indicates heavy selling during this period. MACD seems to be slowing down its downward move and may create a divergence (which however may fail) and Ultimate oscillator is neutral.

AT&T has a dividend rate at $1.80 (5.00 % yield), 5-year annual dividend yield growth 4.8% and consecutive dividend increase for 8 years. The stock seems to be overvalued, however I am willing to initiate the trade if the price meet my trigger or wait for it if it doesn’t.

As far as ABT, I may get back to this stock and buy those shares back when I will be able to see and know more about this stock.


We all want to hear your opinion on the article above:
No Comments


This site has been fine-tuned by 14 WordPress Tweaks