Weekly Newsletter   Challenge account   Weekly Newsletter   


Trade exit – Realty Income (O) covered call expiration for 1.49% profit

Trade exit - Realty Income (O) covered call expiration for 1.49% profit

As I was worried last week how to deal with my covered call trade I opened on Realty Incomesee the trade here, this trade has changed into what I wanted in the first place. See the original trade here.

As I wrote in my previous reviews of the trade I mentioned that every investor or trader must have a plan before he places a trade. I tried to describe my plan in regards to this trade.

The plan is actually either a written or mental procedure of what you would do in each situation should that situation happen. With having this plan perfectly in place for each situation you won’t panic when that happens not knowing what to do.

I had a plan for a situation that the trade would go against me and that made me calm down. I actually was able to see some benefits of this trade going against me and you know what? I actually wanted this trade to go bad, because I liked the idea of taking the loss for tax purposes and significantly improve my cost basis of this stock.

This was a tight trade and tough one. Until the very last moment I didn’t know how the trade would end up. On Friday 10 minutes before 2 pm (MST) I was sitting in front of streaming chart having my finger on the “buy” button being ready to buy back the call. The reason why I decided not to let the covered call being assigned was that its price at the end of the day was only 15c (although the option was in-the money) so it was better to buy it back than let it being assigned. But literally a few minutes before close, the stock price dropped below strike and remained there making the option worthless.

By that I collected 100% gain or $61.21 for the flat trade (1.49% gain or 25.18% annualized return). Not bad if repeated every month, right?

So what will be next? Shall I open another trade?

I am planning on opening another covered call for October or November 2013, but right now I will be in a waiting mode. The reason that I do not want to jump in another covered call trade is that I do not know what the stock may do and I am receiving different signals.


Realty Income


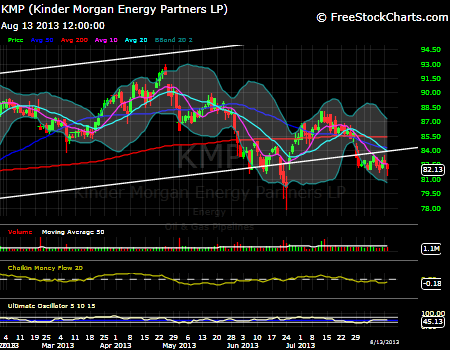
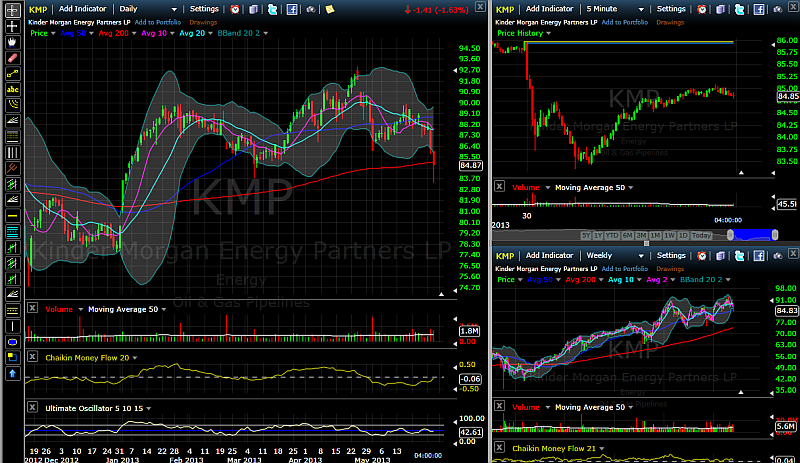
From the chart above I can see the following signals:

  1. The Chaikin Money Flow index indicate money flowing out of the stock – investors are heavily selling. It is of course apparent from the price action chart – negative
  2. The price of the stock just bounced off of the long term (the yellow line) trend. The yellow trend line indicates more than 5 year trend, so this is a significant bounce – negative.
  3. As the price bounced it also created a new lower high confirming the downtrend with no signal for reversal – negative.
  4. And here comes something what makes me unsure of the trend continuation – the trade volume spiked way above average. That may actually indicate a capitulation or end of the trend (trend reversal). It may not happen right away, but will this trend continue until the October expiration?
  5. This price action is confirmed by Bollinger bands which are getting narrower. That typically means that the stock is ready for a significant price action. Unfortunately, the Bollinger Bands won’t tell you which direction that price action would be, whether up or down. And these are the two reasons why I decided to wait and take action later upon confirmation of either a trend continuation or reversal.

When I will be sure which direction the stock will go, I will either sell another put or covered call contract. Until then I am waiting for my trade.


We all want to hear your opinion on the article above:
No Comments


Great dividend stocks offering a good entry point

Great dividend stocks offering a good entry point

As stocks are on the verge of fall there are now stocks which are providing yet another great entry point in my opinion. Since I started investing into dividend growth stocks last year I love to see stocks of my interest falling down. They still pay the same dividend payout or even increased their dividend rate, but some investors dump those stocks because they think that those stocks are doomed just because they missed one quarter or their outlook for next period is weak.

When looking at human life what is 80 or so years compared to eternity? Nothing. A spit into an ocean. I have the same look at Wall Street’s obsession about evaluating stocks based on one quarter. What is one quarter compared to 30 years of your investing time frame? Nothing.

Of course, you shouldn’t ignore those stocks. Our investing strategy isn’t buy and forget. But in our case we will see the troubles coming well before the Wall Street gurus tell us based on their thinking of a missed quarter. We will see a stagnant dividend or even a dividend cut and many times before it really happens. If the company is still doing great, increases the dividend and other metrics point to a fat cash flow, so the dividend remains sustainable, there is no need to panic. There actually is a need for opening our wallets and buying.

I believe, there are now stocks in this category offering nice entry point for your 30 year long dividend accumulation journey. Here they are:

Kinder Morgan Partnership (KMP)

I love KMP. It pays nice dividend. It’s current yield is at 6.40% and the company paid the dividend and increased it in 16 consecutive years. Do you think this long dividend increase history will suddenly stop today? I doubt.

It is one of the largest master limited partnerships with a very large economic moat. It’s recent acquisitions and portfolio cultivation poised this stock to a steady growth and there is no sign of troubles in the horizon (correct me if I am wrong).

Let’s take a look at the chart:

KMP

The chart shows 6 months time frame. The white lower line indicates a 5 year long support trend. the stock broke below this support time several times in 2009, 2011, 2012 and twice this year (both shown on the chart). It always recovered and continued higher. The entire stock history since 1992 is even better and I wish I could buy this stock back then.

Anytime KMP falls below a certain level when the yield gets close to 6.5% or above it more buyers chasing nice YOC step in and start buying. With current yield we are close to this point.

Stock details

Consecutive Dividend Increase: 16 years
Dividend yield today: 6.40%
Dividend 5yr Growth: 6.68%
Dividend paid since: 1992

Morningstar provides a fair value of this stock at $98 a share, so if that is something we can rely on, the stock is trading at a discount. An estimated growth rate is at 31.20%

Continue reading…


Pages: 1 2 3


We all want to hear your opinion on the article above:
11 Comments


Posted by Martin August 06, 2013
28 Comments


Trades & Income

Trades & Income

OUR TRADING SINCE SEPTEMBER 2023


In September 2023 we started trading what I call a “Crumbs Strategy.” The strategy is about trading SPX, stocks, and futures vertical spreads, Iron Condors, Strangles, or naked puts with short strikes far away from the market to increase likelihood of the trade expiring worthless and thus keeping the entire premium for a profit. So far, this trading was successful.

I also wanted my trades verified by a third party so visitors of this blog who are interested in reviewing my trading can be assured that I am posting all my trades and they are genuine, not just winning trades and hiding the losers. I found a website that does exactly that. You can visit my profile on Kinfo to check my verified performance.
 

Kinfo - verified trading
 

You can sign up (referral link) to Kinfo and track my trading or other traders.
 

OUR TRADING IN 2024


Here you can see all 2024 trades spreadsheet.
 

January 2024 trading
 
February 2024 trading
 
March 2024 trading
 

OUR TRADING IN 2023

 
December 2023 trading
 
November 2023 trading
 
October 2023 trading
 
September 2023 trading
 

Here you can see all trades spreadsheet.
 

Calendar Legend:
 

V = volume
T = number of trades traded
W = winners
L = losers


Pages: 1 2 3 4 5 6 7 8 9 10


We all want to hear your opinion on the article above:
28 Comments


Posted by Martin May 30, 2013
9 Comments


Next dividend paying stock worth adding to my portfolio – Kinder Morgan Partnership (KMP)

Next dividend paying stock worth adding to my portfolio - Kinder Morgan Partnership (KMP)

Stock sell off on every battle front continues. Well not every battle front but this shout sounded appealing to me so I used it. Yesterday and a few days ago I was interested in Realty Income, which fell from its parabolic run to sky heights. So it was obvious that it would fall. Many stocks had similar run up pattern, for example PPL or JNJ to name a few.

I am still very interested in adding more Realty Income shares to my portfolio, but my exposure to REITs industry is already too large and I need to look at other opportunities the market is now providing.

I have a few stocks in my portfolio which are now getting lower such as AT&T (T), KMP, MCD, and NGLS. Right at this moment, the most appealing stock to me is Kinder Morgan Partnership. As of this writing it is down -2.18% and it broke thru 200 day MA (see the chart below).

Kinder Morgan

When taking look at the 5 year chart, you can see similar dips along the way:

Kinder Morgan charts

(Click to enlarge)

Look at the bumpy road on the right lower corner in the smaller window showing 5 yr chart. KMP was growing and every time it touched 200 day MA, it bounced and continued higher. If you pull a chart on Yahoo.com and select maximum time frame, this trend is even more apparent.

Of course, this isn’t a guarantee, that KMP will behave this way in the future, but we can expect, that it will most likely do so.

Here are some numbers, why I like Kinder Morgan Energy Partnership

Dividend Yield: 5.90%
5 yr. Dividend Avg. Growth: 7.14%
Consecutive Div. Increases: 16 years
Gross Margin: 47.3%
Cash Flow: 3,134M
Cash per share: 2.85
Dividend Rate: 1.30

KMP’s operations span the entire midstream energy space, with a network of pipeline and storage assets that crosses the continent and is capable of transporting and storing natural gas, natural gas liquids, crude oil, refined product, and ethanol. Kinder even does a fair amount of business handling coal and steel for export in its terminals segment. With its presence in many segments and dominance in some, Kinder routinely earns well in excess of its capital costs, supporting its wide moat rating. In this business, the bigger the asset footprint, the greater the opportunity set for new investment, allowing firms like Kinder with competitive advantages to maintain their competitive position. (Source: Morningstar)

Although there is risk with this company (mainly regulatory and legislative risk), I think this is a good company and I am taking advantage of the recent price drop to add more shares to my current holdings.

If the last of KMP is greater or equal to 87.01
Buy 11 KMP at limit $87.01


There are other great companies which suffered loses and broke thru 50 day MA which I would consider adding. Among those I mentioned above the hottest candidates would be addition of MCD and opening a new position in Coca Cola company.


We all want to hear your opinion on the article above:
9 Comments


Posted by Martin May 10, 2013
3 Comments


Dividend paying stocks attractive to buy today


Today’s trading session brought a couple of stocks I own in my TD and ROTH IRA accounts which reversed enough to be once again attractive to buy or in other words: to add to my portfolio.

PPL Corporation is an energy and utility holding company. The Company operates in four segments: Kentucky Regulated, U.K. Regulated, Pennsylvania Regulated and Supply. Through its subsidiaries, PPL generates electricity from power plants in the northeastern, northwestern and southeastern United States; markets wholesale or retail energy primarily in the northeastern and northwestern portions of the United States; delivers electricity to customers in Pennsylvania, Kentucky, Virginia, Tennessee and the United Kingdom, and natural gas to customers in Kentucky. As of December 31, 2012, the Company’s subsidiaries were PPL Energy Supply, LLC (PPL Energy Supply), PPL Electric Utilities Corporation (PPL Electric), LG&E and KU Energy LLC (LKE), PPL Global, LLC (PPL Global), PPL EnergyPlus LLC (PPL EnergyPlus), PPL Generation LLC (PPL Generation), Louisville Gas and Electric Company (LG&E) and Kentucky Utilities Company (KU).

The stock corrected significantly from its top, see the chart

PPL

The stock paid and increased dividend for 13 consecutive years. It increased its dividend to $0.367500 (2.1% increase) and its current yield is 4.60%. The 5yr dividend growth rate for this company is 3.01%.

My calculated fair value is $35 a share and thus the company is currently trading below my fair value. The company has a very aggressive expenditure plan which can provide a solid base for 8% compound annual growth rate. Circa 65% of power generation is realized via a low cost power plants, which provides an edge for PPL for an eventual increase in power prices. The expenditure plan ($17.4 billion) may however provide a significant pressure to future dividends (also refer to company’s negative cash flow).

A negative free cash flow in many cases is not bad in itself. It could be a sign that a company is making large investments and if these investments earn a high return, the strategy has the potential to pay off in the long run.

Conclusion

I own PPL in my ROTH IRA account and I have owned for several years enjoying sustainable dividends and I plan to own this company for a long term run. If you want to add this company to your portfolio, I would apply a contingency order strategy to enter into a position. The stock has been falling for 7 consecutive days and today it broke below 50 day MA. This may be the end of the correction in this stock, as well as we still may see a further downside pressure. The next support for this stock is at $30 a share and $28 a share and we may see the stock re-testing one of these levels prior to reversing the trend.


We all want to hear your opinion on the article above:
3 Comments


Posted by Martin February 05, 2013
2 Comments


A correction? Looks like not.


Yesterday I wrote about a possibility of market turning into correction or pullback. I was aware however about new money flowing into the market, although in slowing pace than a month ago (see the yesterday’s chart and Chaikin Money Flow; any value above 0.10 is considered as heavy buying, although it is slowing down). Today, it was proven that investors were jumping in buying the dip. The market stopped for a moment to take a rest. As I mentioned yesterday, the sell off could only be a bump on the upward road. The market can only rest a bit in a consolidation pattern before it shoots higher. The earnings season was very strong and it is what keeps investors buying stocks. In my opinion, I would be cautious, because it is now difficult to see what the market wants to do. So I am sitting aside and saving money for upcoming opportunities. I will be buying stocks at these levels only if they present themselves as a great buy – lower than fair value, great story, pullback, etc.


We all want to hear your opinion on the article above:
2 Comments


Posted by Martin February 04, 2013
No Comments


A correction? Finally!

A correction? Finally!

Today, we probably have experienced a long anticipated correction to this extended market. It was a very impressive run, but in my opinion the stocks got expensive. Almost all indicators were in heavy overbought territory and a break was imminent. The question was, when. Was Monday the beginning of a correction? If so, I would say, finally!

I believe, and many stock charts confirm it, that no stock, no market goes straight up. It goes up in a seesaw trend, two steps up, one step down and so on. And if it happens going straight up as we witnessed a few weeks ago, then soon we would witness that one step down.

So can Monday be considered the beginning of a correction? It depends. From the pure technical analysis perspective the picture is not as clear as I would wish. The down candle stick wasn’t extended marking an exhaustion. So today’s trading may be just a little bump on the upward road.

If we however are in a correction, the next question would be, how deep and how long will it take? A million dollar question. As a trader I would care. As a dividend investor who wants to build an ever flowing income stream I do not care that much. I just take this as a new opportunity to add more shares into my portfolio for cheaper price.

Now the time has arrived to start watching my holdings and the stocks in my watch list even closely, because they may present great prices to pick up. For example, my latest trade was buying shares of Lorillard which I bought for 39.64 a share. With the correction when most of the stocks follow the entire market, I can add shares for even 38.20 a share (current support). Or even for less, if the stock breaks the support.

SPY

The chart above indicates my anticipation if I am correct in regards to selling in the market. Three indicators I use were in overbought levels and two of them already slowing down. Chaikin Money Flow, indicating whether money flow into the market or out of the market already turned down in January showing investors pulling their cash out of the market. The Ultimate Oscillator also started falling at the end of January. MACD followed today. You can see a slowdown and turning down.

Another indicator I like to watch is Fear and Greed index. Today’s chart shows the market dropping from extreme greed. We may potentially go all the way down to 40-ish level. How quickly and how fast, I do not know. It can be a slow volatile, bumpy process as we could see at the end of 2010 and beginning of 2011 or fast and almost straight drop as we could see at the end of 2012.

Fear & Greed Over Time

Such a drop however doesn’t mean a catastrophe. I actually see it as a healthy movement. A movement, which provides us with great prices while others are panicking. Also a drop to 40s doesn’t mean that the market will go that deep too. Fear & Greed index is more about volatility, rather than trends.

But how deep will we be going?

My first expectation would be where the support is. When you take a look at the SPY chart above, the market easily broke above a resistance level created by two major tops, one in September 2012, second in October 2012. We approached that resistance in December 2012 and corrected. Later, in January we broke thru without any resistance. But then the market slowed down. The new money flowing into the market dried up. The previous resistance became a support (see the green thick line at $146.85 level). My expectation, though, would be a pullback to that support. The next level would be at 144.73 (50 day MA) and worse case scenario at 140 level, but unless something terrible happens I do not expect going that far down.

Well, time will show. Get your muscles ready (read money), because we may see a great opportunity adding more shares. If you do not have your cash ready, you would have to wait and pass this opportunity.

Happy Trading!


We all want to hear your opinion on the article above:
No Comments


Posted by Martin January 23, 2013
6 Comments


Do you have your cash ready for market pullback?

Do you have your cash ready for market pullback?

In my previous article I advocated for keeping cash in my account for potential purchases when opportunities show up.

The principle I was looking at is save cash in the account during market upward run, minimize buying, only when a stock you are interested in shows you an excellent buying opportunity such as a dip (make sure the dip is not caused by a fundamental problem, but by big investors pushing the stock down to shake off retail investors, for example) or the stock currently trading at the support level, breaking from the base etc,.

When the market starts falling, then that will be my time to start looking for stocks on sale and use accumulated cash for buying. But do not use all of your cash all at once. Split your purchases in smaller lots. I use $800 or purchase lot.

Market direction

Looking at the market, we can still see a positive trend, but currently the market is extremely overbought.

Fear & Greed

I mentioned in my previous article that I like to use Fear & Greed indicator (see above) to get a quick sense of where the market is. You can find that chart at Money CNN website. Today, the chart indicates “Extreme Greed” and the value at 90, which is the same value as one year ago. And the similar value as two years ago.

If we assume that the market moves in cycles, we may expect a repetition in future. The future may look like the one at the beginning of 2012 with a slightly prolonged period of time hanging at those elevated levels, or in the middle of 2012 with sharper correction. The fact is, the market will not stay at these levels for ever and will correct or pull back.

The pullback may look like the end of 2010, relatively shallow one, but it will be there. It will happen.

Well, let’s take a look at VIX (volatility index) which I also look at when trying to find out what’s going on with the overall market.

VIX

The VIX index is currently at 12.43 level. When was the last time you saw the index that low?

Well, I save your time and tell you. In 2006 – 2007 period before the market crash in 2008 (by that, I do not want to imply that the market will crash). Look at the oscillators. Both, the Ultimate Oscillator and MACD are in oversold territory (but MACD is not indicating reversal yet).

However, This doesn’t mean, that the market will fail tomorrow and start falling like a rock. It looks like there is still a lot of capital flowing from bonds to stocks and we still may see a long period of market going up and up and up like without the end. When you take a look at intraday charts, you can see that the investors are picking up every dip which occurs and buying stocks. That indicates there is still a lot of money.

What to do?

Do you want to chase this market? All stocks I wanted to buy were following the overall market’s trend and they are overextended.

NGLS – dramatic break thru above 200 day MA. Great sign, but extended almost 10% above 50 day MA. The stock may correct this extended run back to 50 day and continue back up. Indicators are in overbought territory and slowing down.

PSEC – steady uptrend without a rest. Indicators slowing down dramatically, MACD showing a crossover and moving into negative territory. Ultimate Oscillator is already negative (but still close to overbought and heading down). Stock extended 6% above 50 day MA.

FGP – a parabolic run up, hitting upper Bollinger Band, reaching November 2012 major pivot point (top) or resistance, we may expect the stock to bounce off of it down before it breaks up. Ultimate Oscillator in overbought, MACD just crossed into a positive territory as well as Chaikin Money Flow indicator (which I also use). So this stock doesn’t look that bad, but signals are mixed to make a decision.

Do you want to start shorting the market (if it is your trading philosophy)? I wouldn’t do it either, although there is a growing number of traders who are moving to the bear side of the market out there.

However, I am still saving cash, because I believe, based on what I see on the charts (and I like it, because I can see nice capital gains), that this market is due for correction. It can be a small one, just down to 1450 level (SPX) or 1430 or even 1400. And that will be a great opportunity, to add more shares to my portfolio.

Why buying now, when the prices are high, when I can be comfortably saving cash (which I have to do anyway) and as soon as the market starts correcting start picking up those sweet cherries on the top of the cake instead of buying now and when the correction begins ride it and sitting on losing stocks for who knows how long. And honestly, I hate seeing my account with too many red numbers in it.

Happy Trading!


We all want to hear your opinion on the article above:
6 Comments


Posted by Martin January 09, 2013
No Comments


Replacing ABT with AT&T (T)

Replacing ABT with AT&T (T)

For the reasons I wrote in my previous article I am replacing Abbott with AT&T stock. This stock paid dividends since 1881 and it has a history of 8 years of increasing the dividend. Currently the stock is trading below 200 day MA and it pulled back due to ex-dividend date which was today (Jan-08, 2013). The company increased its dividend recently.

The stock created a corrective pattern and thus I am initiating a first buy and I opened a contingency order for tomorrow morning. If the stock rises above 34.70 I will open a limit order of 34.74 per share to buy 31 shares of this stock.

If the trade executes tomorrow, I will own 31 shares of AT&T which will bring me $55.8 annual dividend instead of $19.04 dividend provided by ABT.

If the stock surpasses the limit price, the order will not execute and I will continue waiting for next pullback.

AT&T

The daily chart above indicates the price action of AT&T. We are below 200 day MA, dropping back down (and the stock may drop even further) and getting close to the 3 year long term trend support line (the thick green line). Short term indicators such as CMF, MACD indicates rising interest in the stock, the ultimate oscillator is in overbought, which may indicate further drop of price.

AT&T 3 year chart

The 3 year chart show the price at the support line (the thick green line) bouncing off of the lower standard deviation Bollinger Band while staying slightly above 50 day MA (which is very positive indicator). However money flow CMF indicates heavy selling during this period. MACD seems to be slowing down its downward move and may create a divergence (which however may fail) and Ultimate oscillator is neutral.

AT&T has a dividend rate at $1.80 (5.00 % yield), 5-year annual dividend yield growth 4.8% and consecutive dividend increase for 8 years. The stock seems to be overvalued, however I am willing to initiate the trade if the price meet my trigger or wait for it if it doesn’t.

As far as ABT, I may get back to this stock and buy those shares back when I will be able to see and know more about this stock.


We all want to hear your opinion on the article above:
No Comments